
Key Insights
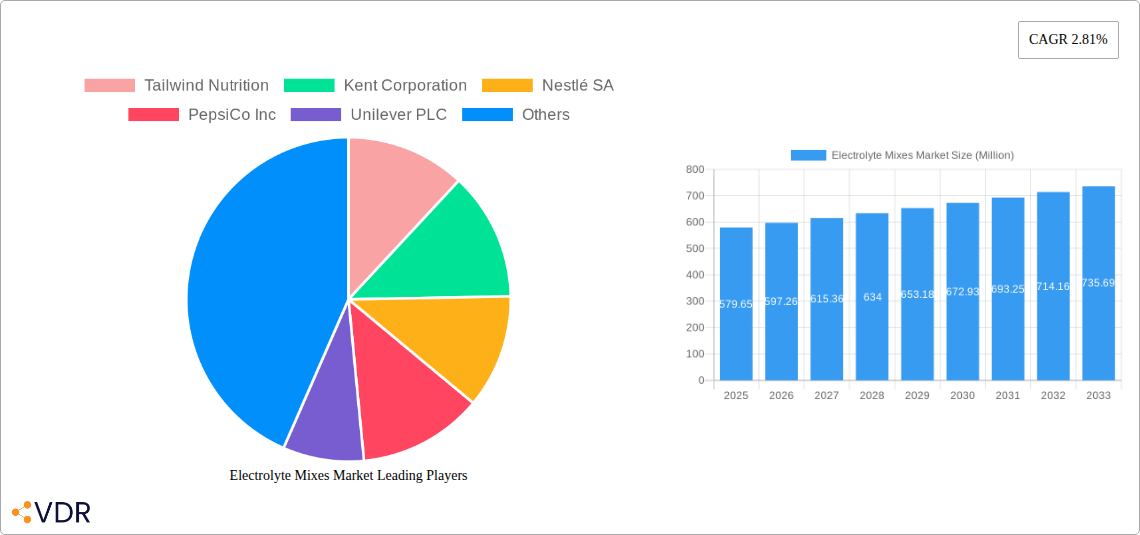
The global electrolyte mixes market, valued at $579.65 million in 2025, is projected to experience steady growth, driven by increasing health consciousness and the rising popularity of fitness activities. Consumers are increasingly aware of the importance of hydration and electrolyte replenishment, particularly among athletes and individuals engaging in strenuous physical activity. This demand fuels the growth of ready-to-drink (RTD) beverages, electrolyte powders, and tablets. The market is segmented by flavor (flavored and unflavored), distribution channel (supermarkets/hypermarkets, convenience stores, pharmacies/drug stores, online retail stores, and other channels), and product type (RTD beverages, electrolyte powders, and tablets). The convenience of RTD beverages contributes to their significant market share, while the cost-effectiveness and versatility of powders and tablets appeal to a wider consumer base. North America and Europe currently dominate the market due to higher disposable incomes and established health and wellness industries. However, Asia-Pacific is expected to witness significant growth in the coming years due to rising health awareness and increasing participation in sports and fitness activities. Competitive landscape analysis reveals key players such as Tailwind Nutrition, Nestlé SA, PepsiCo Inc., and Unilever PLC, actively engaged in product innovation and strategic partnerships to enhance their market position.
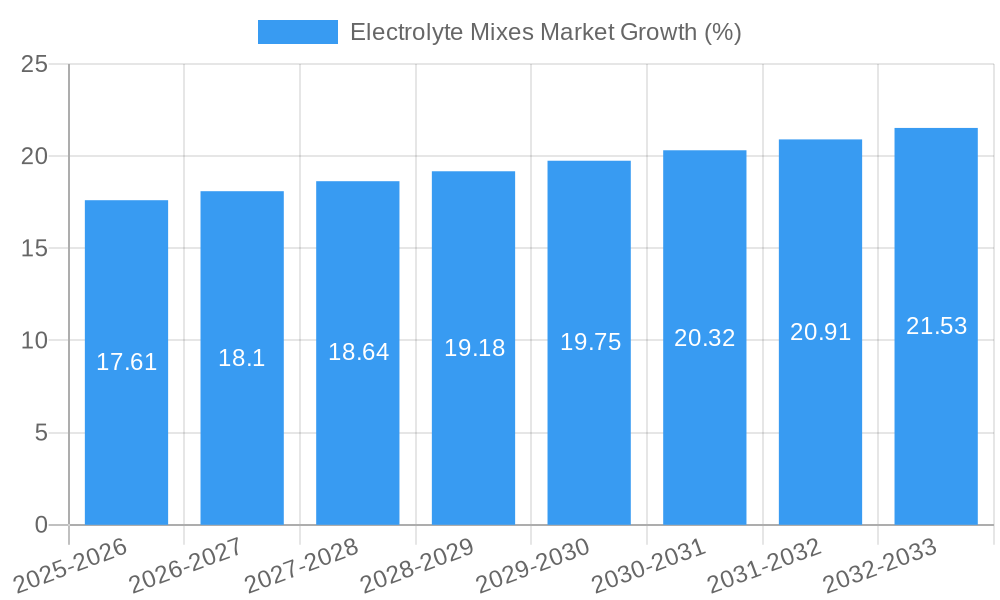
The projected Compound Annual Growth Rate (CAGR) of 2.81% from 2025 to 2033 indicates a consistent expansion of the market. However, factors such as fluctuating raw material prices and intense competition among established players could pose challenges. Growth opportunities lie in developing innovative product formulations with functional benefits, expanding distribution networks into emerging markets, and leveraging digital marketing strategies to reach a broader audience. Furthermore, focusing on sustainable packaging and promoting environmentally friendly production practices can attract environmentally conscious consumers. Future market growth will likely be influenced by evolving consumer preferences, technological advancements in product formulation, and the overall economic climate. Strategic collaborations and mergers and acquisitions among market players are also expected to shape the competitive landscape in the coming years.
Electrolyte Mixes Market: A Comprehensive Market Report (2019-2033)
This comprehensive report provides a detailed analysis of the Electrolyte Mixes Market, encompassing market dynamics, growth trends, regional segmentation, product landscape, and key player strategies. The study period covers 2019-2033, with a base year of 2025 and a forecast period of 2025-2033. The report offers valuable insights for industry professionals, investors, and stakeholders seeking to understand and capitalize on opportunities within this dynamic market. The parent market is the beverage market and the child market is sports nutrition and functional beverages. The global market size in 2025 is estimated to be XX Million Units.
Parent Market: Beverage Market; Child Market: Sports Nutrition and Functional Beverages
Electrolyte Mixes Market Market Dynamics & Structure
The Electrolyte Mixes market is characterized by moderate concentration, with several key players holding significant market share. Technological innovation, particularly in formulation and delivery systems (e.g., innovative powder blends, enhanced absorption technologies), is a crucial driver. Regulatory frameworks concerning labeling, claims, and ingredient safety significantly impact market dynamics. Competitive substitutes include plain water, energy drinks, and other hydration products. The end-user demographic is broad, encompassing athletes, fitness enthusiasts, individuals engaging in strenuous activities, and consumers seeking general hydration benefits.
- Market Concentration: Moderately concentrated, with top 5 players holding approximately xx% market share in 2024.
- Technological Innovation: Focus on improved taste, enhanced absorption, and functional benefits (e.g., probiotics, added vitamins).
- Regulatory Landscape: Stringent regulations on labeling, ingredient claims, and safety standards vary across regions.
- Competitive Substitutes: Water, energy drinks, isotonic drinks pose competitive challenges.
- End-User Demographics: Athletes, fitness enthusiasts, consumers seeking general health benefits.
- M&A Activity: A moderate level of mergers and acquisitions, primarily driven by expansion and product diversification strategies (xx deals in the last 5 years).
Electrolyte Mixes Market Growth Trends & Insights
The Electrolyte Mixes market exhibits a steady growth trajectory, driven by increasing health consciousness, rising disposable incomes in emerging economies, and the growing popularity of fitness and sports activities. The market is witnessing significant adoption rates, particularly among younger demographics. Technological disruptions, such as the introduction of novel formulations and convenient packaging formats (e.g., single-serve pouches, ready-to-drink beverages), further fuel growth. Consumer behavior is shifting towards healthier and functional beverage options, contributing to market expansion. The CAGR from 2025 to 2033 is projected to be xx%, reaching an estimated market size of XX Million Units by 2033. Market penetration is expected to increase significantly, especially in developing countries.
Dominant Regions, Countries, or Segments in Electrolyte Mixes Market
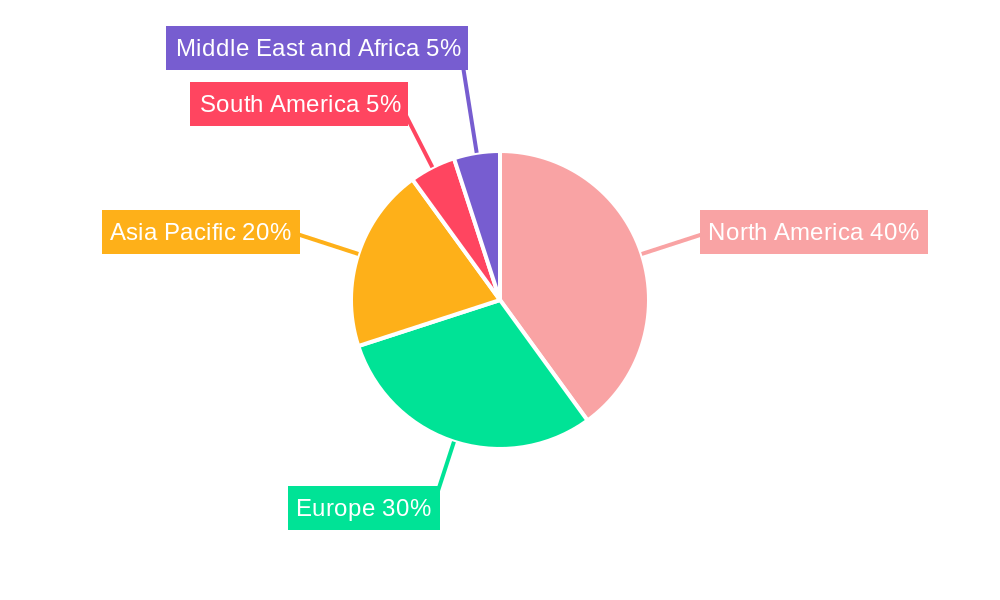
North America currently dominates the Electrolyte Mixes market, followed by Europe and Asia-Pacific. Within product types, Ready-to-Drink (RTD) beverages hold the largest market share due to their convenience, while electrolyte powders demonstrate significant growth potential driven by cost-effectiveness and versatility. Supermarkets/Hypermarkets and online retail channels are leading distribution channels, reflecting consumers' changing shopping habits.
- Leading Region: North America (accounts for xx% of global market share in 2024).
- Key Drivers (North America): High disposable incomes, strong fitness culture, and wide availability of products.
- Key Drivers (Europe): Growing health consciousness, increasing participation in sports and fitness activities.
- Key Drivers (Asia-Pacific): Rising disposable incomes, increasing urbanization, and growing demand for functional beverages.
- Dominant Product Type: RTD Beverages (xx% market share in 2024).
- Dominant Distribution Channel: Supermarkets/Hypermarkets (xx% market share in 2024).
Electrolyte Mixes Market Product Landscape
The Electrolyte Mixes market offers a diverse range of products, including RTD beverages, powders, and tablets, each catering to specific consumer preferences and usage occasions. Product innovation focuses on enhancing taste profiles, optimizing electrolyte balance, and incorporating functional ingredients such as probiotics, vitamins, and antioxidants. Unique selling propositions include enhanced hydration, improved performance benefits, and targeted health benefits. Technological advancements involve the development of more stable and efficient delivery systems.
Key Drivers, Barriers & Challenges in Electrolyte Mixes Market
Key Drivers: Rising health awareness, increasing participation in sports and fitness, growing demand for convenient and functional beverages, and technological advancements in formulation and packaging.
Challenges & Restraints: Fluctuations in raw material prices, stringent regulatory requirements, intense competition from established beverage companies, and potential health concerns associated with high sugar content in some products. Supply chain disruptions may lead to production and distribution limitations, impacting market growth by an estimated xx% annually.
Emerging Opportunities in Electrolyte Mixes Market
The market presents several opportunities for growth. Untapped markets in developing economies offer significant potential. The rising popularity of plant-based and organic options creates opportunities for specialized products. Product diversification through functional additions, personalized hydration solutions, and convenient packaging formats will further drive market expansion.
Growth Accelerators in the Electrolyte Mixes Market Industry
Technological innovations, strategic collaborations (e.g., partnerships with sports teams or fitness influencers), and aggressive market expansion strategies into untapped geographic markets are crucial growth catalysts. Product differentiation through the incorporation of emerging functional ingredients or innovative delivery systems is equally important.
Key Players Shaping the Electrolyte Mixes Market Market
- Tailwind Nutrition
- Kent Corporation
- Nestlé SA
- PepsiCo Inc
- Unilever PLC
- Abbott Laboratories
- LyteLine LLC
- Otsuka Holdings Co Ltd
- Vitalyte Sports Nutrition Inc
- Ultima Health Products Inc
Notable Milestones in Electrolyte Mixes Market Sector
- JUL 2021: Nestlé Health Science acquired Nuun, expanding its functional hydration product portfolio.
- MAR 2022: Gatorade Canada partnered with Canada Soccer, enhancing brand visibility and market penetration.
- MAY 2022: Liquid IV launched Hydration Multiplier+ Powdered Probiotic Kombucha, adding a novel product with functional benefits.
In-Depth Electrolyte Mixes Market Market Outlook
The Electrolyte Mixes market is poised for continued growth, driven by evolving consumer preferences for healthier and functional beverages. Strategic partnerships, innovative product launches, and expansion into new geographic markets will further fuel market expansion. The focus on convenient packaging and product diversification will create significant opportunities for market players in the years to come. The market is expected to witness significant growth, presenting lucrative opportunities for businesses willing to innovate and adapt to changing market trends.
Electrolyte Mixes Market Segmentation
-
1. Product Type
- 1.1. RTD Beverages
- 1.2. Electrolyte Powders
- 1.3. Tablets
-
2. Flavor
- 2.1. Flavored
- 2.2. Unflavored
-
3. Distribution Channel
- 3.1. Supermarkets/Hypermarkets
- 3.2. Convenience Stores
- 3.3. Pharmacies/Drug Stores
- 3.4. Online Retail Stores
- 3.5. Other Distribution Channels
Electrolyte Mixes Market Segmentation By Geography
-
1. North America
- 1.1. United States
- 1.2. Canada
- 1.3. Mexico
- 1.4. Rest of North America
-
2. Europe
- 2.1. United Kingdom
- 2.2. Germany
- 2.3. France
- 2.4. Russia
- 2.5. Italy
- 2.6. Spain
- 2.7. Rest of Europe
-
3. Asia Pacific
- 3.1. China
- 3.2. India
- 3.3. Japan
- 3.4. Australia
- 3.5. Rest of Asia Pacific
-
4. South America
- 4.1. Brazil
- 4.2. Argentina
- 4.3. Rest of South America
-
5. Middle East and Africa
- 5.1. South Africa
- 5.2. United Arab Emirates
- 5.3. Rest of Middle East and Africa
Electrolyte Mixes Market REPORT HIGHLIGHTS
| Aspects | Details |
|---|---|
| Study Period | 2019-2033 |
| Base Year | 2024 |
| Estimated Year | 2025 |
| Forecast Period | 2025-2033 |
| Historical Period | 2019-2024 |
| Growth Rate | CAGR of 2.81% from 2019-2033 |
| Segmentation |
|
Table of Contents
- 1. Introduction
- 1.1. Research Scope
- 1.2. Market Segmentation
- 1.3. Research Methodology
- 1.4. Definitions and Assumptions
- 2. Executive Summary
- 2.1. Introduction
- 3. Market Dynamics
- 3.1. Introduction
- 3.2. Market Drivers
- 3.2.1. Rising Demand For Ready Meals Food Products to Influence Growth; Increasing Demand for Organic and Vegan Ready-to-Eat food products.
- 3.3. Market Restrains
- 3.3.1. Rising Concern Over Health Issues Associated with Processed Foods
- 3.4. Market Trends
- 3.4.1 Surging Interest Among Consumers in Physical Activities
- 3.4.2 Including Gyms
- 4. Market Factor Analysis
- 4.1. Porters Five Forces
- 4.2. Supply/Value Chain
- 4.3. PESTEL analysis
- 4.4. Market Entropy
- 4.5. Patent/Trademark Analysis
- 5. Global Electrolyte Mixes Market Analysis, Insights and Forecast, 2019-2031
- 5.1. Market Analysis, Insights and Forecast - by Product Type
- 5.1.1. RTD Beverages
- 5.1.2. Electrolyte Powders
- 5.1.3. Tablets
- 5.2. Market Analysis, Insights and Forecast - by Flavor
- 5.2.1. Flavored
- 5.2.2. Unflavored
- 5.3. Market Analysis, Insights and Forecast - by Distribution Channel
- 5.3.1. Supermarkets/Hypermarkets
- 5.3.2. Convenience Stores
- 5.3.3. Pharmacies/Drug Stores
- 5.3.4. Online Retail Stores
- 5.3.5. Other Distribution Channels
- 5.4. Market Analysis, Insights and Forecast - by Region
- 5.4.1. North America
- 5.4.2. Europe
- 5.4.3. Asia Pacific
- 5.4.4. South America
- 5.4.5. Middle East and Africa
- 5.1. Market Analysis, Insights and Forecast - by Product Type
- 6. North America Electrolyte Mixes Market Analysis, Insights and Forecast, 2019-2031
- 6.1. Market Analysis, Insights and Forecast - by Product Type
- 6.1.1. RTD Beverages
- 6.1.2. Electrolyte Powders
- 6.1.3. Tablets
- 6.2. Market Analysis, Insights and Forecast - by Flavor
- 6.2.1. Flavored
- 6.2.2. Unflavored
- 6.3. Market Analysis, Insights and Forecast - by Distribution Channel
- 6.3.1. Supermarkets/Hypermarkets
- 6.3.2. Convenience Stores
- 6.3.3. Pharmacies/Drug Stores
- 6.3.4. Online Retail Stores
- 6.3.5. Other Distribution Channels
- 6.1. Market Analysis, Insights and Forecast - by Product Type
- 7. Europe Electrolyte Mixes Market Analysis, Insights and Forecast, 2019-2031
- 7.1. Market Analysis, Insights and Forecast - by Product Type
- 7.1.1. RTD Beverages
- 7.1.2. Electrolyte Powders
- 7.1.3. Tablets
- 7.2. Market Analysis, Insights and Forecast - by Flavor
- 7.2.1. Flavored
- 7.2.2. Unflavored
- 7.3. Market Analysis, Insights and Forecast - by Distribution Channel
- 7.3.1. Supermarkets/Hypermarkets
- 7.3.2. Convenience Stores
- 7.3.3. Pharmacies/Drug Stores
- 7.3.4. Online Retail Stores
- 7.3.5. Other Distribution Channels
- 7.1. Market Analysis, Insights and Forecast - by Product Type
- 8. Asia Pacific Electrolyte Mixes Market Analysis, Insights and Forecast, 2019-2031
- 8.1. Market Analysis, Insights and Forecast - by Product Type
- 8.1.1. RTD Beverages
- 8.1.2. Electrolyte Powders
- 8.1.3. Tablets
- 8.2. Market Analysis, Insights and Forecast - by Flavor
- 8.2.1. Flavored
- 8.2.2. Unflavored
- 8.3. Market Analysis, Insights and Forecast - by Distribution Channel
- 8.3.1. Supermarkets/Hypermarkets
- 8.3.2. Convenience Stores
- 8.3.3. Pharmacies/Drug Stores
- 8.3.4. Online Retail Stores
- 8.3.5. Other Distribution Channels
- 8.1. Market Analysis, Insights and Forecast - by Product Type
- 9. South America Electrolyte Mixes Market Analysis, Insights and Forecast, 2019-2031
- 9.1. Market Analysis, Insights and Forecast - by Product Type
- 9.1.1. RTD Beverages
- 9.1.2. Electrolyte Powders
- 9.1.3. Tablets
- 9.2. Market Analysis, Insights and Forecast - by Flavor
- 9.2.1. Flavored
- 9.2.2. Unflavored
- 9.3. Market Analysis, Insights and Forecast - by Distribution Channel
- 9.3.1. Supermarkets/Hypermarkets
- 9.3.2. Convenience Stores
- 9.3.3. Pharmacies/Drug Stores
- 9.3.4. Online Retail Stores
- 9.3.5. Other Distribution Channels
- 9.1. Market Analysis, Insights and Forecast - by Product Type
- 10. Middle East and Africa Electrolyte Mixes Market Analysis, Insights and Forecast, 2019-2031
- 10.1. Market Analysis, Insights and Forecast - by Product Type
- 10.1.1. RTD Beverages
- 10.1.2. Electrolyte Powders
- 10.1.3. Tablets
- 10.2. Market Analysis, Insights and Forecast - by Flavor
- 10.2.1. Flavored
- 10.2.2. Unflavored
- 10.3. Market Analysis, Insights and Forecast - by Distribution Channel
- 10.3.1. Supermarkets/Hypermarkets
- 10.3.2. Convenience Stores
- 10.3.3. Pharmacies/Drug Stores
- 10.3.4. Online Retail Stores
- 10.3.5. Other Distribution Channels
- 10.1. Market Analysis, Insights and Forecast - by Product Type
- 11. North America Electrolyte Mixes Market Analysis, Insights and Forecast, 2019-2031
- 11.1. Market Analysis, Insights and Forecast - By Country/Sub-region
- 11.1.1 United States
- 11.1.2 Canada
- 11.1.3 Mexico
- 11.1.4 Rest of North America
- 12. Europe Electrolyte Mixes Market Analysis, Insights and Forecast, 2019-2031
- 12.1. Market Analysis, Insights and Forecast - By Country/Sub-region
- 12.1.1 United Kingdom
- 12.1.2 Germany
- 12.1.3 France
- 12.1.4 Russia
- 12.1.5 Italy
- 12.1.6 Spain
- 12.1.7 Rest of Europe
- 13. Asia Pacific Electrolyte Mixes Market Analysis, Insights and Forecast, 2019-2031
- 13.1. Market Analysis, Insights and Forecast - By Country/Sub-region
- 13.1.1 China
- 13.1.2 India
- 13.1.3 Japan
- 13.1.4 Australia
- 13.1.5 Rest of Asia Pacific
- 14. South America Electrolyte Mixes Market Analysis, Insights and Forecast, 2019-2031
- 14.1. Market Analysis, Insights and Forecast - By Country/Sub-region
- 14.1.1 Brazil
- 14.1.2 Argentina
- 14.1.3 Rest of South America
- 15. Middle East and Africa Electrolyte Mixes Market Analysis, Insights and Forecast, 2019-2031
- 15.1. Market Analysis, Insights and Forecast - By Country/Sub-region
- 15.1.1 South Africa
- 15.1.2 United Arab Emirates
- 15.1.3 Rest of Middle East and Africa
- 16. Competitive Analysis
- 16.1. Global Market Share Analysis 2024
- 16.2. Company Profiles
- 16.2.1 Tailwind Nutrition
- 16.2.1.1. Overview
- 16.2.1.2. Products
- 16.2.1.3. SWOT Analysis
- 16.2.1.4. Recent Developments
- 16.2.1.5. Financials (Based on Availability)
- 16.2.2 Kent Corporation
- 16.2.2.1. Overview
- 16.2.2.2. Products
- 16.2.2.3. SWOT Analysis
- 16.2.2.4. Recent Developments
- 16.2.2.5. Financials (Based on Availability)
- 16.2.3 Nestlé SA
- 16.2.3.1. Overview
- 16.2.3.2. Products
- 16.2.3.3. SWOT Analysis
- 16.2.3.4. Recent Developments
- 16.2.3.5. Financials (Based on Availability)
- 16.2.4 PepsiCo Inc
- 16.2.4.1. Overview
- 16.2.4.2. Products
- 16.2.4.3. SWOT Analysis
- 16.2.4.4. Recent Developments
- 16.2.4.5. Financials (Based on Availability)
- 16.2.5 Unilever PLC
- 16.2.5.1. Overview
- 16.2.5.2. Products
- 16.2.5.3. SWOT Analysis
- 16.2.5.4. Recent Developments
- 16.2.5.5. Financials (Based on Availability)
- 16.2.6 Abbott Laboratories
- 16.2.6.1. Overview
- 16.2.6.2. Products
- 16.2.6.3. SWOT Analysis
- 16.2.6.4. Recent Developments
- 16.2.6.5. Financials (Based on Availability)
- 16.2.7 LyteLine LLC
- 16.2.7.1. Overview
- 16.2.7.2. Products
- 16.2.7.3. SWOT Analysis
- 16.2.7.4. Recent Developments
- 16.2.7.5. Financials (Based on Availability)
- 16.2.8 Otsuka Holdings Co Ltd
- 16.2.8.1. Overview
- 16.2.8.2. Products
- 16.2.8.3. SWOT Analysis
- 16.2.8.4. Recent Developments
- 16.2.8.5. Financials (Based on Availability)
- 16.2.9 Vitalyte Sports Nutrition Inc *List Not Exhaustive
- 16.2.9.1. Overview
- 16.2.9.2. Products
- 16.2.9.3. SWOT Analysis
- 16.2.9.4. Recent Developments
- 16.2.9.5. Financials (Based on Availability)
- 16.2.10 Ultima Health Products Inc
- 16.2.10.1. Overview
- 16.2.10.2. Products
- 16.2.10.3. SWOT Analysis
- 16.2.10.4. Recent Developments
- 16.2.10.5. Financials (Based on Availability)
- 16.2.1 Tailwind Nutrition
List of Figures
- Figure 1: Global Electrolyte Mixes Market Revenue Breakdown (Million, %) by Region 2024 & 2032
- Figure 2: North America Electrolyte Mixes Market Revenue (Million), by Country 2024 & 2032
- Figure 3: North America Electrolyte Mixes Market Revenue Share (%), by Country 2024 & 2032
- Figure 4: Europe Electrolyte Mixes Market Revenue (Million), by Country 2024 & 2032
- Figure 5: Europe Electrolyte Mixes Market Revenue Share (%), by Country 2024 & 2032
- Figure 6: Asia Pacific Electrolyte Mixes Market Revenue (Million), by Country 2024 & 2032
- Figure 7: Asia Pacific Electrolyte Mixes Market Revenue Share (%), by Country 2024 & 2032
- Figure 8: South America Electrolyte Mixes Market Revenue (Million), by Country 2024 & 2032
- Figure 9: South America Electrolyte Mixes Market Revenue Share (%), by Country 2024 & 2032
- Figure 10: Middle East and Africa Electrolyte Mixes Market Revenue (Million), by Country 2024 & 2032
- Figure 11: Middle East and Africa Electrolyte Mixes Market Revenue Share (%), by Country 2024 & 2032
- Figure 12: North America Electrolyte Mixes Market Revenue (Million), by Product Type 2024 & 2032
- Figure 13: North America Electrolyte Mixes Market Revenue Share (%), by Product Type 2024 & 2032
- Figure 14: North America Electrolyte Mixes Market Revenue (Million), by Flavor 2024 & 2032
- Figure 15: North America Electrolyte Mixes Market Revenue Share (%), by Flavor 2024 & 2032
- Figure 16: North America Electrolyte Mixes Market Revenue (Million), by Distribution Channel 2024 & 2032
- Figure 17: North America Electrolyte Mixes Market Revenue Share (%), by Distribution Channel 2024 & 2032
- Figure 18: North America Electrolyte Mixes Market Revenue (Million), by Country 2024 & 2032
- Figure 19: North America Electrolyte Mixes Market Revenue Share (%), by Country 2024 & 2032
- Figure 20: Europe Electrolyte Mixes Market Revenue (Million), by Product Type 2024 & 2032
- Figure 21: Europe Electrolyte Mixes Market Revenue Share (%), by Product Type 2024 & 2032
- Figure 22: Europe Electrolyte Mixes Market Revenue (Million), by Flavor 2024 & 2032
- Figure 23: Europe Electrolyte Mixes Market Revenue Share (%), by Flavor 2024 & 2032
- Figure 24: Europe Electrolyte Mixes Market Revenue (Million), by Distribution Channel 2024 & 2032
- Figure 25: Europe Electrolyte Mixes Market Revenue Share (%), by Distribution Channel 2024 & 2032
- Figure 26: Europe Electrolyte Mixes Market Revenue (Million), by Country 2024 & 2032
- Figure 27: Europe Electrolyte Mixes Market Revenue Share (%), by Country 2024 & 2032
- Figure 28: Asia Pacific Electrolyte Mixes Market Revenue (Million), by Product Type 2024 & 2032
- Figure 29: Asia Pacific Electrolyte Mixes Market Revenue Share (%), by Product Type 2024 & 2032
- Figure 30: Asia Pacific Electrolyte Mixes Market Revenue (Million), by Flavor 2024 & 2032
- Figure 31: Asia Pacific Electrolyte Mixes Market Revenue Share (%), by Flavor 2024 & 2032
- Figure 32: Asia Pacific Electrolyte Mixes Market Revenue (Million), by Distribution Channel 2024 & 2032
- Figure 33: Asia Pacific Electrolyte Mixes Market Revenue Share (%), by Distribution Channel 2024 & 2032
- Figure 34: Asia Pacific Electrolyte Mixes Market Revenue (Million), by Country 2024 & 2032
- Figure 35: Asia Pacific Electrolyte Mixes Market Revenue Share (%), by Country 2024 & 2032
- Figure 36: South America Electrolyte Mixes Market Revenue (Million), by Product Type 2024 & 2032
- Figure 37: South America Electrolyte Mixes Market Revenue Share (%), by Product Type 2024 & 2032
- Figure 38: South America Electrolyte Mixes Market Revenue (Million), by Flavor 2024 & 2032
- Figure 39: South America Electrolyte Mixes Market Revenue Share (%), by Flavor 2024 & 2032
- Figure 40: South America Electrolyte Mixes Market Revenue (Million), by Distribution Channel 2024 & 2032
- Figure 41: South America Electrolyte Mixes Market Revenue Share (%), by Distribution Channel 2024 & 2032
- Figure 42: South America Electrolyte Mixes Market Revenue (Million), by Country 2024 & 2032
- Figure 43: South America Electrolyte Mixes Market Revenue Share (%), by Country 2024 & 2032
- Figure 44: Middle East and Africa Electrolyte Mixes Market Revenue (Million), by Product Type 2024 & 2032
- Figure 45: Middle East and Africa Electrolyte Mixes Market Revenue Share (%), by Product Type 2024 & 2032
- Figure 46: Middle East and Africa Electrolyte Mixes Market Revenue (Million), by Flavor 2024 & 2032
- Figure 47: Middle East and Africa Electrolyte Mixes Market Revenue Share (%), by Flavor 2024 & 2032
- Figure 48: Middle East and Africa Electrolyte Mixes Market Revenue (Million), by Distribution Channel 2024 & 2032
- Figure 49: Middle East and Africa Electrolyte Mixes Market Revenue Share (%), by Distribution Channel 2024 & 2032
- Figure 50: Middle East and Africa Electrolyte Mixes Market Revenue (Million), by Country 2024 & 2032
- Figure 51: Middle East and Africa Electrolyte Mixes Market Revenue Share (%), by Country 2024 & 2032
List of Tables
- Table 1: Global Electrolyte Mixes Market Revenue Million Forecast, by Region 2019 & 2032
- Table 2: Global Electrolyte Mixes Market Revenue Million Forecast, by Product Type 2019 & 2032
- Table 3: Global Electrolyte Mixes Market Revenue Million Forecast, by Flavor 2019 & 2032
- Table 4: Global Electrolyte Mixes Market Revenue Million Forecast, by Distribution Channel 2019 & 2032
- Table 5: Global Electrolyte Mixes Market Revenue Million Forecast, by Region 2019 & 2032
- Table 6: Global Electrolyte Mixes Market Revenue Million Forecast, by Country 2019 & 2032
- Table 7: United States Electrolyte Mixes Market Revenue (Million) Forecast, by Application 2019 & 2032
- Table 8: Canada Electrolyte Mixes Market Revenue (Million) Forecast, by Application 2019 & 2032
- Table 9: Mexico Electrolyte Mixes Market Revenue (Million) Forecast, by Application 2019 & 2032
- Table 10: Rest of North America Electrolyte Mixes Market Revenue (Million) Forecast, by Application 2019 & 2032
- Table 11: Global Electrolyte Mixes Market Revenue Million Forecast, by Country 2019 & 2032
- Table 12: United Kingdom Electrolyte Mixes Market Revenue (Million) Forecast, by Application 2019 & 2032
- Table 13: Germany Electrolyte Mixes Market Revenue (Million) Forecast, by Application 2019 & 2032
- Table 14: France Electrolyte Mixes Market Revenue (Million) Forecast, by Application 2019 & 2032
- Table 15: Russia Electrolyte Mixes Market Revenue (Million) Forecast, by Application 2019 & 2032
- Table 16: Italy Electrolyte Mixes Market Revenue (Million) Forecast, by Application 2019 & 2032
- Table 17: Spain Electrolyte Mixes Market Revenue (Million) Forecast, by Application 2019 & 2032
- Table 18: Rest of Europe Electrolyte Mixes Market Revenue (Million) Forecast, by Application 2019 & 2032
- Table 19: Global Electrolyte Mixes Market Revenue Million Forecast, by Country 2019 & 2032
- Table 20: China Electrolyte Mixes Market Revenue (Million) Forecast, by Application 2019 & 2032
- Table 21: India Electrolyte Mixes Market Revenue (Million) Forecast, by Application 2019 & 2032
- Table 22: Japan Electrolyte Mixes Market Revenue (Million) Forecast, by Application 2019 & 2032
- Table 23: Australia Electrolyte Mixes Market Revenue (Million) Forecast, by Application 2019 & 2032
- Table 24: Rest of Asia Pacific Electrolyte Mixes Market Revenue (Million) Forecast, by Application 2019 & 2032
- Table 25: Global Electrolyte Mixes Market Revenue Million Forecast, by Country 2019 & 2032
- Table 26: Brazil Electrolyte Mixes Market Revenue (Million) Forecast, by Application 2019 & 2032
- Table 27: Argentina Electrolyte Mixes Market Revenue (Million) Forecast, by Application 2019 & 2032
- Table 28: Rest of South America Electrolyte Mixes Market Revenue (Million) Forecast, by Application 2019 & 2032
- Table 29: Global Electrolyte Mixes Market Revenue Million Forecast, by Country 2019 & 2032
- Table 30: South Africa Electrolyte Mixes Market Revenue (Million) Forecast, by Application 2019 & 2032
- Table 31: United Arab Emirates Electrolyte Mixes Market Revenue (Million) Forecast, by Application 2019 & 2032
- Table 32: Rest of Middle East and Africa Electrolyte Mixes Market Revenue (Million) Forecast, by Application 2019 & 2032
- Table 33: Global Electrolyte Mixes Market Revenue Million Forecast, by Product Type 2019 & 2032
- Table 34: Global Electrolyte Mixes Market Revenue Million Forecast, by Flavor 2019 & 2032
- Table 35: Global Electrolyte Mixes Market Revenue Million Forecast, by Distribution Channel 2019 & 2032
- Table 36: Global Electrolyte Mixes Market Revenue Million Forecast, by Country 2019 & 2032
- Table 37: United States Electrolyte Mixes Market Revenue (Million) Forecast, by Application 2019 & 2032
- Table 38: Canada Electrolyte Mixes Market Revenue (Million) Forecast, by Application 2019 & 2032
- Table 39: Mexico Electrolyte Mixes Market Revenue (Million) Forecast, by Application 2019 & 2032
- Table 40: Rest of North America Electrolyte Mixes Market Revenue (Million) Forecast, by Application 2019 & 2032
- Table 41: Global Electrolyte Mixes Market Revenue Million Forecast, by Product Type 2019 & 2032
- Table 42: Global Electrolyte Mixes Market Revenue Million Forecast, by Flavor 2019 & 2032
- Table 43: Global Electrolyte Mixes Market Revenue Million Forecast, by Distribution Channel 2019 & 2032
- Table 44: Global Electrolyte Mixes Market Revenue Million Forecast, by Country 2019 & 2032
- Table 45: United Kingdom Electrolyte Mixes Market Revenue (Million) Forecast, by Application 2019 & 2032
- Table 46: Germany Electrolyte Mixes Market Revenue (Million) Forecast, by Application 2019 & 2032
- Table 47: France Electrolyte Mixes Market Revenue (Million) Forecast, by Application 2019 & 2032
- Table 48: Russia Electrolyte Mixes Market Revenue (Million) Forecast, by Application 2019 & 2032
- Table 49: Italy Electrolyte Mixes Market Revenue (Million) Forecast, by Application 2019 & 2032
- Table 50: Spain Electrolyte Mixes Market Revenue (Million) Forecast, by Application 2019 & 2032
- Table 51: Rest of Europe Electrolyte Mixes Market Revenue (Million) Forecast, by Application 2019 & 2032
- Table 52: Global Electrolyte Mixes Market Revenue Million Forecast, by Product Type 2019 & 2032
- Table 53: Global Electrolyte Mixes Market Revenue Million Forecast, by Flavor 2019 & 2032
- Table 54: Global Electrolyte Mixes Market Revenue Million Forecast, by Distribution Channel 2019 & 2032
- Table 55: Global Electrolyte Mixes Market Revenue Million Forecast, by Country 2019 & 2032
- Table 56: China Electrolyte Mixes Market Revenue (Million) Forecast, by Application 2019 & 2032
- Table 57: India Electrolyte Mixes Market Revenue (Million) Forecast, by Application 2019 & 2032
- Table 58: Japan Electrolyte Mixes Market Revenue (Million) Forecast, by Application 2019 & 2032
- Table 59: Australia Electrolyte Mixes Market Revenue (Million) Forecast, by Application 2019 & 2032
- Table 60: Rest of Asia Pacific Electrolyte Mixes Market Revenue (Million) Forecast, by Application 2019 & 2032
- Table 61: Global Electrolyte Mixes Market Revenue Million Forecast, by Product Type 2019 & 2032
- Table 62: Global Electrolyte Mixes Market Revenue Million Forecast, by Flavor 2019 & 2032
- Table 63: Global Electrolyte Mixes Market Revenue Million Forecast, by Distribution Channel 2019 & 2032
- Table 64: Global Electrolyte Mixes Market Revenue Million Forecast, by Country 2019 & 2032
- Table 65: Brazil Electrolyte Mixes Market Revenue (Million) Forecast, by Application 2019 & 2032
- Table 66: Argentina Electrolyte Mixes Market Revenue (Million) Forecast, by Application 2019 & 2032
- Table 67: Rest of South America Electrolyte Mixes Market Revenue (Million) Forecast, by Application 2019 & 2032
- Table 68: Global Electrolyte Mixes Market Revenue Million Forecast, by Product Type 2019 & 2032
- Table 69: Global Electrolyte Mixes Market Revenue Million Forecast, by Flavor 2019 & 2032
- Table 70: Global Electrolyte Mixes Market Revenue Million Forecast, by Distribution Channel 2019 & 2032
- Table 71: Global Electrolyte Mixes Market Revenue Million Forecast, by Country 2019 & 2032
- Table 72: South Africa Electrolyte Mixes Market Revenue (Million) Forecast, by Application 2019 & 2032
- Table 73: United Arab Emirates Electrolyte Mixes Market Revenue (Million) Forecast, by Application 2019 & 2032
- Table 74: Rest of Middle East and Africa Electrolyte Mixes Market Revenue (Million) Forecast, by Application 2019 & 2032
Frequently Asked Questions
1. What is the projected Compound Annual Growth Rate (CAGR) of the Electrolyte Mixes Market?
The projected CAGR is approximately 2.81%.
2. Which companies are prominent players in the Electrolyte Mixes Market?
Key companies in the market include Tailwind Nutrition, Kent Corporation, Nestlé SA, PepsiCo Inc, Unilever PLC, Abbott Laboratories, LyteLine LLC, Otsuka Holdings Co Ltd, Vitalyte Sports Nutrition Inc *List Not Exhaustive, Ultima Health Products Inc.
3. What are the main segments of the Electrolyte Mixes Market?
The market segments include Product Type, Flavor, Distribution Channel.
4. Can you provide details about the market size?
The market size is estimated to be USD 579.65 Million as of 2022.
5. What are some drivers contributing to market growth?
Rising Demand For Ready Meals Food Products to Influence Growth; Increasing Demand for Organic and Vegan Ready-to-Eat food products..
6. What are the notable trends driving market growth?
Surging Interest Among Consumers in Physical Activities. Including Gyms.
7. Are there any restraints impacting market growth?
Rising Concern Over Health Issues Associated with Processed Foods.
8. Can you provide examples of recent developments in the market?
MAY 2022: Liquid IV announced the launch of Hydration Multiplier+ Powdered Probiotic Kombucha, a blendable mixture that contains electrolytes, Liquid IV's BC30 Probiotic, which boasts an impressive 1 billion colony forming units (CFU), and a powdered kombucha. These components together help in boosting gut health.
9. What pricing options are available for accessing the report?
Pricing options include single-user, multi-user, and enterprise licenses priced at USD 4750, USD 5250, and USD 8750 respectively.
10. Is the market size provided in terms of value or volume?
The market size is provided in terms of value, measured in Million.
11. Are there any specific market keywords associated with the report?
Yes, the market keyword associated with the report is "Electrolyte Mixes Market," which aids in identifying and referencing the specific market segment covered.
12. How do I determine which pricing option suits my needs best?
The pricing options vary based on user requirements and access needs. Individual users may opt for single-user licenses, while businesses requiring broader access may choose multi-user or enterprise licenses for cost-effective access to the report.
13. Are there any additional resources or data provided in the Electrolyte Mixes Market report?
While the report offers comprehensive insights, it's advisable to review the specific contents or supplementary materials provided to ascertain if additional resources or data are available.
14. How can I stay updated on further developments or reports in the Electrolyte Mixes Market?
To stay informed about further developments, trends, and reports in the Electrolyte Mixes Market, consider subscribing to industry newsletters, following relevant companies and organizations, or regularly checking reputable industry news sources and publications.
Methodology
Step 1 - Identification of Relevant Samples Size from Population Database


Step 2 - Approaches for Defining Global Market Size (Value, Volume* & Price*)

Note*: In applicable scenarios
Step 3 - Data Sources
Primary Research
- Web Analytics
- Survey Reports
- Research Institute
- Latest Research Reports
- Opinion Leaders
Secondary Research
- Annual Reports
- White Paper
- Latest Press Release
- Industry Association
- Paid Database
- Investor Presentations

Step 4 - Data Triangulation
Involves using different sources of information in order to increase the validity of a study
These sources are likely to be stakeholders in a program - participants, other researchers, program staff, other community members, and so on.
Then we put all data in single framework & apply various statistical tools to find out the dynamic on the market.
During the analysis stage, feedback from the stakeholder groups would be compared to determine areas of agreement as well as areas of divergence


