
Key Insights
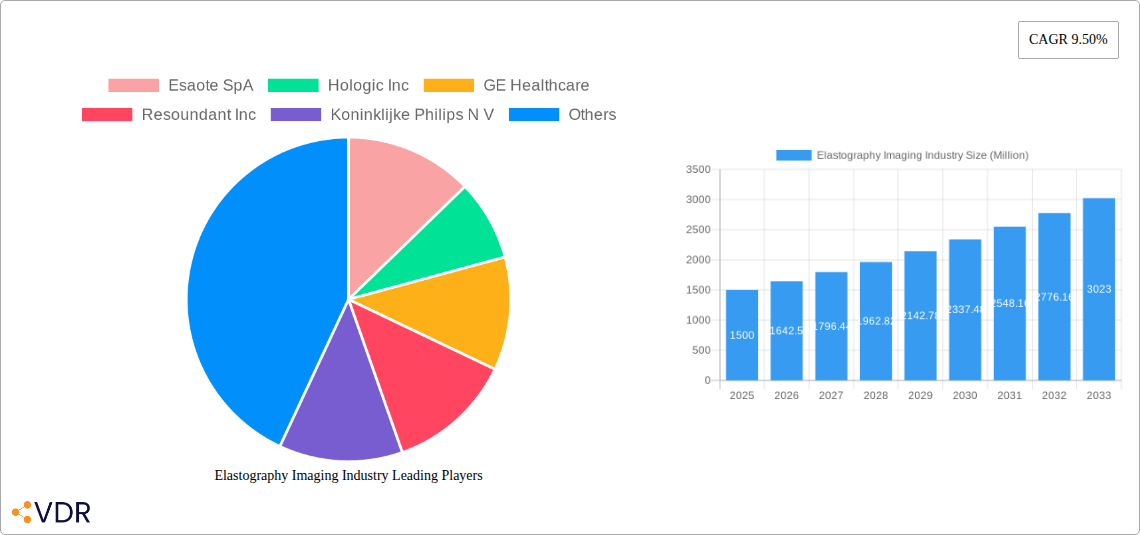
The elastography imaging market is experiencing robust growth, driven by the increasing prevalence of chronic diseases like liver fibrosis, cancer, and cardiovascular conditions. The non-invasive nature of elastography, offering detailed tissue stiffness assessment, makes it a valuable diagnostic tool supplementing traditional imaging techniques like ultrasound and MRI. This is particularly crucial in early disease detection and treatment monitoring, leading to improved patient outcomes and reduced healthcare costs. Technological advancements, such as improved image resolution and the development of more user-friendly systems, further contribute to market expansion. The market is segmented by modality (ultrasound elastography holding the largest share due to its affordability and accessibility), application (cardiology and radiology being major segments), and end-user (hospitals and diagnostic centers dominating). The high CAGR of 9.50% indicates substantial future growth, projected to reach significant market value by 2033.
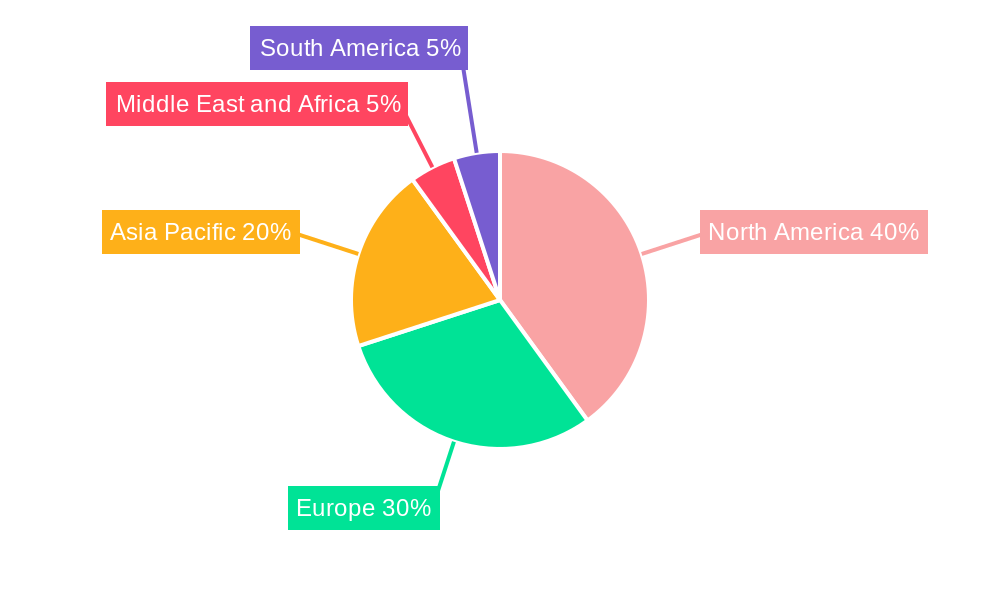
Geographical growth varies, with North America and Europe currently leading due to established healthcare infrastructure and high adoption rates. However, the Asia-Pacific region is poised for significant expansion fueled by increasing healthcare expenditure, rising awareness of chronic diseases, and the growing adoption of advanced medical technologies in developing economies. Competition among established players like Esaote, GE Healthcare, and Philips, alongside emerging innovative companies, is driving technological advancements and cost optimization, ultimately benefiting patients and healthcare providers. While regulatory hurdles and high initial investment costs might pose some challenges, the overall market outlook remains positive, promising sustained growth driven by the increasing demand for accurate and minimally invasive diagnostic procedures. The continuous development of hybrid imaging techniques combining elastography with other modalities is expected to further enhance the market's potential.
Elastography Imaging Industry Market Report: 2019-2033
This comprehensive report provides a detailed analysis of the Elastography Imaging industry, covering market dynamics, growth trends, regional segmentation, product landscape, key players, and future outlook. The study period spans from 2019 to 2033, with a focus on the forecast period from 2025 to 2033 (Base Year: 2025, Estimated Year: 2025). The report's insights are invaluable for industry professionals, investors, and stakeholders seeking a deep understanding of this rapidly evolving sector. The total market size is predicted to reach xx Million by 2033.
Elastography Imaging Industry Market Dynamics & Structure
The Elastography Imaging market, encompassing parent markets of medical imaging and diagnostics and child markets like Ultrasound and MRI elastography, is characterized by moderate concentration with a few dominant players and numerous smaller niche competitors. Technological innovation is a key driver, particularly advancements in shear wave elastography (SWE) and acoustic radiation force impulse (ARFI) imaging. Regulatory frameworks, varying across geographies, influence market access and adoption rates. Competitive substitutes, such as traditional imaging modalities, exert pressure, while the growing prevalence of chronic diseases fuels demand. Market consolidation through mergers and acquisitions (M&A) is expected to continue, potentially leading to further market concentration.
- Market Concentration: Moderately concentrated, with top 5 players holding approximately xx% market share in 2024.
- Technological Innovation: SWE and ARFI improvements, AI integration for image analysis, miniaturization of devices are key drivers.
- Regulatory Landscape: Varied across regions, impacting approvals and reimbursement policies.
- Competitive Substitutes: Traditional imaging techniques like ultrasound and MRI (without elastography) present competition.
- End-User Demographics: Aging population and increasing prevalence of chronic diseases drive market growth.
- M&A Activity: Moderate level of M&A activity observed in the historical period (2019-2024), with xx deals recorded.
Elastography Imaging Industry Growth Trends & Insights
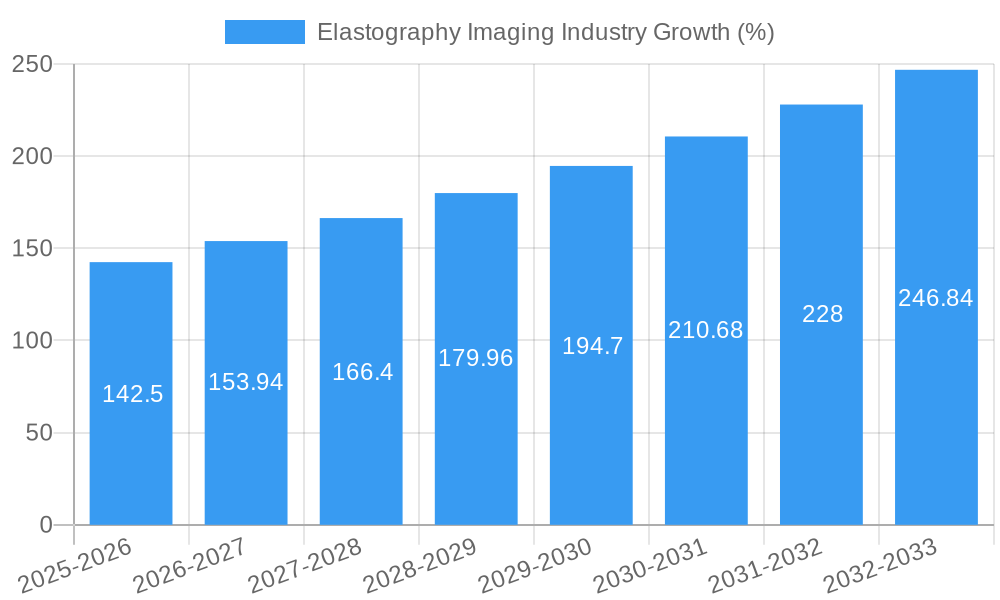
The Elastography Imaging market experienced significant growth during the historical period (2019-2024), driven by technological advancements, increased awareness of the benefits of elastography, and rising prevalence of diseases requiring non-invasive diagnostic tools. The market size is estimated at xx Million in 2025 and is projected to grow at a Compound Annual Growth Rate (CAGR) of xx% during the forecast period (2025-2033), reaching xx Million by 2033. This growth is fueled by the increasing adoption of elastography across various applications and the development of more sophisticated and user-friendly systems. The market penetration of elastography is still relatively low, presenting significant opportunities for future growth, especially in emerging markets. The adoption of AI and machine learning in image analysis and the development of point-of-care elastography devices are expected to further accelerate market expansion. Consumer behavior shifts towards minimally invasive procedures and personalized medicine are contributing positively to market growth.
Dominant Regions, Countries, or Segments in Elastography Imaging Industry
North America currently holds the largest market share in the Elastography Imaging industry, followed by Europe. This dominance stems from high healthcare expenditure, advanced healthcare infrastructure, and early adoption of new technologies. However, Asia-Pacific is projected to witness the fastest growth rate due to increasing healthcare awareness, rising disposable incomes, and expanding healthcare infrastructure. Within modalities, Ultrasound Elastography commands a larger share due to its cost-effectiveness and wider availability. Cardiology and Radiology are the leading application segments, driven by high prevalence of cardiovascular and liver diseases. Hospitals remain the largest end-users due to their comprehensive diagnostic capabilities.
- Key Drivers:
- North America: High healthcare spending, advanced infrastructure, early technology adoption.
- Europe: Established healthcare systems, rising prevalence of chronic diseases.
- Asia-Pacific: Rapid economic growth, increasing healthcare awareness, expanding healthcare infrastructure.
- Dominant Segments:
- Modality: Ultrasound Elastography
- Application: Cardiology, Radiology
- End-User: Hospitals
Elastography Imaging Industry Product Landscape
The Elastography Imaging product landscape is characterized by a range of systems offering varying levels of sophistication and functionality. Ultrasound Elastography systems dominate the market, offering real-time tissue stiffness assessment through techniques like SWE and ARFI. Magnetic Resonance Elastography (MRE) systems provide high-resolution images, but are more expensive and less widely available. Recent product innovations focus on improved image quality, enhanced user interfaces, and integration with other diagnostic tools. Key features include advanced image processing algorithms, quantitative stiffness measurements, and portability. Unique selling propositions often center on ease of use, speed of acquisition, and diagnostic accuracy.
Key Drivers, Barriers & Challenges in Elastography Imaging Industry
Key Drivers:
- Increasing prevalence of chronic diseases requiring non-invasive diagnosis.
- Technological advancements in elastography techniques and image processing.
- Growing demand for minimally invasive diagnostic procedures.
- Rising healthcare expenditure and investments in healthcare infrastructure.
Key Challenges and Restraints:
- High cost of equipment and maintenance, limiting access in resource-constrained settings.
- Lack of standardization and regulatory hurdles in certain regions hinder market penetration.
- Competition from established imaging modalities and the need for skilled personnel. The impact of these factors is estimated to reduce the overall market growth by approximately xx% during the forecast period.
Emerging Opportunities in Elastography Imaging Industry
- Expansion into untapped markets, particularly in developing economies.
- Development of point-of-care elastography devices for decentralized diagnostics.
- Integration of elastography with other imaging modalities for comprehensive diagnostics.
- Application expansion into new therapeutic areas such as oncology and neurology.
Growth Accelerators in the Elastography Imaging Industry
Long-term growth in the Elastography Imaging industry will be fueled by continuous technological advancements, strategic partnerships between device manufacturers and healthcare providers, and expansion into new geographical markets. The development of AI-powered image analysis tools will significantly improve diagnostic accuracy and efficiency. Strategic alliances will accelerate market penetration and improve access to cutting-edge technologies. Expanding into underserved markets presents substantial opportunities for growth.
Key Players Shaping the Elastography Imaging Market
- Esaote SpA
- Hologic Inc
- GE Healthcare
- Resoundant Inc
- Koninklijke Philips N V
- Mindray Medical International Limited
- Siemens AG
- Canon Medical Systems Corporation
- Samsung Medison
- Supersonic Imagine
- Fujifilm Holdings Corporation
Notable Milestones in Elastography Imaging Industry Sector
- March 2022: Fujifilm Healthcare Europe introduced the Arietta ultrasound series (Arietta 850 DeepInsight and Arietta 650 DeepInsight) featuring RTE and SWM for hepatic disease diagnosis.
- May 2022: Mindray launched Resona I9 with HiFR Sound Touch Elastography, improving 2D shear wave imaging.
- November 2022: PENTAX Medical launched a new EUS system combining the ARIETTA 65 PX ultrasound scanner and J10 Series Ultrasound Gastroscopes, enhancing real-time tissue elastography.
In-Depth Elastography Imaging Industry Market Outlook
The future of the Elastography Imaging market is bright, driven by several factors. Continued technological advancements, particularly in AI and machine learning, will lead to more accurate and efficient diagnostic tools. Strategic partnerships and collaborations between industry players will enhance market penetration and accelerate the adoption of elastography. Expansion into new therapeutic areas and emerging markets offers substantial growth potential. The market is poised for continued expansion, with significant opportunities for companies that can innovate and adapt to the evolving needs of the healthcare industry.
Elastography Imaging Industry Segmentation
-
1. Modality
- 1.1. Utrasound Elastography
- 1.2. Magnetic Resonance Elastography
-
2. Application
- 2.1. Cardiology
- 2.2. Radiology
- 2.3. Urology
- 2.4. Vascular
- 2.5. Obstetrics/Gynecology
- 2.6. Other Ap
-
3. End-User
- 3.1. Hospitals
- 3.2. Ambulatory Surgical Centers
- 3.3. Surgical & Diagnostic centers
Elastography Imaging Industry Segmentation By Geography
-
1. North America
- 1.1. United States
- 1.2. Canada
- 1.3. Mexico
-
2. Europe
- 2.1. Germany
- 2.2. United Kingdom
- 2.3. France
- 2.4. Italy
- 2.5. Spain
- 2.6. Rest of Europe
-
3. Asia Pacific
- 3.1. China
- 3.2. Japan
- 3.3. India
- 3.4. Australia
- 3.5. South Korea
- 3.6. Rest of Asia Pacific
-
4. Middle East and Africa
- 4.1. GCC
- 4.2. South Africa
- 4.3. Rest of Middle East and Africa
-
5. South America
- 5.1. Brazil
- 5.2. Argentina
- 5.3. Rest of South America
Elastography Imaging Industry REPORT HIGHLIGHTS
| Aspects | Details |
|---|---|
| Study Period | 2019-2033 |
| Base Year | 2024 |
| Estimated Year | 2025 |
| Forecast Period | 2025-2033 |
| Historical Period | 2019-2024 |
| Growth Rate | CAGR of 9.50% from 2019-2033 |
| Segmentation |
|
Table of Contents
- 1. Introduction
- 1.1. Research Scope
- 1.2. Market Segmentation
- 1.3. Research Methodology
- 1.4. Definitions and Assumptions
- 2. Executive Summary
- 2.1. Introduction
- 3. Market Dynamics
- 3.1. Introduction
- 3.2. Market Drivers
- 3.2.1. Rising Incidence of Chronic Ailments and Breast Cancer; Growing Demand for Minimally Invasive Surgeries
- 3.3. Market Restrains
- 3.3.1. Adverse Scenario of Reimbursement; High Price of Imaging Devices for Elastography
- 3.4. Market Trends
- 3.4.1. Ultrasound Modality Segment Expects to Register a High CAGR in the Forecast Period
- 4. Market Factor Analysis
- 4.1. Porters Five Forces
- 4.2. Supply/Value Chain
- 4.3. PESTEL analysis
- 4.4. Market Entropy
- 4.5. Patent/Trademark Analysis
- 5. Global Elastography Imaging Industry Analysis, Insights and Forecast, 2019-2031
- 5.1. Market Analysis, Insights and Forecast - by Modality
- 5.1.1. Utrasound Elastography
- 5.1.2. Magnetic Resonance Elastography
- 5.2. Market Analysis, Insights and Forecast - by Application
- 5.2.1. Cardiology
- 5.2.2. Radiology
- 5.2.3. Urology
- 5.2.4. Vascular
- 5.2.5. Obstetrics/Gynecology
- 5.2.6. Other Ap
- 5.3. Market Analysis, Insights and Forecast - by End-User
- 5.3.1. Hospitals
- 5.3.2. Ambulatory Surgical Centers
- 5.3.3. Surgical & Diagnostic centers
- 5.4. Market Analysis, Insights and Forecast - by Region
- 5.4.1. North America
- 5.4.2. Europe
- 5.4.3. Asia Pacific
- 5.4.4. Middle East and Africa
- 5.4.5. South America
- 5.1. Market Analysis, Insights and Forecast - by Modality
- 6. North America Elastography Imaging Industry Analysis, Insights and Forecast, 2019-2031
- 6.1. Market Analysis, Insights and Forecast - by Modality
- 6.1.1. Utrasound Elastography
- 6.1.2. Magnetic Resonance Elastography
- 6.2. Market Analysis, Insights and Forecast - by Application
- 6.2.1. Cardiology
- 6.2.2. Radiology
- 6.2.3. Urology
- 6.2.4. Vascular
- 6.2.5. Obstetrics/Gynecology
- 6.2.6. Other Ap
- 6.3. Market Analysis, Insights and Forecast - by End-User
- 6.3.1. Hospitals
- 6.3.2. Ambulatory Surgical Centers
- 6.3.3. Surgical & Diagnostic centers
- 6.1. Market Analysis, Insights and Forecast - by Modality
- 7. Europe Elastography Imaging Industry Analysis, Insights and Forecast, 2019-2031
- 7.1. Market Analysis, Insights and Forecast - by Modality
- 7.1.1. Utrasound Elastography
- 7.1.2. Magnetic Resonance Elastography
- 7.2. Market Analysis, Insights and Forecast - by Application
- 7.2.1. Cardiology
- 7.2.2. Radiology
- 7.2.3. Urology
- 7.2.4. Vascular
- 7.2.5. Obstetrics/Gynecology
- 7.2.6. Other Ap
- 7.3. Market Analysis, Insights and Forecast - by End-User
- 7.3.1. Hospitals
- 7.3.2. Ambulatory Surgical Centers
- 7.3.3. Surgical & Diagnostic centers
- 7.1. Market Analysis, Insights and Forecast - by Modality
- 8. Asia Pacific Elastography Imaging Industry Analysis, Insights and Forecast, 2019-2031
- 8.1. Market Analysis, Insights and Forecast - by Modality
- 8.1.1. Utrasound Elastography
- 8.1.2. Magnetic Resonance Elastography
- 8.2. Market Analysis, Insights and Forecast - by Application
- 8.2.1. Cardiology
- 8.2.2. Radiology
- 8.2.3. Urology
- 8.2.4. Vascular
- 8.2.5. Obstetrics/Gynecology
- 8.2.6. Other Ap
- 8.3. Market Analysis, Insights and Forecast - by End-User
- 8.3.1. Hospitals
- 8.3.2. Ambulatory Surgical Centers
- 8.3.3. Surgical & Diagnostic centers
- 8.1. Market Analysis, Insights and Forecast - by Modality
- 9. Middle East and Africa Elastography Imaging Industry Analysis, Insights and Forecast, 2019-2031
- 9.1. Market Analysis, Insights and Forecast - by Modality
- 9.1.1. Utrasound Elastography
- 9.1.2. Magnetic Resonance Elastography
- 9.2. Market Analysis, Insights and Forecast - by Application
- 9.2.1. Cardiology
- 9.2.2. Radiology
- 9.2.3. Urology
- 9.2.4. Vascular
- 9.2.5. Obstetrics/Gynecology
- 9.2.6. Other Ap
- 9.3. Market Analysis, Insights and Forecast - by End-User
- 9.3.1. Hospitals
- 9.3.2. Ambulatory Surgical Centers
- 9.3.3. Surgical & Diagnostic centers
- 9.1. Market Analysis, Insights and Forecast - by Modality
- 10. South America Elastography Imaging Industry Analysis, Insights and Forecast, 2019-2031
- 10.1. Market Analysis, Insights and Forecast - by Modality
- 10.1.1. Utrasound Elastography
- 10.1.2. Magnetic Resonance Elastography
- 10.2. Market Analysis, Insights and Forecast - by Application
- 10.2.1. Cardiology
- 10.2.2. Radiology
- 10.2.3. Urology
- 10.2.4. Vascular
- 10.2.5. Obstetrics/Gynecology
- 10.2.6. Other Ap
- 10.3. Market Analysis, Insights and Forecast - by End-User
- 10.3.1. Hospitals
- 10.3.2. Ambulatory Surgical Centers
- 10.3.3. Surgical & Diagnostic centers
- 10.1. Market Analysis, Insights and Forecast - by Modality
- 11. North America Elastography Imaging Industry Analysis, Insights and Forecast, 2019-2031
- 11.1. Market Analysis, Insights and Forecast - By Country/Sub-region
- 11.1.1 United States
- 11.1.2 Canada
- 11.1.3 Mexico
- 12. Europe Elastography Imaging Industry Analysis, Insights and Forecast, 2019-2031
- 12.1. Market Analysis, Insights and Forecast - By Country/Sub-region
- 12.1.1 Germany
- 12.1.2 United Kingdom
- 12.1.3 France
- 12.1.4 Italy
- 12.1.5 Spain
- 12.1.6 Rest of Europe
- 13. Asia Pacific Elastography Imaging Industry Analysis, Insights and Forecast, 2019-2031
- 13.1. Market Analysis, Insights and Forecast - By Country/Sub-region
- 13.1.1 China
- 13.1.2 Japan
- 13.1.3 India
- 13.1.4 Australia
- 13.1.5 South Korea
- 13.1.6 Rest of Asia Pacific
- 14. Middle East and Africa Elastography Imaging Industry Analysis, Insights and Forecast, 2019-2031
- 14.1. Market Analysis, Insights and Forecast - By Country/Sub-region
- 14.1.1 GCC
- 14.1.2 South Africa
- 14.1.3 Rest of Middle East and Africa
- 15. South America Elastography Imaging Industry Analysis, Insights and Forecast, 2019-2031
- 15.1. Market Analysis, Insights and Forecast - By Country/Sub-region
- 15.1.1 Brazil
- 15.1.2 Argentina
- 15.1.3 Rest of South America
- 16. Competitive Analysis
- 16.1. Global Market Share Analysis 2024
- 16.2. Company Profiles
- 16.2.1 Esaote SpA
- 16.2.1.1. Overview
- 16.2.1.2. Products
- 16.2.1.3. SWOT Analysis
- 16.2.1.4. Recent Developments
- 16.2.1.5. Financials (Based on Availability)
- 16.2.2 Hologic Inc
- 16.2.2.1. Overview
- 16.2.2.2. Products
- 16.2.2.3. SWOT Analysis
- 16.2.2.4. Recent Developments
- 16.2.2.5. Financials (Based on Availability)
- 16.2.3 GE Healthcare
- 16.2.3.1. Overview
- 16.2.3.2. Products
- 16.2.3.3. SWOT Analysis
- 16.2.3.4. Recent Developments
- 16.2.3.5. Financials (Based on Availability)
- 16.2.4 Resoundant Inc
- 16.2.4.1. Overview
- 16.2.4.2. Products
- 16.2.4.3. SWOT Analysis
- 16.2.4.4. Recent Developments
- 16.2.4.5. Financials (Based on Availability)
- 16.2.5 Koninklijke Philips N V
- 16.2.5.1. Overview
- 16.2.5.2. Products
- 16.2.5.3. SWOT Analysis
- 16.2.5.4. Recent Developments
- 16.2.5.5. Financials (Based on Availability)
- 16.2.6 Mindray Medical International Limited
- 16.2.6.1. Overview
- 16.2.6.2. Products
- 16.2.6.3. SWOT Analysis
- 16.2.6.4. Recent Developments
- 16.2.6.5. Financials (Based on Availability)
- 16.2.7 Siemens AG*List Not Exhaustive
- 16.2.7.1. Overview
- 16.2.7.2. Products
- 16.2.7.3. SWOT Analysis
- 16.2.7.4. Recent Developments
- 16.2.7.5. Financials (Based on Availability)
- 16.2.8 Canon Medical Systems Corporation
- 16.2.8.1. Overview
- 16.2.8.2. Products
- 16.2.8.3. SWOT Analysis
- 16.2.8.4. Recent Developments
- 16.2.8.5. Financials (Based on Availability)
- 16.2.9 Samsung Medison
- 16.2.9.1. Overview
- 16.2.9.2. Products
- 16.2.9.3. SWOT Analysis
- 16.2.9.4. Recent Developments
- 16.2.9.5. Financials (Based on Availability)
- 16.2.10 Supersonic Imagine
- 16.2.10.1. Overview
- 16.2.10.2. Products
- 16.2.10.3. SWOT Analysis
- 16.2.10.4. Recent Developments
- 16.2.10.5. Financials (Based on Availability)
- 16.2.11 Fujifilm Holdings Corporation
- 16.2.11.1. Overview
- 16.2.11.2. Products
- 16.2.11.3. SWOT Analysis
- 16.2.11.4. Recent Developments
- 16.2.11.5. Financials (Based on Availability)
- 16.2.1 Esaote SpA
List of Figures
- Figure 1: Global Elastography Imaging Industry Revenue Breakdown (Million, %) by Region 2024 & 2032
- Figure 2: North America Elastography Imaging Industry Revenue (Million), by Country 2024 & 2032
- Figure 3: North America Elastography Imaging Industry Revenue Share (%), by Country 2024 & 2032
- Figure 4: Europe Elastography Imaging Industry Revenue (Million), by Country 2024 & 2032
- Figure 5: Europe Elastography Imaging Industry Revenue Share (%), by Country 2024 & 2032
- Figure 6: Asia Pacific Elastography Imaging Industry Revenue (Million), by Country 2024 & 2032
- Figure 7: Asia Pacific Elastography Imaging Industry Revenue Share (%), by Country 2024 & 2032
- Figure 8: Middle East and Africa Elastography Imaging Industry Revenue (Million), by Country 2024 & 2032
- Figure 9: Middle East and Africa Elastography Imaging Industry Revenue Share (%), by Country 2024 & 2032
- Figure 10: South America Elastography Imaging Industry Revenue (Million), by Country 2024 & 2032
- Figure 11: South America Elastography Imaging Industry Revenue Share (%), by Country 2024 & 2032
- Figure 12: North America Elastography Imaging Industry Revenue (Million), by Modality 2024 & 2032
- Figure 13: North America Elastography Imaging Industry Revenue Share (%), by Modality 2024 & 2032
- Figure 14: North America Elastography Imaging Industry Revenue (Million), by Application 2024 & 2032
- Figure 15: North America Elastography Imaging Industry Revenue Share (%), by Application 2024 & 2032
- Figure 16: North America Elastography Imaging Industry Revenue (Million), by End-User 2024 & 2032
- Figure 17: North America Elastography Imaging Industry Revenue Share (%), by End-User 2024 & 2032
- Figure 18: North America Elastography Imaging Industry Revenue (Million), by Country 2024 & 2032
- Figure 19: North America Elastography Imaging Industry Revenue Share (%), by Country 2024 & 2032
- Figure 20: Europe Elastography Imaging Industry Revenue (Million), by Modality 2024 & 2032
- Figure 21: Europe Elastography Imaging Industry Revenue Share (%), by Modality 2024 & 2032
- Figure 22: Europe Elastography Imaging Industry Revenue (Million), by Application 2024 & 2032
- Figure 23: Europe Elastography Imaging Industry Revenue Share (%), by Application 2024 & 2032
- Figure 24: Europe Elastography Imaging Industry Revenue (Million), by End-User 2024 & 2032
- Figure 25: Europe Elastography Imaging Industry Revenue Share (%), by End-User 2024 & 2032
- Figure 26: Europe Elastography Imaging Industry Revenue (Million), by Country 2024 & 2032
- Figure 27: Europe Elastography Imaging Industry Revenue Share (%), by Country 2024 & 2032
- Figure 28: Asia Pacific Elastography Imaging Industry Revenue (Million), by Modality 2024 & 2032
- Figure 29: Asia Pacific Elastography Imaging Industry Revenue Share (%), by Modality 2024 & 2032
- Figure 30: Asia Pacific Elastography Imaging Industry Revenue (Million), by Application 2024 & 2032
- Figure 31: Asia Pacific Elastography Imaging Industry Revenue Share (%), by Application 2024 & 2032
- Figure 32: Asia Pacific Elastography Imaging Industry Revenue (Million), by End-User 2024 & 2032
- Figure 33: Asia Pacific Elastography Imaging Industry Revenue Share (%), by End-User 2024 & 2032
- Figure 34: Asia Pacific Elastography Imaging Industry Revenue (Million), by Country 2024 & 2032
- Figure 35: Asia Pacific Elastography Imaging Industry Revenue Share (%), by Country 2024 & 2032
- Figure 36: Middle East and Africa Elastography Imaging Industry Revenue (Million), by Modality 2024 & 2032
- Figure 37: Middle East and Africa Elastography Imaging Industry Revenue Share (%), by Modality 2024 & 2032
- Figure 38: Middle East and Africa Elastography Imaging Industry Revenue (Million), by Application 2024 & 2032
- Figure 39: Middle East and Africa Elastography Imaging Industry Revenue Share (%), by Application 2024 & 2032
- Figure 40: Middle East and Africa Elastography Imaging Industry Revenue (Million), by End-User 2024 & 2032
- Figure 41: Middle East and Africa Elastography Imaging Industry Revenue Share (%), by End-User 2024 & 2032
- Figure 42: Middle East and Africa Elastography Imaging Industry Revenue (Million), by Country 2024 & 2032
- Figure 43: Middle East and Africa Elastography Imaging Industry Revenue Share (%), by Country 2024 & 2032
- Figure 44: South America Elastography Imaging Industry Revenue (Million), by Modality 2024 & 2032
- Figure 45: South America Elastography Imaging Industry Revenue Share (%), by Modality 2024 & 2032
- Figure 46: South America Elastography Imaging Industry Revenue (Million), by Application 2024 & 2032
- Figure 47: South America Elastography Imaging Industry Revenue Share (%), by Application 2024 & 2032
- Figure 48: South America Elastography Imaging Industry Revenue (Million), by End-User 2024 & 2032
- Figure 49: South America Elastography Imaging Industry Revenue Share (%), by End-User 2024 & 2032
- Figure 50: South America Elastography Imaging Industry Revenue (Million), by Country 2024 & 2032
- Figure 51: South America Elastography Imaging Industry Revenue Share (%), by Country 2024 & 2032
List of Tables
- Table 1: Global Elastography Imaging Industry Revenue Million Forecast, by Region 2019 & 2032
- Table 2: Global Elastography Imaging Industry Revenue Million Forecast, by Modality 2019 & 2032
- Table 3: Global Elastography Imaging Industry Revenue Million Forecast, by Application 2019 & 2032
- Table 4: Global Elastography Imaging Industry Revenue Million Forecast, by End-User 2019 & 2032
- Table 5: Global Elastography Imaging Industry Revenue Million Forecast, by Region 2019 & 2032
- Table 6: Global Elastography Imaging Industry Revenue Million Forecast, by Country 2019 & 2032
- Table 7: United States Elastography Imaging Industry Revenue (Million) Forecast, by Application 2019 & 2032
- Table 8: Canada Elastography Imaging Industry Revenue (Million) Forecast, by Application 2019 & 2032
- Table 9: Mexico Elastography Imaging Industry Revenue (Million) Forecast, by Application 2019 & 2032
- Table 10: Global Elastography Imaging Industry Revenue Million Forecast, by Country 2019 & 2032
- Table 11: Germany Elastography Imaging Industry Revenue (Million) Forecast, by Application 2019 & 2032
- Table 12: United Kingdom Elastography Imaging Industry Revenue (Million) Forecast, by Application 2019 & 2032
- Table 13: France Elastography Imaging Industry Revenue (Million) Forecast, by Application 2019 & 2032
- Table 14: Italy Elastography Imaging Industry Revenue (Million) Forecast, by Application 2019 & 2032
- Table 15: Spain Elastography Imaging Industry Revenue (Million) Forecast, by Application 2019 & 2032
- Table 16: Rest of Europe Elastography Imaging Industry Revenue (Million) Forecast, by Application 2019 & 2032
- Table 17: Global Elastography Imaging Industry Revenue Million Forecast, by Country 2019 & 2032
- Table 18: China Elastography Imaging Industry Revenue (Million) Forecast, by Application 2019 & 2032
- Table 19: Japan Elastography Imaging Industry Revenue (Million) Forecast, by Application 2019 & 2032
- Table 20: India Elastography Imaging Industry Revenue (Million) Forecast, by Application 2019 & 2032
- Table 21: Australia Elastography Imaging Industry Revenue (Million) Forecast, by Application 2019 & 2032
- Table 22: South Korea Elastography Imaging Industry Revenue (Million) Forecast, by Application 2019 & 2032
- Table 23: Rest of Asia Pacific Elastography Imaging Industry Revenue (Million) Forecast, by Application 2019 & 2032
- Table 24: Global Elastography Imaging Industry Revenue Million Forecast, by Country 2019 & 2032
- Table 25: GCC Elastography Imaging Industry Revenue (Million) Forecast, by Application 2019 & 2032
- Table 26: South Africa Elastography Imaging Industry Revenue (Million) Forecast, by Application 2019 & 2032
- Table 27: Rest of Middle East and Africa Elastography Imaging Industry Revenue (Million) Forecast, by Application 2019 & 2032
- Table 28: Global Elastography Imaging Industry Revenue Million Forecast, by Country 2019 & 2032
- Table 29: Brazil Elastography Imaging Industry Revenue (Million) Forecast, by Application 2019 & 2032
- Table 30: Argentina Elastography Imaging Industry Revenue (Million) Forecast, by Application 2019 & 2032
- Table 31: Rest of South America Elastography Imaging Industry Revenue (Million) Forecast, by Application 2019 & 2032
- Table 32: Global Elastography Imaging Industry Revenue Million Forecast, by Modality 2019 & 2032
- Table 33: Global Elastography Imaging Industry Revenue Million Forecast, by Application 2019 & 2032
- Table 34: Global Elastography Imaging Industry Revenue Million Forecast, by End-User 2019 & 2032
- Table 35: Global Elastography Imaging Industry Revenue Million Forecast, by Country 2019 & 2032
- Table 36: United States Elastography Imaging Industry Revenue (Million) Forecast, by Application 2019 & 2032
- Table 37: Canada Elastography Imaging Industry Revenue (Million) Forecast, by Application 2019 & 2032
- Table 38: Mexico Elastography Imaging Industry Revenue (Million) Forecast, by Application 2019 & 2032
- Table 39: Global Elastography Imaging Industry Revenue Million Forecast, by Modality 2019 & 2032
- Table 40: Global Elastography Imaging Industry Revenue Million Forecast, by Application 2019 & 2032
- Table 41: Global Elastography Imaging Industry Revenue Million Forecast, by End-User 2019 & 2032
- Table 42: Global Elastography Imaging Industry Revenue Million Forecast, by Country 2019 & 2032
- Table 43: Germany Elastography Imaging Industry Revenue (Million) Forecast, by Application 2019 & 2032
- Table 44: United Kingdom Elastography Imaging Industry Revenue (Million) Forecast, by Application 2019 & 2032
- Table 45: France Elastography Imaging Industry Revenue (Million) Forecast, by Application 2019 & 2032
- Table 46: Italy Elastography Imaging Industry Revenue (Million) Forecast, by Application 2019 & 2032
- Table 47: Spain Elastography Imaging Industry Revenue (Million) Forecast, by Application 2019 & 2032
- Table 48: Rest of Europe Elastography Imaging Industry Revenue (Million) Forecast, by Application 2019 & 2032
- Table 49: Global Elastography Imaging Industry Revenue Million Forecast, by Modality 2019 & 2032
- Table 50: Global Elastography Imaging Industry Revenue Million Forecast, by Application 2019 & 2032
- Table 51: Global Elastography Imaging Industry Revenue Million Forecast, by End-User 2019 & 2032
- Table 52: Global Elastography Imaging Industry Revenue Million Forecast, by Country 2019 & 2032
- Table 53: China Elastography Imaging Industry Revenue (Million) Forecast, by Application 2019 & 2032
- Table 54: Japan Elastography Imaging Industry Revenue (Million) Forecast, by Application 2019 & 2032
- Table 55: India Elastography Imaging Industry Revenue (Million) Forecast, by Application 2019 & 2032
- Table 56: Australia Elastography Imaging Industry Revenue (Million) Forecast, by Application 2019 & 2032
- Table 57: South Korea Elastography Imaging Industry Revenue (Million) Forecast, by Application 2019 & 2032
- Table 58: Rest of Asia Pacific Elastography Imaging Industry Revenue (Million) Forecast, by Application 2019 & 2032
- Table 59: Global Elastography Imaging Industry Revenue Million Forecast, by Modality 2019 & 2032
- Table 60: Global Elastography Imaging Industry Revenue Million Forecast, by Application 2019 & 2032
- Table 61: Global Elastography Imaging Industry Revenue Million Forecast, by End-User 2019 & 2032
- Table 62: Global Elastography Imaging Industry Revenue Million Forecast, by Country 2019 & 2032
- Table 63: GCC Elastography Imaging Industry Revenue (Million) Forecast, by Application 2019 & 2032
- Table 64: South Africa Elastography Imaging Industry Revenue (Million) Forecast, by Application 2019 & 2032
- Table 65: Rest of Middle East and Africa Elastography Imaging Industry Revenue (Million) Forecast, by Application 2019 & 2032
- Table 66: Global Elastography Imaging Industry Revenue Million Forecast, by Modality 2019 & 2032
- Table 67: Global Elastography Imaging Industry Revenue Million Forecast, by Application 2019 & 2032
- Table 68: Global Elastography Imaging Industry Revenue Million Forecast, by End-User 2019 & 2032
- Table 69: Global Elastography Imaging Industry Revenue Million Forecast, by Country 2019 & 2032
- Table 70: Brazil Elastography Imaging Industry Revenue (Million) Forecast, by Application 2019 & 2032
- Table 71: Argentina Elastography Imaging Industry Revenue (Million) Forecast, by Application 2019 & 2032
- Table 72: Rest of South America Elastography Imaging Industry Revenue (Million) Forecast, by Application 2019 & 2032
Frequently Asked Questions
1. What is the projected Compound Annual Growth Rate (CAGR) of the Elastography Imaging Industry?
The projected CAGR is approximately 9.50%.
2. Which companies are prominent players in the Elastography Imaging Industry?
Key companies in the market include Esaote SpA, Hologic Inc, GE Healthcare, Resoundant Inc, Koninklijke Philips N V, Mindray Medical International Limited, Siemens AG*List Not Exhaustive, Canon Medical Systems Corporation, Samsung Medison, Supersonic Imagine, Fujifilm Holdings Corporation.
3. What are the main segments of the Elastography Imaging Industry?
The market segments include Modality, Application, End-User.
4. Can you provide details about the market size?
The market size is estimated to be USD XX Million as of 2022.
5. What are some drivers contributing to market growth?
Rising Incidence of Chronic Ailments and Breast Cancer; Growing Demand for Minimally Invasive Surgeries.
6. What are the notable trends driving market growth?
Ultrasound Modality Segment Expects to Register a High CAGR in the Forecast Period.
7. Are there any restraints impacting market growth?
Adverse Scenario of Reimbursement; High Price of Imaging Devices for Elastography.
8. Can you provide examples of recent developments in the market?
November 2022: PENTAX Medical launched its new Performance Endoscopic Ultrasound (EUS) system in Canada. The system consists of a combination of its new ARIETTA 65 PX ultrasound scanner and its best-in-class J10 Series Ultrasound Gastroscopes. The J10 Series Ultrasound Gastroscope and ARIETTA 65 PX offer high image quality, real-time tissue elastography, and better therapeutic access.
9. What pricing options are available for accessing the report?
Pricing options include single-user, multi-user, and enterprise licenses priced at USD 4750, USD 5250, and USD 8750 respectively.
10. Is the market size provided in terms of value or volume?
The market size is provided in terms of value, measured in Million.
11. Are there any specific market keywords associated with the report?
Yes, the market keyword associated with the report is "Elastography Imaging Industry," which aids in identifying and referencing the specific market segment covered.
12. How do I determine which pricing option suits my needs best?
The pricing options vary based on user requirements and access needs. Individual users may opt for single-user licenses, while businesses requiring broader access may choose multi-user or enterprise licenses for cost-effective access to the report.
13. Are there any additional resources or data provided in the Elastography Imaging Industry report?
While the report offers comprehensive insights, it's advisable to review the specific contents or supplementary materials provided to ascertain if additional resources or data are available.
14. How can I stay updated on further developments or reports in the Elastography Imaging Industry?
To stay informed about further developments, trends, and reports in the Elastography Imaging Industry, consider subscribing to industry newsletters, following relevant companies and organizations, or regularly checking reputable industry news sources and publications.
Methodology
Step 1 - Identification of Relevant Samples Size from Population Database


Step 2 - Approaches for Defining Global Market Size (Value, Volume* & Price*)

Note*: In applicable scenarios
Step 3 - Data Sources
Primary Research
- Web Analytics
- Survey Reports
- Research Institute
- Latest Research Reports
- Opinion Leaders
Secondary Research
- Annual Reports
- White Paper
- Latest Press Release
- Industry Association
- Paid Database
- Investor Presentations

Step 4 - Data Triangulation
Involves using different sources of information in order to increase the validity of a study
These sources are likely to be stakeholders in a program - participants, other researchers, program staff, other community members, and so on.
Then we put all data in single framework & apply various statistical tools to find out the dynamic on the market.
During the analysis stage, feedback from the stakeholder groups would be compared to determine areas of agreement as well as areas of divergence


