
Key Insights
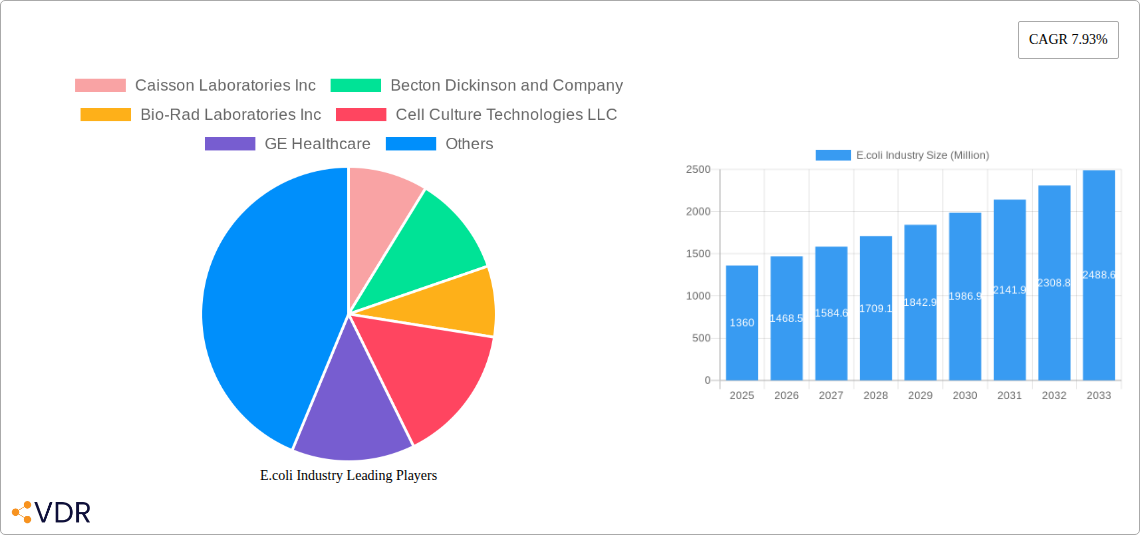
The E. coli testing market, valued at $1.36 billion in 2025, is projected to experience robust growth, driven by increasing incidences of foodborne illnesses and stringent regulatory requirements for food safety and environmental monitoring. The market's 7.93% CAGR from 2019 to 2024 indicates a consistently expanding demand for accurate and rapid E. coli detection methods. Key drivers include the rising prevalence of E. coli infections globally, necessitating enhanced surveillance and diagnostic capabilities. Furthermore, the increasing adoption of advanced testing technologies, such as enzyme immunoassays and clinical testing methods, alongside sophisticated molecular diagnostics, is significantly contributing to market expansion. The growing awareness among consumers about food safety and hygiene practices also fuels market growth, prompting greater investment in preventative measures by food processing industries. The market is segmented by testing types (clinical and environmental) reflecting the diverse applications of E. coli testing across healthcare and environmental monitoring. Major players like Becton Dickinson, Bio-Rad, and Merck & Co., are actively investing in R&D to improve the sensitivity, speed, and affordability of E. coli detection. Geographic expansion, especially in developing economies with burgeoning food industries and improving healthcare infrastructure, presents significant opportunities for market growth. However, challenges include high testing costs in some regions and the need for continuous technological advancements to overcome limitations of existing detection methods.
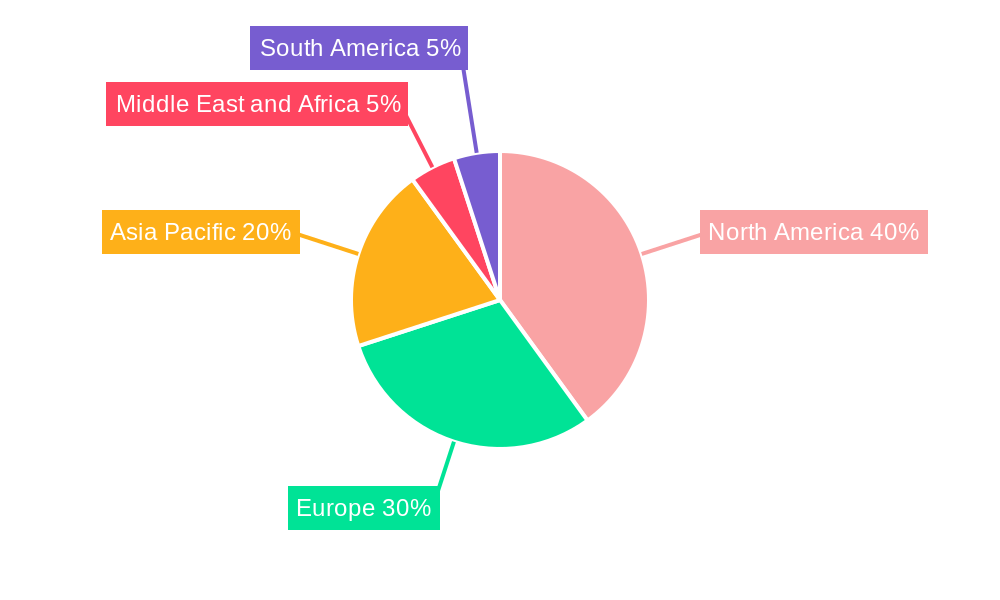
The significant growth trajectory is expected to continue throughout the forecast period (2025-2033), with North America and Europe maintaining substantial market shares due to advanced healthcare infrastructure and stringent regulatory frameworks. However, the Asia-Pacific region is anticipated to witness the fastest growth, fueled by rapid economic development, rising disposable incomes, and increasing awareness of food safety concerns. Competition amongst established players and emerging innovative companies will likely intensify, driving further technological advancements and fostering market consolidation. Future growth will depend on factors such as technological innovation, regulatory changes, government investments in public health, and increasing consumer demand for safe food and water supplies.
E.coli Industry Market Report: 2019-2033
This comprehensive report provides a detailed analysis of the E.coli industry, encompassing market dynamics, growth trends, competitive landscape, and future outlook. The study period covers 2019-2033, with a base year of 2025 and a forecast period of 2025-2033. The report utilizes data from the historical period (2019-2024) and incorporates expert insights to project future market performance. This report is ideal for industry professionals, investors, and researchers seeking a thorough understanding of this vital sector. The parent market is the broader in-vitro diagnostics market, with E. coli testing being a key child market.
E.coli Industry Market Dynamics & Structure
The E.coli industry is characterized by a moderately concentrated market structure, with several key players holding significant market share. Market concentration is estimated at xx% in 2025. Technological innovation, particularly in rapid diagnostic testing and advanced detection methods, is a primary growth driver. Stringent regulatory frameworks, particularly concerning food safety and water quality standards, significantly influence market dynamics. Competitive pressure arises from the availability of substitute methods for E.coli detection, though these often lack the speed and sensitivity of current leading technologies. The end-user demographics include clinical laboratories, environmental agencies, food processing facilities, and research institutions. M&A activity within the past five years has seen xx deals, primarily focused on expanding testing capabilities and geographical reach.
- Market Concentration: xx% in 2025 (estimated)
- Key Innovation Drivers: Rapid diagnostic tests, advanced detection technologies, automation
- Regulatory Landscape: Stringent food safety and water quality regulations
- Competitive Substitutes: Traditional culture methods, less sensitive detection techniques
- End-User Demographics: Clinical labs, environmental agencies, food processing plants, research institutions
- M&A Activity (2020-2024): xx deals (estimated)
E.coli Industry Growth Trends & Insights
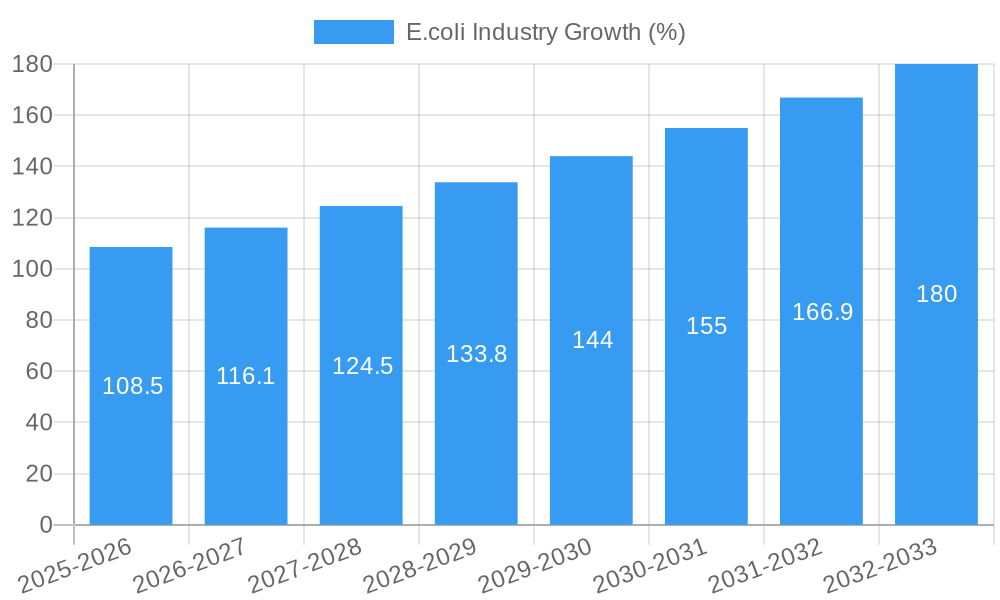
The global E.coli industry is experiencing robust growth, driven by increasing incidences of E.coli infections, rising awareness of food safety, and stringent regulatory mandates. The market size in 2025 is estimated at $xx million and is projected to reach $xx million by 2033, exhibiting a CAGR of xx%. This growth is further fueled by technological advancements leading to more rapid and accurate testing methods. Market penetration of advanced diagnostic tools is currently at xx% and is expected to increase significantly during the forecast period, largely due to the increased adoption in developing countries. Consumer behavior is shifting towards greater demand for faster turnaround times and improved accuracy in testing.
Dominant Regions, Countries, or Segments in E.coli Industry
North America currently dominates the E.coli industry, accounting for approximately xx% of the global market share in 2025. This dominance stems from factors such as robust healthcare infrastructure, stringent regulatory frameworks, and high adoption rates of advanced testing technologies. However, significant growth potential exists in emerging economies of Asia-Pacific due to rising healthcare expenditure, increasing awareness regarding foodborne illnesses, and the growing demand for accurate and efficient testing solutions. The clinical testing segment currently holds the largest market share (xx%), driven by the high prevalence of E.coli infections and the need for rapid diagnosis. The environmental testing segment is expected to experience faster growth (xx% CAGR) due to increasing focus on water quality monitoring and food safety regulations.
- North America: Dominant region due to advanced infrastructure and high adoption rates.
- Asia-Pacific: High growth potential due to increasing healthcare expenditure and awareness.
- Clinical Testing: Largest segment driven by high prevalence of infections.
- Environmental Testing: Fastest-growing segment due to stringent regulations.
E.coli Industry Product Landscape
The E.coli industry offers a diverse range of products, including enzyme immunoassays (EIAs), polymerase chain reaction (PCR)-based tests, and culture-based methods. Recent product innovations focus on improving speed, accuracy, and portability of testing kits. These advanced technologies offer unique selling propositions such as faster turnaround times, increased sensitivity, and reduced cost per test. The market is witnessing ongoing technological advancements, such as the integration of artificial intelligence and machine learning for improved data analysis and disease surveillance.
Key Drivers, Barriers & Challenges in E.coli Industry
Key Drivers:
- Rising prevalence of E.coli infections.
- Increasing demand for rapid and accurate diagnostics.
- Stringent food safety and water quality regulations.
- Technological advancements in testing methods.
Challenges & Restraints:
- High cost of advanced testing technologies, limiting accessibility in certain regions.
- Complex regulatory approval processes can hinder product launches.
- Competition from existing and emerging diagnostic technologies. The market is estimated to face xx% decline in profit due to intensified competition by 2030.
Emerging Opportunities in E.coli Industry
- Development of point-of-care diagnostic tools for rapid testing in remote areas.
- Expansion into untapped markets in developing countries.
- Integration of big data analytics and AI for disease surveillance and outbreak prediction.
- Development of novel detection methods with enhanced sensitivity and specificity.
Growth Accelerators in the E.coli Industry Industry
Long-term growth will be driven by technological innovation, strategic partnerships between diagnostic companies and healthcare providers, and expansion into emerging markets. The development and adoption of advanced point-of-care diagnostics, combined with improved data sharing and surveillance programs, will significantly contribute to market expansion.
Key Players Shaping the E.coli Industry Market
- Caisson Laboratories Inc
- Becton Dickinson and Company
- Bio-Rad Laboratories Inc
- Cell Culture Technologies LLC
- GE Healthcare
- Lonza Group Ltd
- HiMedia Laboratories Pvt Ltd
- Merck & Co Inc
- Corning Incorporated
- Fujifilm Holdings Corporation
- List Not Exhaustive
Notable Milestones in E.coli Industry Sector
- June 2022: Researchers from IIT Kanpur developed a highly sensitive E.coli water testing kit.
- June 2022: Michigan State University research highlighted the role of random mutations in E.coli evolution.
In-Depth E.coli Industry Market Outlook
The E.coli industry is poised for significant growth over the next decade, driven by the continued demand for rapid, accurate, and cost-effective testing solutions. Strategic partnerships, technological advancements, and market expansion into underserved regions will be key factors in shaping future market dynamics. The potential for point-of-care diagnostics and AI-driven disease surveillance presents considerable opportunities for industry players.
E.coli Industry Segmentation
-
1. Test
-
1.1. Clinical Testing
- 1.1.1. Polymerase Chain Reaction
- 1.1.2. Enzyme Immunoassays
-
1.2. Environmental Testing
- 1.2.1. Membrane Filtration
- 1.2.2. Multiple Tube Fermentation
- 1.2.3. Enzyme Substrate Method
-
1.1. Clinical Testing
E.coli Industry Segmentation By Geography
-
1. North America
- 1.1. United States
- 1.2. Canada
- 1.3. Mexico
-
2. Europe
- 2.1. Germany
- 2.2. United Kingdom
- 2.3. France
- 2.4. Italy
- 2.5. Spain
- 2.6. Rest of Europe
-
3. Asia Pacific
- 3.1. China
- 3.2. Japan
- 3.3. India
- 3.4. Australia
- 3.5. South Korea
- 3.6. Rest of Asia Pacific
-
4. Middle East and Africa
- 4.1. GCC
- 4.2. South Africa
- 4.3. Rest of Middle East and Africa
-
5. South America
- 5.1. Brazil
- 5.2. Argentina
- 5.3. Rest of South America
E.coli Industry REPORT HIGHLIGHTS
| Aspects | Details |
|---|---|
| Study Period | 2019-2033 |
| Base Year | 2024 |
| Estimated Year | 2025 |
| Forecast Period | 2025-2033 |
| Historical Period | 2019-2024 |
| Growth Rate | CAGR of 7.93% from 2019-2033 |
| Segmentation |
|
Table of Contents
- 1. Introduction
- 1.1. Research Scope
- 1.2. Market Segmentation
- 1.3. Research Methodology
- 1.4. Definitions and Assumptions
- 2. Executive Summary
- 2.1. Introduction
- 3. Market Dynamics
- 3.1. Introduction
- 3.2. Market Drivers
- 3.2.1. Increasing Prevalence of Diarrhoea; New Technological Advancements
- 3.3. Market Restrains
- 3.3.1. High Cost of E. coli Treatment
- 3.4. Market Trends
- 3.4.1. Polymerase Chain Reaction Segment is Expected to be Major Segment in the Escherichia coli Testing Market
- 4. Market Factor Analysis
- 4.1. Porters Five Forces
- 4.2. Supply/Value Chain
- 4.3. PESTEL analysis
- 4.4. Market Entropy
- 4.5. Patent/Trademark Analysis
- 5. Global E.coli Industry Analysis, Insights and Forecast, 2019-2031
- 5.1. Market Analysis, Insights and Forecast - by Test
- 5.1.1. Clinical Testing
- 5.1.1.1. Polymerase Chain Reaction
- 5.1.1.2. Enzyme Immunoassays
- 5.1.2. Environmental Testing
- 5.1.2.1. Membrane Filtration
- 5.1.2.2. Multiple Tube Fermentation
- 5.1.2.3. Enzyme Substrate Method
- 5.1.1. Clinical Testing
- 5.2. Market Analysis, Insights and Forecast - by Region
- 5.2.1. North America
- 5.2.2. Europe
- 5.2.3. Asia Pacific
- 5.2.4. Middle East and Africa
- 5.2.5. South America
- 5.1. Market Analysis, Insights and Forecast - by Test
- 6. North America E.coli Industry Analysis, Insights and Forecast, 2019-2031
- 6.1. Market Analysis, Insights and Forecast - by Test
- 6.1.1. Clinical Testing
- 6.1.1.1. Polymerase Chain Reaction
- 6.1.1.2. Enzyme Immunoassays
- 6.1.2. Environmental Testing
- 6.1.2.1. Membrane Filtration
- 6.1.2.2. Multiple Tube Fermentation
- 6.1.2.3. Enzyme Substrate Method
- 6.1.1. Clinical Testing
- 6.1. Market Analysis, Insights and Forecast - by Test
- 7. Europe E.coli Industry Analysis, Insights and Forecast, 2019-2031
- 7.1. Market Analysis, Insights and Forecast - by Test
- 7.1.1. Clinical Testing
- 7.1.1.1. Polymerase Chain Reaction
- 7.1.1.2. Enzyme Immunoassays
- 7.1.2. Environmental Testing
- 7.1.2.1. Membrane Filtration
- 7.1.2.2. Multiple Tube Fermentation
- 7.1.2.3. Enzyme Substrate Method
- 7.1.1. Clinical Testing
- 7.1. Market Analysis, Insights and Forecast - by Test
- 8. Asia Pacific E.coli Industry Analysis, Insights and Forecast, 2019-2031
- 8.1. Market Analysis, Insights and Forecast - by Test
- 8.1.1. Clinical Testing
- 8.1.1.1. Polymerase Chain Reaction
- 8.1.1.2. Enzyme Immunoassays
- 8.1.2. Environmental Testing
- 8.1.2.1. Membrane Filtration
- 8.1.2.2. Multiple Tube Fermentation
- 8.1.2.3. Enzyme Substrate Method
- 8.1.1. Clinical Testing
- 8.1. Market Analysis, Insights and Forecast - by Test
- 9. Middle East and Africa E.coli Industry Analysis, Insights and Forecast, 2019-2031
- 9.1. Market Analysis, Insights and Forecast - by Test
- 9.1.1. Clinical Testing
- 9.1.1.1. Polymerase Chain Reaction
- 9.1.1.2. Enzyme Immunoassays
- 9.1.2. Environmental Testing
- 9.1.2.1. Membrane Filtration
- 9.1.2.2. Multiple Tube Fermentation
- 9.1.2.3. Enzyme Substrate Method
- 9.1.1. Clinical Testing
- 9.1. Market Analysis, Insights and Forecast - by Test
- 10. South America E.coli Industry Analysis, Insights and Forecast, 2019-2031
- 10.1. Market Analysis, Insights and Forecast - by Test
- 10.1.1. Clinical Testing
- 10.1.1.1. Polymerase Chain Reaction
- 10.1.1.2. Enzyme Immunoassays
- 10.1.2. Environmental Testing
- 10.1.2.1. Membrane Filtration
- 10.1.2.2. Multiple Tube Fermentation
- 10.1.2.3. Enzyme Substrate Method
- 10.1.1. Clinical Testing
- 10.1. Market Analysis, Insights and Forecast - by Test
- 11. North America E.coli Industry Analysis, Insights and Forecast, 2019-2031
- 11.1. Market Analysis, Insights and Forecast - By Country/Sub-region
- 11.1.1 United States
- 11.1.2 Canada
- 11.1.3 Mexico
- 12. Europe E.coli Industry Analysis, Insights and Forecast, 2019-2031
- 12.1. Market Analysis, Insights and Forecast - By Country/Sub-region
- 12.1.1 Germany
- 12.1.2 United Kingdom
- 12.1.3 France
- 12.1.4 Italy
- 12.1.5 Spain
- 12.1.6 Rest of Europe
- 13. Asia Pacific E.coli Industry Analysis, Insights and Forecast, 2019-2031
- 13.1. Market Analysis, Insights and Forecast - By Country/Sub-region
- 13.1.1 China
- 13.1.2 Japan
- 13.1.3 India
- 13.1.4 Australia
- 13.1.5 South Korea
- 13.1.6 Rest of Asia Pacific
- 14. Middle East and Africa E.coli Industry Analysis, Insights and Forecast, 2019-2031
- 14.1. Market Analysis, Insights and Forecast - By Country/Sub-region
- 14.1.1 GCC
- 14.1.2 South Africa
- 14.1.3 Rest of Middle East and Africa
- 15. South America E.coli Industry Analysis, Insights and Forecast, 2019-2031
- 15.1. Market Analysis, Insights and Forecast - By Country/Sub-region
- 15.1.1 Brazil
- 15.1.2 Argentina
- 15.1.3 Rest of South America
- 16. Competitive Analysis
- 16.1. Global Market Share Analysis 2024
- 16.2. Company Profiles
- 16.2.1 Caisson Laboratories Inc
- 16.2.1.1. Overview
- 16.2.1.2. Products
- 16.2.1.3. SWOT Analysis
- 16.2.1.4. Recent Developments
- 16.2.1.5. Financials (Based on Availability)
- 16.2.2 Becton Dickinson and Company
- 16.2.2.1. Overview
- 16.2.2.2. Products
- 16.2.2.3. SWOT Analysis
- 16.2.2.4. Recent Developments
- 16.2.2.5. Financials (Based on Availability)
- 16.2.3 Bio-Rad Laboratories Inc
- 16.2.3.1. Overview
- 16.2.3.2. Products
- 16.2.3.3. SWOT Analysis
- 16.2.3.4. Recent Developments
- 16.2.3.5. Financials (Based on Availability)
- 16.2.4 Cell Culture Technologies LLC
- 16.2.4.1. Overview
- 16.2.4.2. Products
- 16.2.4.3. SWOT Analysis
- 16.2.4.4. Recent Developments
- 16.2.4.5. Financials (Based on Availability)
- 16.2.5 GE Healthcare
- 16.2.5.1. Overview
- 16.2.5.2. Products
- 16.2.5.3. SWOT Analysis
- 16.2.5.4. Recent Developments
- 16.2.5.5. Financials (Based on Availability)
- 16.2.6 Lonza Group Ltd
- 16.2.6.1. Overview
- 16.2.6.2. Products
- 16.2.6.3. SWOT Analysis
- 16.2.6.4. Recent Developments
- 16.2.6.5. Financials (Based on Availability)
- 16.2.7 HiMedia Laboratories Pvt Ltd
- 16.2.7.1. Overview
- 16.2.7.2. Products
- 16.2.7.3. SWOT Analysis
- 16.2.7.4. Recent Developments
- 16.2.7.5. Financials (Based on Availability)
- 16.2.8 Merck & Co Inc*List Not Exhaustive
- 16.2.8.1. Overview
- 16.2.8.2. Products
- 16.2.8.3. SWOT Analysis
- 16.2.8.4. Recent Developments
- 16.2.8.5. Financials (Based on Availability)
- 16.2.9 Corning Incorporated
- 16.2.9.1. Overview
- 16.2.9.2. Products
- 16.2.9.3. SWOT Analysis
- 16.2.9.4. Recent Developments
- 16.2.9.5. Financials (Based on Availability)
- 16.2.10 Fujifilm Holdings Corporation
- 16.2.10.1. Overview
- 16.2.10.2. Products
- 16.2.10.3. SWOT Analysis
- 16.2.10.4. Recent Developments
- 16.2.10.5. Financials (Based on Availability)
- 16.2.1 Caisson Laboratories Inc
List of Figures
- Figure 1: Global E.coli Industry Revenue Breakdown (Million, %) by Region 2024 & 2032
- Figure 2: North America E.coli Industry Revenue (Million), by Country 2024 & 2032
- Figure 3: North America E.coli Industry Revenue Share (%), by Country 2024 & 2032
- Figure 4: Europe E.coli Industry Revenue (Million), by Country 2024 & 2032
- Figure 5: Europe E.coli Industry Revenue Share (%), by Country 2024 & 2032
- Figure 6: Asia Pacific E.coli Industry Revenue (Million), by Country 2024 & 2032
- Figure 7: Asia Pacific E.coli Industry Revenue Share (%), by Country 2024 & 2032
- Figure 8: Middle East and Africa E.coli Industry Revenue (Million), by Country 2024 & 2032
- Figure 9: Middle East and Africa E.coli Industry Revenue Share (%), by Country 2024 & 2032
- Figure 10: South America E.coli Industry Revenue (Million), by Country 2024 & 2032
- Figure 11: South America E.coli Industry Revenue Share (%), by Country 2024 & 2032
- Figure 12: North America E.coli Industry Revenue (Million), by Test 2024 & 2032
- Figure 13: North America E.coli Industry Revenue Share (%), by Test 2024 & 2032
- Figure 14: North America E.coli Industry Revenue (Million), by Country 2024 & 2032
- Figure 15: North America E.coli Industry Revenue Share (%), by Country 2024 & 2032
- Figure 16: Europe E.coli Industry Revenue (Million), by Test 2024 & 2032
- Figure 17: Europe E.coli Industry Revenue Share (%), by Test 2024 & 2032
- Figure 18: Europe E.coli Industry Revenue (Million), by Country 2024 & 2032
- Figure 19: Europe E.coli Industry Revenue Share (%), by Country 2024 & 2032
- Figure 20: Asia Pacific E.coli Industry Revenue (Million), by Test 2024 & 2032
- Figure 21: Asia Pacific E.coli Industry Revenue Share (%), by Test 2024 & 2032
- Figure 22: Asia Pacific E.coli Industry Revenue (Million), by Country 2024 & 2032
- Figure 23: Asia Pacific E.coli Industry Revenue Share (%), by Country 2024 & 2032
- Figure 24: Middle East and Africa E.coli Industry Revenue (Million), by Test 2024 & 2032
- Figure 25: Middle East and Africa E.coli Industry Revenue Share (%), by Test 2024 & 2032
- Figure 26: Middle East and Africa E.coli Industry Revenue (Million), by Country 2024 & 2032
- Figure 27: Middle East and Africa E.coli Industry Revenue Share (%), by Country 2024 & 2032
- Figure 28: South America E.coli Industry Revenue (Million), by Test 2024 & 2032
- Figure 29: South America E.coli Industry Revenue Share (%), by Test 2024 & 2032
- Figure 30: South America E.coli Industry Revenue (Million), by Country 2024 & 2032
- Figure 31: South America E.coli Industry Revenue Share (%), by Country 2024 & 2032
List of Tables
- Table 1: Global E.coli Industry Revenue Million Forecast, by Region 2019 & 2032
- Table 2: Global E.coli Industry Revenue Million Forecast, by Test 2019 & 2032
- Table 3: Global E.coli Industry Revenue Million Forecast, by Region 2019 & 2032
- Table 4: Global E.coli Industry Revenue Million Forecast, by Country 2019 & 2032
- Table 5: United States E.coli Industry Revenue (Million) Forecast, by Application 2019 & 2032
- Table 6: Canada E.coli Industry Revenue (Million) Forecast, by Application 2019 & 2032
- Table 7: Mexico E.coli Industry Revenue (Million) Forecast, by Application 2019 & 2032
- Table 8: Global E.coli Industry Revenue Million Forecast, by Country 2019 & 2032
- Table 9: Germany E.coli Industry Revenue (Million) Forecast, by Application 2019 & 2032
- Table 10: United Kingdom E.coli Industry Revenue (Million) Forecast, by Application 2019 & 2032
- Table 11: France E.coli Industry Revenue (Million) Forecast, by Application 2019 & 2032
- Table 12: Italy E.coli Industry Revenue (Million) Forecast, by Application 2019 & 2032
- Table 13: Spain E.coli Industry Revenue (Million) Forecast, by Application 2019 & 2032
- Table 14: Rest of Europe E.coli Industry Revenue (Million) Forecast, by Application 2019 & 2032
- Table 15: Global E.coli Industry Revenue Million Forecast, by Country 2019 & 2032
- Table 16: China E.coli Industry Revenue (Million) Forecast, by Application 2019 & 2032
- Table 17: Japan E.coli Industry Revenue (Million) Forecast, by Application 2019 & 2032
- Table 18: India E.coli Industry Revenue (Million) Forecast, by Application 2019 & 2032
- Table 19: Australia E.coli Industry Revenue (Million) Forecast, by Application 2019 & 2032
- Table 20: South Korea E.coli Industry Revenue (Million) Forecast, by Application 2019 & 2032
- Table 21: Rest of Asia Pacific E.coli Industry Revenue (Million) Forecast, by Application 2019 & 2032
- Table 22: Global E.coli Industry Revenue Million Forecast, by Country 2019 & 2032
- Table 23: GCC E.coli Industry Revenue (Million) Forecast, by Application 2019 & 2032
- Table 24: South Africa E.coli Industry Revenue (Million) Forecast, by Application 2019 & 2032
- Table 25: Rest of Middle East and Africa E.coli Industry Revenue (Million) Forecast, by Application 2019 & 2032
- Table 26: Global E.coli Industry Revenue Million Forecast, by Country 2019 & 2032
- Table 27: Brazil E.coli Industry Revenue (Million) Forecast, by Application 2019 & 2032
- Table 28: Argentina E.coli Industry Revenue (Million) Forecast, by Application 2019 & 2032
- Table 29: Rest of South America E.coli Industry Revenue (Million) Forecast, by Application 2019 & 2032
- Table 30: Global E.coli Industry Revenue Million Forecast, by Test 2019 & 2032
- Table 31: Global E.coli Industry Revenue Million Forecast, by Country 2019 & 2032
- Table 32: United States E.coli Industry Revenue (Million) Forecast, by Application 2019 & 2032
- Table 33: Canada E.coli Industry Revenue (Million) Forecast, by Application 2019 & 2032
- Table 34: Mexico E.coli Industry Revenue (Million) Forecast, by Application 2019 & 2032
- Table 35: Global E.coli Industry Revenue Million Forecast, by Test 2019 & 2032
- Table 36: Global E.coli Industry Revenue Million Forecast, by Country 2019 & 2032
- Table 37: Germany E.coli Industry Revenue (Million) Forecast, by Application 2019 & 2032
- Table 38: United Kingdom E.coli Industry Revenue (Million) Forecast, by Application 2019 & 2032
- Table 39: France E.coli Industry Revenue (Million) Forecast, by Application 2019 & 2032
- Table 40: Italy E.coli Industry Revenue (Million) Forecast, by Application 2019 & 2032
- Table 41: Spain E.coli Industry Revenue (Million) Forecast, by Application 2019 & 2032
- Table 42: Rest of Europe E.coli Industry Revenue (Million) Forecast, by Application 2019 & 2032
- Table 43: Global E.coli Industry Revenue Million Forecast, by Test 2019 & 2032
- Table 44: Global E.coli Industry Revenue Million Forecast, by Country 2019 & 2032
- Table 45: China E.coli Industry Revenue (Million) Forecast, by Application 2019 & 2032
- Table 46: Japan E.coli Industry Revenue (Million) Forecast, by Application 2019 & 2032
- Table 47: India E.coli Industry Revenue (Million) Forecast, by Application 2019 & 2032
- Table 48: Australia E.coli Industry Revenue (Million) Forecast, by Application 2019 & 2032
- Table 49: South Korea E.coli Industry Revenue (Million) Forecast, by Application 2019 & 2032
- Table 50: Rest of Asia Pacific E.coli Industry Revenue (Million) Forecast, by Application 2019 & 2032
- Table 51: Global E.coli Industry Revenue Million Forecast, by Test 2019 & 2032
- Table 52: Global E.coli Industry Revenue Million Forecast, by Country 2019 & 2032
- Table 53: GCC E.coli Industry Revenue (Million) Forecast, by Application 2019 & 2032
- Table 54: South Africa E.coli Industry Revenue (Million) Forecast, by Application 2019 & 2032
- Table 55: Rest of Middle East and Africa E.coli Industry Revenue (Million) Forecast, by Application 2019 & 2032
- Table 56: Global E.coli Industry Revenue Million Forecast, by Test 2019 & 2032
- Table 57: Global E.coli Industry Revenue Million Forecast, by Country 2019 & 2032
- Table 58: Brazil E.coli Industry Revenue (Million) Forecast, by Application 2019 & 2032
- Table 59: Argentina E.coli Industry Revenue (Million) Forecast, by Application 2019 & 2032
- Table 60: Rest of South America E.coli Industry Revenue (Million) Forecast, by Application 2019 & 2032
Frequently Asked Questions
1. What is the projected Compound Annual Growth Rate (CAGR) of the E.coli Industry?
The projected CAGR is approximately 7.93%.
2. Which companies are prominent players in the E.coli Industry?
Key companies in the market include Caisson Laboratories Inc, Becton Dickinson and Company, Bio-Rad Laboratories Inc, Cell Culture Technologies LLC, GE Healthcare, Lonza Group Ltd, HiMedia Laboratories Pvt Ltd, Merck & Co Inc*List Not Exhaustive, Corning Incorporated, Fujifilm Holdings Corporation.
3. What are the main segments of the E.coli Industry?
The market segments include Test.
4. Can you provide details about the market size?
The market size is estimated to be USD 1.36 Million as of 2022.
5. What are some drivers contributing to market growth?
Increasing Prevalence of Diarrhoea; New Technological Advancements.
6. What are the notable trends driving market growth?
Polymerase Chain Reaction Segment is Expected to be Major Segment in the Escherichia coli Testing Market.
7. Are there any restraints impacting market growth?
High Cost of E. coli Treatment.
8. Can you provide examples of recent developments in the market?
In June 2022, Researchers from the Indian Institute of Technology (IIT) Kanpur developed an enzyme-substrate medium-based E.coli. water testing kit that is highly sensitive and can detect the presence or absence of a single E.coli. in drinking water.
9. What pricing options are available for accessing the report?
Pricing options include single-user, multi-user, and enterprise licenses priced at USD 4750, USD 5250, and USD 8750 respectively.
10. Is the market size provided in terms of value or volume?
The market size is provided in terms of value, measured in Million.
11. Are there any specific market keywords associated with the report?
Yes, the market keyword associated with the report is "E.coli Industry," which aids in identifying and referencing the specific market segment covered.
12. How do I determine which pricing option suits my needs best?
The pricing options vary based on user requirements and access needs. Individual users may opt for single-user licenses, while businesses requiring broader access may choose multi-user or enterprise licenses for cost-effective access to the report.
13. Are there any additional resources or data provided in the E.coli Industry report?
While the report offers comprehensive insights, it's advisable to review the specific contents or supplementary materials provided to ascertain if additional resources or data are available.
14. How can I stay updated on further developments or reports in the E.coli Industry?
To stay informed about further developments, trends, and reports in the E.coli Industry, consider subscribing to industry newsletters, following relevant companies and organizations, or regularly checking reputable industry news sources and publications.
Methodology
Step 1 - Identification of Relevant Samples Size from Population Database


Step 2 - Approaches for Defining Global Market Size (Value, Volume* & Price*)

Note*: In applicable scenarios
Step 3 - Data Sources
Primary Research
- Web Analytics
- Survey Reports
- Research Institute
- Latest Research Reports
- Opinion Leaders
Secondary Research
- Annual Reports
- White Paper
- Latest Press Release
- Industry Association
- Paid Database
- Investor Presentations

Step 4 - Data Triangulation
Involves using different sources of information in order to increase the validity of a study
These sources are likely to be stakeholders in a program - participants, other researchers, program staff, other community members, and so on.
Then we put all data in single framework & apply various statistical tools to find out the dynamic on the market.
During the analysis stage, feedback from the stakeholder groups would be compared to determine areas of agreement as well as areas of divergence


