
Key Insights
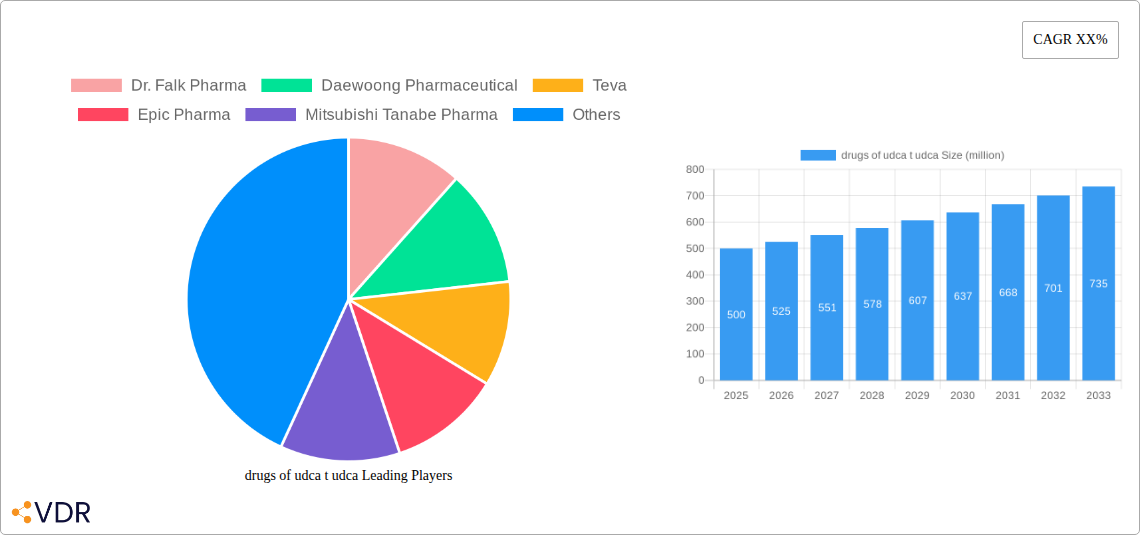
The global market for UDCA (Ursodiol) drugs is experiencing steady growth, driven by increasing prevalence of liver diseases, particularly primary biliary cholangitis (PBC) and primary sclerosing cholangitis (PSC), for which UDCA is a cornerstone therapy. The market, estimated at $500 million in 2025, is projected to exhibit a Compound Annual Growth Rate (CAGR) of 5% from 2025 to 2033. This growth is fueled by several factors, including rising awareness of liver diseases, advancements in diagnostic techniques leading to earlier diagnosis and treatment, and the expanding geriatric population, which is more susceptible to these conditions. Furthermore, the ongoing research and development efforts exploring UDCA's potential in other therapeutic areas, such as chronic liver disease, are expected to contribute significantly to market expansion. However, the market faces some challenges, including the availability of generic alternatives, which can lead to price pressure and competition. The emergence of newer therapies for liver diseases could also pose a threat to UDCA's market share in the long term. Nevertheless, UDCA's established efficacy, relatively low cost, and established market position ensure its continued relevance in the foreseeable future.
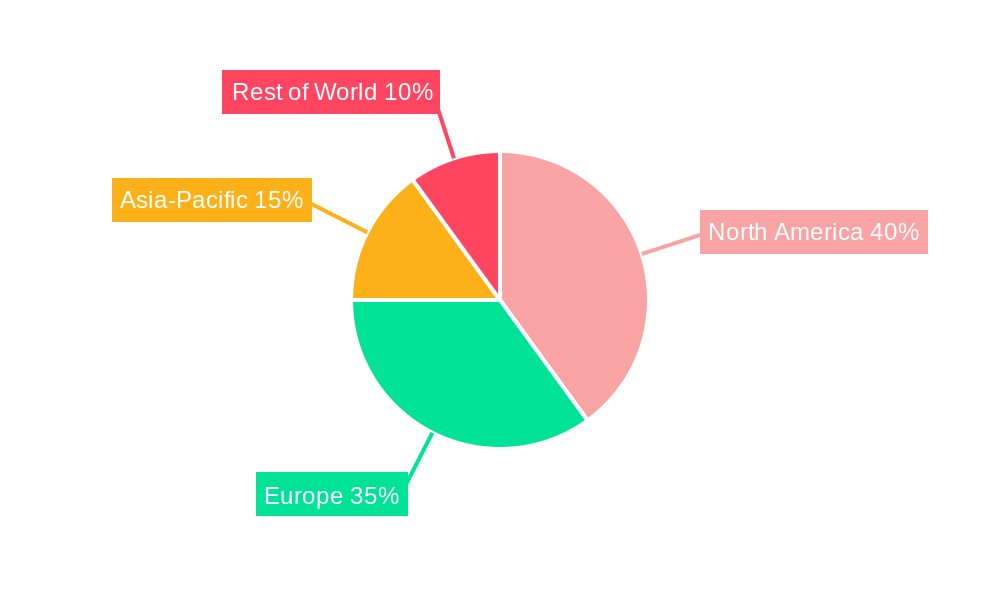
The market is segmented geographically, with North America and Europe currently dominating due to high healthcare expenditure and advanced healthcare infrastructure. However, Asia-Pacific is emerging as a promising region, driven by rising healthcare awareness and increased diagnostic capabilities. Key players like Dr. Falk Pharma, Daewoong Pharmaceutical, Teva, and others are actively involved in the UDCA market, with competition focused on price competitiveness and product differentiation, including development of novel formulations and extended-release versions to enhance patient compliance and therapeutic outcomes. The competitive landscape is moderately fragmented, suggesting opportunities for both established players and emerging market entrants. Over the forecast period (2025-2033), the market is anticipated to see a gradual increase in consolidation as larger companies acquire smaller players to expand their market reach and product portfolios. The overall outlook for the UDCA market is positive, with continued growth anticipated throughout the forecast period.
UDCA and TUDCA Market Report: A Comprehensive Analysis (2019-2033)
This comprehensive report provides an in-depth analysis of the global UDCA and TUDCA market, encompassing market dynamics, growth trends, regional segmentation, product landscape, competitive analysis, and future outlook. The study period covers 2019-2033, with a base year of 2025 and a forecast period of 2025-2033. The report is essential for industry professionals, investors, and researchers seeking a detailed understanding of this dynamic market.
Drugs of UDCA & TUDCA Market Dynamics & Structure
The UDCA and TUDCA market exhibits a moderately concentrated structure, with key players such as Dr. Falk Pharma, Daewoong Pharmaceutical, and Teva holding significant market share. Technological innovation, primarily focused on improving drug delivery and efficacy, is a key driver. Regulatory frameworks vary across geographies, impacting market access and pricing. Competitive substitutes include other bile acid therapies and emerging treatments. End-user demographics are primarily patients with liver diseases, cholestasis, and other conditions. The market has seen a moderate level of M&A activity, with xx deals recorded between 2019 and 2024.
- Market Concentration: Moderately concentrated, with top 5 players holding approximately xx% of market share in 2025.
- Technological Innovation: Focus on improved formulations (e.g., improved bioavailability, targeted delivery) and combination therapies.
- Regulatory Landscape: Stringent regulatory pathways in major markets, leading to variable approval timelines and pricing differences.
- Competitive Substitutes: Alternative bile acid therapies and emerging treatments for liver diseases pose competitive pressures.
- M&A Activity: xx deals recorded between 2019 and 2024, indicating strategic consolidation within the market.
Drugs of UDCA & TUDCA Growth Trends & Insights
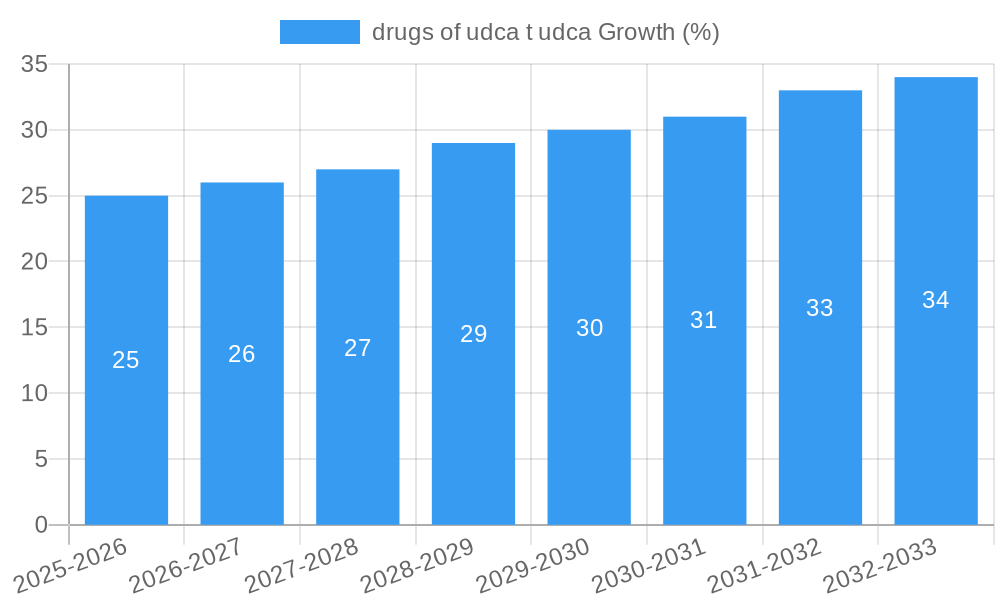
The global UDCA and TUDCA market is experiencing robust growth, driven by increasing prevalence of liver diseases, rising awareness among healthcare professionals, and growing adoption of these therapies. The market size reached xx million units in 2024 and is projected to reach xx million units by 2033, exhibiting a CAGR of xx% during the forecast period. This growth is fueled by factors including increasing prevalence of chronic liver diseases, technological advancements resulting in improved efficacy, and expanded indications. Consumer behavior shifts towards proactive healthcare management are further contributing to market expansion. The market penetration rate is expected to increase from xx% in 2024 to xx% in 2033, indicating substantial untapped potential.
Dominant Regions, Countries, or Segments in Drugs of UDCA & TUDCA
North America currently dominates the UDCA and TUDCA market, followed by Europe and Asia-Pacific. This dominance is attributed to factors such as higher prevalence of liver diseases, increased healthcare spending, robust healthcare infrastructure, and high awareness levels among healthcare professionals. The strong regulatory frameworks and reimbursement policies in North America further contribute to the region's leading position. However, rapidly growing economies and increasing healthcare spending in Asia-Pacific are expected to fuel significant market expansion in this region over the forecast period.
- North America: High prevalence of liver diseases, advanced healthcare infrastructure, and robust reimbursement policies contribute to market dominance.
- Europe: Significant market size driven by increasing awareness of UDCA and TUDCA therapies and rising incidence of related diseases.
- Asia-Pacific: Rapidly growing economies and increasing healthcare expenditure are fueling significant market growth potential.
- Key Drivers: Growing prevalence of chronic liver diseases, improved healthcare infrastructure, rising awareness among healthcare professionals, and favorable reimbursement policies.
Drugs of UDCA & TUDCA Product Landscape
The UDCA and TUDCA market comprises various formulations, including tablets, capsules, and solutions. Recent innovations focus on improving bioavailability, targeted delivery, and combination therapies to enhance therapeutic efficacy. Companies are actively developing novel formulations to address unmet clinical needs and improve patient compliance. The market is witnessing increased competition through unique selling propositions, including improved efficacy, reduced side effects, and enhanced convenience.
Key Drivers, Barriers & Challenges in Drugs of UDCA & TUDCA
Key Drivers: The increasing prevalence of chronic liver diseases, growing awareness among healthcare professionals, favorable regulatory approvals, and technological advancements driving efficacy and patient compliance are major drivers. Furthermore, strategic collaborations and partnerships among pharmaceutical companies accelerate market expansion.
Key Challenges: High manufacturing costs, stringent regulatory hurdles for new formulations, competition from alternative therapies, and potential supply chain disruptions due to geopolitical factors pose significant challenges to market growth. Furthermore, variations in reimbursement policies across different regions may limit market accessibility in specific areas.
Emerging Opportunities in Drugs of UDCA & TUDCA
Untapped markets in developing economies with high prevalence of liver diseases present significant opportunities. Innovative applications of UDCA and TUDCA in various therapeutic areas, including neurodegenerative disorders and inflammatory bowel disease, are emerging. The development of novel drug delivery systems and combination therapies to enhance treatment outcomes also offers significant opportunities for growth.
Growth Accelerators in the Drugs of UDCA & TUDCA Industry
Technological breakthroughs leading to improved efficacy and patient compliance are key growth accelerators. Strategic partnerships and collaborations between pharmaceutical companies and research institutions will also boost innovation and market expansion. Furthermore, expanding into new geographical markets and developing innovative marketing strategies to enhance awareness among healthcare professionals and patients are crucial growth drivers.
Key Players Shaping the Drugs of UDCA & TUDCA Market
- Dr. Falk Pharma
- Daewoong Pharmaceutical
- Teva
- Epic Pharma
- Mitsubishi Tanabe Pharma
- Lannett
- Mylan
- Bruschettini
- Impax
- Shanghai Pharma
- Grindeks
Notable Milestones in Drugs of UDCA & TUDCA Sector
- 2020: Launch of a novel UDCA formulation by Dr. Falk Pharma.
- 2022: Acquisition of a smaller UDCA manufacturer by Teva.
- 2023: Publication of positive clinical trial data supporting expanded indications for UDCA.
- 2024: Regulatory approval for a new TUDCA formulation in major markets.
In-Depth Drugs of UDCA & TUDCA Market Outlook
The UDCA and TUDCA market is poised for sustained growth, driven by increasing prevalence of target diseases, technological advancements, and expanding applications. Strategic partnerships, focus on improved formulations, and expansion into emerging markets will be crucial for future success. The market holds significant potential for both established players and emerging companies, presenting lucrative opportunities for innovation and growth in the coming years.
drugs of udca t udca Segmentation
- 1. Application
- 2. Types
drugs of udca t udca Segmentation By Geography
-
1. North America
- 1.1. United States
- 1.2. Canada
- 1.3. Mexico
-
2. South America
- 2.1. Brazil
- 2.2. Argentina
- 2.3. Rest of South America
-
3. Europe
- 3.1. United Kingdom
- 3.2. Germany
- 3.3. France
- 3.4. Italy
- 3.5. Spain
- 3.6. Russia
- 3.7. Benelux
- 3.8. Nordics
- 3.9. Rest of Europe
-
4. Middle East & Africa
- 4.1. Turkey
- 4.2. Israel
- 4.3. GCC
- 4.4. North Africa
- 4.5. South Africa
- 4.6. Rest of Middle East & Africa
-
5. Asia Pacific
- 5.1. China
- 5.2. India
- 5.3. Japan
- 5.4. South Korea
- 5.5. ASEAN
- 5.6. Oceania
- 5.7. Rest of Asia Pacific
drugs of udca t udca REPORT HIGHLIGHTS
| Aspects | Details |
|---|---|
| Study Period | 2019-2033 |
| Base Year | 2024 |
| Estimated Year | 2025 |
| Forecast Period | 2025-2033 |
| Historical Period | 2019-2024 |
| Growth Rate | CAGR of XX% from 2019-2033 |
| Segmentation |
|
Table of Contents
- 1. Introduction
- 1.1. Research Scope
- 1.2. Market Segmentation
- 1.3. Research Methodology
- 1.4. Definitions and Assumptions
- 2. Executive Summary
- 2.1. Introduction
- 3. Market Dynamics
- 3.1. Introduction
- 3.2. Market Drivers
- 3.3. Market Restrains
- 3.4. Market Trends
- 4. Market Factor Analysis
- 4.1. Porters Five Forces
- 4.2. Supply/Value Chain
- 4.3. PESTEL analysis
- 4.4. Market Entropy
- 4.5. Patent/Trademark Analysis
- 5. Global drugs of udca t udca Analysis, Insights and Forecast, 2019-2031
- 5.1. Market Analysis, Insights and Forecast - by Application
- 5.2. Market Analysis, Insights and Forecast - by Types
- 5.3. Market Analysis, Insights and Forecast - by Region
- 5.3.1. North America
- 5.3.2. South America
- 5.3.3. Europe
- 5.3.4. Middle East & Africa
- 5.3.5. Asia Pacific
- 5.1. Market Analysis, Insights and Forecast - by Application
- 6. North America drugs of udca t udca Analysis, Insights and Forecast, 2019-2031
- 6.1. Market Analysis, Insights and Forecast - by Application
- 6.2. Market Analysis, Insights and Forecast - by Types
- 6.1. Market Analysis, Insights and Forecast - by Application
- 7. South America drugs of udca t udca Analysis, Insights and Forecast, 2019-2031
- 7.1. Market Analysis, Insights and Forecast - by Application
- 7.2. Market Analysis, Insights and Forecast - by Types
- 7.1. Market Analysis, Insights and Forecast - by Application
- 8. Europe drugs of udca t udca Analysis, Insights and Forecast, 2019-2031
- 8.1. Market Analysis, Insights and Forecast - by Application
- 8.2. Market Analysis, Insights and Forecast - by Types
- 8.1. Market Analysis, Insights and Forecast - by Application
- 9. Middle East & Africa drugs of udca t udca Analysis, Insights and Forecast, 2019-2031
- 9.1. Market Analysis, Insights and Forecast - by Application
- 9.2. Market Analysis, Insights and Forecast - by Types
- 9.1. Market Analysis, Insights and Forecast - by Application
- 10. Asia Pacific drugs of udca t udca Analysis, Insights and Forecast, 2019-2031
- 10.1. Market Analysis, Insights and Forecast - by Application
- 10.2. Market Analysis, Insights and Forecast - by Types
- 10.1. Market Analysis, Insights and Forecast - by Application
- 11. Competitive Analysis
- 11.1. Global Market Share Analysis 2024
- 11.2. Company Profiles
- 11.2.1 Dr. Falk Pharma
- 11.2.1.1. Overview
- 11.2.1.2. Products
- 11.2.1.3. SWOT Analysis
- 11.2.1.4. Recent Developments
- 11.2.1.5. Financials (Based on Availability)
- 11.2.2 Daewoong Pharmaceutical
- 11.2.2.1. Overview
- 11.2.2.2. Products
- 11.2.2.3. SWOT Analysis
- 11.2.2.4. Recent Developments
- 11.2.2.5. Financials (Based on Availability)
- 11.2.3 Teva
- 11.2.3.1. Overview
- 11.2.3.2. Products
- 11.2.3.3. SWOT Analysis
- 11.2.3.4. Recent Developments
- 11.2.3.5. Financials (Based on Availability)
- 11.2.4 Epic Pharma
- 11.2.4.1. Overview
- 11.2.4.2. Products
- 11.2.4.3. SWOT Analysis
- 11.2.4.4. Recent Developments
- 11.2.4.5. Financials (Based on Availability)
- 11.2.5 Mitsubishi Tanabe Pharma
- 11.2.5.1. Overview
- 11.2.5.2. Products
- 11.2.5.3. SWOT Analysis
- 11.2.5.4. Recent Developments
- 11.2.5.5. Financials (Based on Availability)
- 11.2.6 Lannett
- 11.2.6.1. Overview
- 11.2.6.2. Products
- 11.2.6.3. SWOT Analysis
- 11.2.6.4. Recent Developments
- 11.2.6.5. Financials (Based on Availability)
- 11.2.7 Mylan
- 11.2.7.1. Overview
- 11.2.7.2. Products
- 11.2.7.3. SWOT Analysis
- 11.2.7.4. Recent Developments
- 11.2.7.5. Financials (Based on Availability)
- 11.2.8 Bruschettini
- 11.2.8.1. Overview
- 11.2.8.2. Products
- 11.2.8.3. SWOT Analysis
- 11.2.8.4. Recent Developments
- 11.2.8.5. Financials (Based on Availability)
- 11.2.9 Impax
- 11.2.9.1. Overview
- 11.2.9.2. Products
- 11.2.9.3. SWOT Analysis
- 11.2.9.4. Recent Developments
- 11.2.9.5. Financials (Based on Availability)
- 11.2.10 Shanghai Pharma
- 11.2.10.1. Overview
- 11.2.10.2. Products
- 11.2.10.3. SWOT Analysis
- 11.2.10.4. Recent Developments
- 11.2.10.5. Financials (Based on Availability)
- 11.2.11 Grindeks
- 11.2.11.1. Overview
- 11.2.11.2. Products
- 11.2.11.3. SWOT Analysis
- 11.2.11.4. Recent Developments
- 11.2.11.5. Financials (Based on Availability)
- 11.2.1 Dr. Falk Pharma
List of Figures
- Figure 1: Global drugs of udca t udca Revenue Breakdown (million, %) by Region 2024 & 2032
- Figure 2: Global drugs of udca t udca Volume Breakdown (K, %) by Region 2024 & 2032
- Figure 3: North America drugs of udca t udca Revenue (million), by Application 2024 & 2032
- Figure 4: North America drugs of udca t udca Volume (K), by Application 2024 & 2032
- Figure 5: North America drugs of udca t udca Revenue Share (%), by Application 2024 & 2032
- Figure 6: North America drugs of udca t udca Volume Share (%), by Application 2024 & 2032
- Figure 7: North America drugs of udca t udca Revenue (million), by Types 2024 & 2032
- Figure 8: North America drugs of udca t udca Volume (K), by Types 2024 & 2032
- Figure 9: North America drugs of udca t udca Revenue Share (%), by Types 2024 & 2032
- Figure 10: North America drugs of udca t udca Volume Share (%), by Types 2024 & 2032
- Figure 11: North America drugs of udca t udca Revenue (million), by Country 2024 & 2032
- Figure 12: North America drugs of udca t udca Volume (K), by Country 2024 & 2032
- Figure 13: North America drugs of udca t udca Revenue Share (%), by Country 2024 & 2032
- Figure 14: North America drugs of udca t udca Volume Share (%), by Country 2024 & 2032
- Figure 15: South America drugs of udca t udca Revenue (million), by Application 2024 & 2032
- Figure 16: South America drugs of udca t udca Volume (K), by Application 2024 & 2032
- Figure 17: South America drugs of udca t udca Revenue Share (%), by Application 2024 & 2032
- Figure 18: South America drugs of udca t udca Volume Share (%), by Application 2024 & 2032
- Figure 19: South America drugs of udca t udca Revenue (million), by Types 2024 & 2032
- Figure 20: South America drugs of udca t udca Volume (K), by Types 2024 & 2032
- Figure 21: South America drugs of udca t udca Revenue Share (%), by Types 2024 & 2032
- Figure 22: South America drugs of udca t udca Volume Share (%), by Types 2024 & 2032
- Figure 23: South America drugs of udca t udca Revenue (million), by Country 2024 & 2032
- Figure 24: South America drugs of udca t udca Volume (K), by Country 2024 & 2032
- Figure 25: South America drugs of udca t udca Revenue Share (%), by Country 2024 & 2032
- Figure 26: South America drugs of udca t udca Volume Share (%), by Country 2024 & 2032
- Figure 27: Europe drugs of udca t udca Revenue (million), by Application 2024 & 2032
- Figure 28: Europe drugs of udca t udca Volume (K), by Application 2024 & 2032
- Figure 29: Europe drugs of udca t udca Revenue Share (%), by Application 2024 & 2032
- Figure 30: Europe drugs of udca t udca Volume Share (%), by Application 2024 & 2032
- Figure 31: Europe drugs of udca t udca Revenue (million), by Types 2024 & 2032
- Figure 32: Europe drugs of udca t udca Volume (K), by Types 2024 & 2032
- Figure 33: Europe drugs of udca t udca Revenue Share (%), by Types 2024 & 2032
- Figure 34: Europe drugs of udca t udca Volume Share (%), by Types 2024 & 2032
- Figure 35: Europe drugs of udca t udca Revenue (million), by Country 2024 & 2032
- Figure 36: Europe drugs of udca t udca Volume (K), by Country 2024 & 2032
- Figure 37: Europe drugs of udca t udca Revenue Share (%), by Country 2024 & 2032
- Figure 38: Europe drugs of udca t udca Volume Share (%), by Country 2024 & 2032
- Figure 39: Middle East & Africa drugs of udca t udca Revenue (million), by Application 2024 & 2032
- Figure 40: Middle East & Africa drugs of udca t udca Volume (K), by Application 2024 & 2032
- Figure 41: Middle East & Africa drugs of udca t udca Revenue Share (%), by Application 2024 & 2032
- Figure 42: Middle East & Africa drugs of udca t udca Volume Share (%), by Application 2024 & 2032
- Figure 43: Middle East & Africa drugs of udca t udca Revenue (million), by Types 2024 & 2032
- Figure 44: Middle East & Africa drugs of udca t udca Volume (K), by Types 2024 & 2032
- Figure 45: Middle East & Africa drugs of udca t udca Revenue Share (%), by Types 2024 & 2032
- Figure 46: Middle East & Africa drugs of udca t udca Volume Share (%), by Types 2024 & 2032
- Figure 47: Middle East & Africa drugs of udca t udca Revenue (million), by Country 2024 & 2032
- Figure 48: Middle East & Africa drugs of udca t udca Volume (K), by Country 2024 & 2032
- Figure 49: Middle East & Africa drugs of udca t udca Revenue Share (%), by Country 2024 & 2032
- Figure 50: Middle East & Africa drugs of udca t udca Volume Share (%), by Country 2024 & 2032
- Figure 51: Asia Pacific drugs of udca t udca Revenue (million), by Application 2024 & 2032
- Figure 52: Asia Pacific drugs of udca t udca Volume (K), by Application 2024 & 2032
- Figure 53: Asia Pacific drugs of udca t udca Revenue Share (%), by Application 2024 & 2032
- Figure 54: Asia Pacific drugs of udca t udca Volume Share (%), by Application 2024 & 2032
- Figure 55: Asia Pacific drugs of udca t udca Revenue (million), by Types 2024 & 2032
- Figure 56: Asia Pacific drugs of udca t udca Volume (K), by Types 2024 & 2032
- Figure 57: Asia Pacific drugs of udca t udca Revenue Share (%), by Types 2024 & 2032
- Figure 58: Asia Pacific drugs of udca t udca Volume Share (%), by Types 2024 & 2032
- Figure 59: Asia Pacific drugs of udca t udca Revenue (million), by Country 2024 & 2032
- Figure 60: Asia Pacific drugs of udca t udca Volume (K), by Country 2024 & 2032
- Figure 61: Asia Pacific drugs of udca t udca Revenue Share (%), by Country 2024 & 2032
- Figure 62: Asia Pacific drugs of udca t udca Volume Share (%), by Country 2024 & 2032
List of Tables
- Table 1: Global drugs of udca t udca Revenue million Forecast, by Region 2019 & 2032
- Table 2: Global drugs of udca t udca Volume K Forecast, by Region 2019 & 2032
- Table 3: Global drugs of udca t udca Revenue million Forecast, by Application 2019 & 2032
- Table 4: Global drugs of udca t udca Volume K Forecast, by Application 2019 & 2032
- Table 5: Global drugs of udca t udca Revenue million Forecast, by Types 2019 & 2032
- Table 6: Global drugs of udca t udca Volume K Forecast, by Types 2019 & 2032
- Table 7: Global drugs of udca t udca Revenue million Forecast, by Region 2019 & 2032
- Table 8: Global drugs of udca t udca Volume K Forecast, by Region 2019 & 2032
- Table 9: Global drugs of udca t udca Revenue million Forecast, by Application 2019 & 2032
- Table 10: Global drugs of udca t udca Volume K Forecast, by Application 2019 & 2032
- Table 11: Global drugs of udca t udca Revenue million Forecast, by Types 2019 & 2032
- Table 12: Global drugs of udca t udca Volume K Forecast, by Types 2019 & 2032
- Table 13: Global drugs of udca t udca Revenue million Forecast, by Country 2019 & 2032
- Table 14: Global drugs of udca t udca Volume K Forecast, by Country 2019 & 2032
- Table 15: United States drugs of udca t udca Revenue (million) Forecast, by Application 2019 & 2032
- Table 16: United States drugs of udca t udca Volume (K) Forecast, by Application 2019 & 2032
- Table 17: Canada drugs of udca t udca Revenue (million) Forecast, by Application 2019 & 2032
- Table 18: Canada drugs of udca t udca Volume (K) Forecast, by Application 2019 & 2032
- Table 19: Mexico drugs of udca t udca Revenue (million) Forecast, by Application 2019 & 2032
- Table 20: Mexico drugs of udca t udca Volume (K) Forecast, by Application 2019 & 2032
- Table 21: Global drugs of udca t udca Revenue million Forecast, by Application 2019 & 2032
- Table 22: Global drugs of udca t udca Volume K Forecast, by Application 2019 & 2032
- Table 23: Global drugs of udca t udca Revenue million Forecast, by Types 2019 & 2032
- Table 24: Global drugs of udca t udca Volume K Forecast, by Types 2019 & 2032
- Table 25: Global drugs of udca t udca Revenue million Forecast, by Country 2019 & 2032
- Table 26: Global drugs of udca t udca Volume K Forecast, by Country 2019 & 2032
- Table 27: Brazil drugs of udca t udca Revenue (million) Forecast, by Application 2019 & 2032
- Table 28: Brazil drugs of udca t udca Volume (K) Forecast, by Application 2019 & 2032
- Table 29: Argentina drugs of udca t udca Revenue (million) Forecast, by Application 2019 & 2032
- Table 30: Argentina drugs of udca t udca Volume (K) Forecast, by Application 2019 & 2032
- Table 31: Rest of South America drugs of udca t udca Revenue (million) Forecast, by Application 2019 & 2032
- Table 32: Rest of South America drugs of udca t udca Volume (K) Forecast, by Application 2019 & 2032
- Table 33: Global drugs of udca t udca Revenue million Forecast, by Application 2019 & 2032
- Table 34: Global drugs of udca t udca Volume K Forecast, by Application 2019 & 2032
- Table 35: Global drugs of udca t udca Revenue million Forecast, by Types 2019 & 2032
- Table 36: Global drugs of udca t udca Volume K Forecast, by Types 2019 & 2032
- Table 37: Global drugs of udca t udca Revenue million Forecast, by Country 2019 & 2032
- Table 38: Global drugs of udca t udca Volume K Forecast, by Country 2019 & 2032
- Table 39: United Kingdom drugs of udca t udca Revenue (million) Forecast, by Application 2019 & 2032
- Table 40: United Kingdom drugs of udca t udca Volume (K) Forecast, by Application 2019 & 2032
- Table 41: Germany drugs of udca t udca Revenue (million) Forecast, by Application 2019 & 2032
- Table 42: Germany drugs of udca t udca Volume (K) Forecast, by Application 2019 & 2032
- Table 43: France drugs of udca t udca Revenue (million) Forecast, by Application 2019 & 2032
- Table 44: France drugs of udca t udca Volume (K) Forecast, by Application 2019 & 2032
- Table 45: Italy drugs of udca t udca Revenue (million) Forecast, by Application 2019 & 2032
- Table 46: Italy drugs of udca t udca Volume (K) Forecast, by Application 2019 & 2032
- Table 47: Spain drugs of udca t udca Revenue (million) Forecast, by Application 2019 & 2032
- Table 48: Spain drugs of udca t udca Volume (K) Forecast, by Application 2019 & 2032
- Table 49: Russia drugs of udca t udca Revenue (million) Forecast, by Application 2019 & 2032
- Table 50: Russia drugs of udca t udca Volume (K) Forecast, by Application 2019 & 2032
- Table 51: Benelux drugs of udca t udca Revenue (million) Forecast, by Application 2019 & 2032
- Table 52: Benelux drugs of udca t udca Volume (K) Forecast, by Application 2019 & 2032
- Table 53: Nordics drugs of udca t udca Revenue (million) Forecast, by Application 2019 & 2032
- Table 54: Nordics drugs of udca t udca Volume (K) Forecast, by Application 2019 & 2032
- Table 55: Rest of Europe drugs of udca t udca Revenue (million) Forecast, by Application 2019 & 2032
- Table 56: Rest of Europe drugs of udca t udca Volume (K) Forecast, by Application 2019 & 2032
- Table 57: Global drugs of udca t udca Revenue million Forecast, by Application 2019 & 2032
- Table 58: Global drugs of udca t udca Volume K Forecast, by Application 2019 & 2032
- Table 59: Global drugs of udca t udca Revenue million Forecast, by Types 2019 & 2032
- Table 60: Global drugs of udca t udca Volume K Forecast, by Types 2019 & 2032
- Table 61: Global drugs of udca t udca Revenue million Forecast, by Country 2019 & 2032
- Table 62: Global drugs of udca t udca Volume K Forecast, by Country 2019 & 2032
- Table 63: Turkey drugs of udca t udca Revenue (million) Forecast, by Application 2019 & 2032
- Table 64: Turkey drugs of udca t udca Volume (K) Forecast, by Application 2019 & 2032
- Table 65: Israel drugs of udca t udca Revenue (million) Forecast, by Application 2019 & 2032
- Table 66: Israel drugs of udca t udca Volume (K) Forecast, by Application 2019 & 2032
- Table 67: GCC drugs of udca t udca Revenue (million) Forecast, by Application 2019 & 2032
- Table 68: GCC drugs of udca t udca Volume (K) Forecast, by Application 2019 & 2032
- Table 69: North Africa drugs of udca t udca Revenue (million) Forecast, by Application 2019 & 2032
- Table 70: North Africa drugs of udca t udca Volume (K) Forecast, by Application 2019 & 2032
- Table 71: South Africa drugs of udca t udca Revenue (million) Forecast, by Application 2019 & 2032
- Table 72: South Africa drugs of udca t udca Volume (K) Forecast, by Application 2019 & 2032
- Table 73: Rest of Middle East & Africa drugs of udca t udca Revenue (million) Forecast, by Application 2019 & 2032
- Table 74: Rest of Middle East & Africa drugs of udca t udca Volume (K) Forecast, by Application 2019 & 2032
- Table 75: Global drugs of udca t udca Revenue million Forecast, by Application 2019 & 2032
- Table 76: Global drugs of udca t udca Volume K Forecast, by Application 2019 & 2032
- Table 77: Global drugs of udca t udca Revenue million Forecast, by Types 2019 & 2032
- Table 78: Global drugs of udca t udca Volume K Forecast, by Types 2019 & 2032
- Table 79: Global drugs of udca t udca Revenue million Forecast, by Country 2019 & 2032
- Table 80: Global drugs of udca t udca Volume K Forecast, by Country 2019 & 2032
- Table 81: China drugs of udca t udca Revenue (million) Forecast, by Application 2019 & 2032
- Table 82: China drugs of udca t udca Volume (K) Forecast, by Application 2019 & 2032
- Table 83: India drugs of udca t udca Revenue (million) Forecast, by Application 2019 & 2032
- Table 84: India drugs of udca t udca Volume (K) Forecast, by Application 2019 & 2032
- Table 85: Japan drugs of udca t udca Revenue (million) Forecast, by Application 2019 & 2032
- Table 86: Japan drugs of udca t udca Volume (K) Forecast, by Application 2019 & 2032
- Table 87: South Korea drugs of udca t udca Revenue (million) Forecast, by Application 2019 & 2032
- Table 88: South Korea drugs of udca t udca Volume (K) Forecast, by Application 2019 & 2032
- Table 89: ASEAN drugs of udca t udca Revenue (million) Forecast, by Application 2019 & 2032
- Table 90: ASEAN drugs of udca t udca Volume (K) Forecast, by Application 2019 & 2032
- Table 91: Oceania drugs of udca t udca Revenue (million) Forecast, by Application 2019 & 2032
- Table 92: Oceania drugs of udca t udca Volume (K) Forecast, by Application 2019 & 2032
- Table 93: Rest of Asia Pacific drugs of udca t udca Revenue (million) Forecast, by Application 2019 & 2032
- Table 94: Rest of Asia Pacific drugs of udca t udca Volume (K) Forecast, by Application 2019 & 2032
Frequently Asked Questions
1. What is the projected Compound Annual Growth Rate (CAGR) of the drugs of udca t udca?
The projected CAGR is approximately XX%.
2. Which companies are prominent players in the drugs of udca t udca?
Key companies in the market include Dr. Falk Pharma, Daewoong Pharmaceutical, Teva, Epic Pharma, Mitsubishi Tanabe Pharma, Lannett, Mylan, Bruschettini, Impax, Shanghai Pharma, Grindeks.
3. What are the main segments of the drugs of udca t udca?
The market segments include Application, Types.
4. Can you provide details about the market size?
The market size is estimated to be USD XXX million as of 2022.
5. What are some drivers contributing to market growth?
N/A
6. What are the notable trends driving market growth?
N/A
7. Are there any restraints impacting market growth?
N/A
8. Can you provide examples of recent developments in the market?
N/A
9. What pricing options are available for accessing the report?
Pricing options include single-user, multi-user, and enterprise licenses priced at USD 4350.00, USD 6525.00, and USD 8700.00 respectively.
10. Is the market size provided in terms of value or volume?
The market size is provided in terms of value, measured in million and volume, measured in K.
11. Are there any specific market keywords associated with the report?
Yes, the market keyword associated with the report is "drugs of udca t udca," which aids in identifying and referencing the specific market segment covered.
12. How do I determine which pricing option suits my needs best?
The pricing options vary based on user requirements and access needs. Individual users may opt for single-user licenses, while businesses requiring broader access may choose multi-user or enterprise licenses for cost-effective access to the report.
13. Are there any additional resources or data provided in the drugs of udca t udca report?
While the report offers comprehensive insights, it's advisable to review the specific contents or supplementary materials provided to ascertain if additional resources or data are available.
14. How can I stay updated on further developments or reports in the drugs of udca t udca?
To stay informed about further developments, trends, and reports in the drugs of udca t udca, consider subscribing to industry newsletters, following relevant companies and organizations, or regularly checking reputable industry news sources and publications.
Methodology
Step 1 - Identification of Relevant Samples Size from Population Database


Step 2 - Approaches for Defining Global Market Size (Value, Volume* & Price*)

Note*: In applicable scenarios
Step 3 - Data Sources
Primary Research
- Web Analytics
- Survey Reports
- Research Institute
- Latest Research Reports
- Opinion Leaders
Secondary Research
- Annual Reports
- White Paper
- Latest Press Release
- Industry Association
- Paid Database
- Investor Presentations

Step 4 - Data Triangulation
Involves using different sources of information in order to increase the validity of a study
These sources are likely to be stakeholders in a program - participants, other researchers, program staff, other community members, and so on.
Then we put all data in single framework & apply various statistical tools to find out the dynamic on the market.
During the analysis stage, feedback from the stakeholder groups would be compared to determine areas of agreement as well as areas of divergence


