
Key Insights
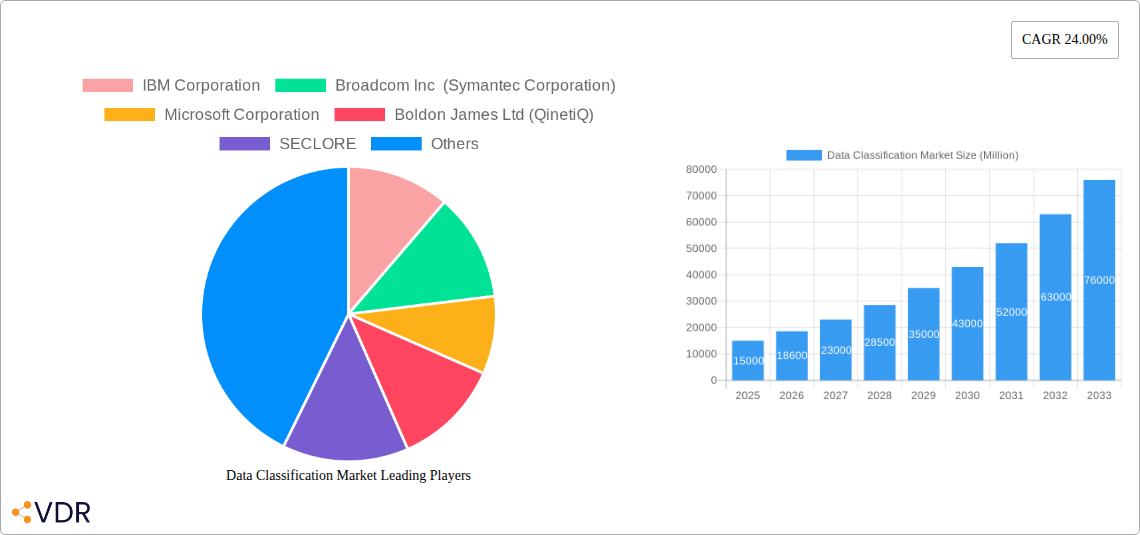
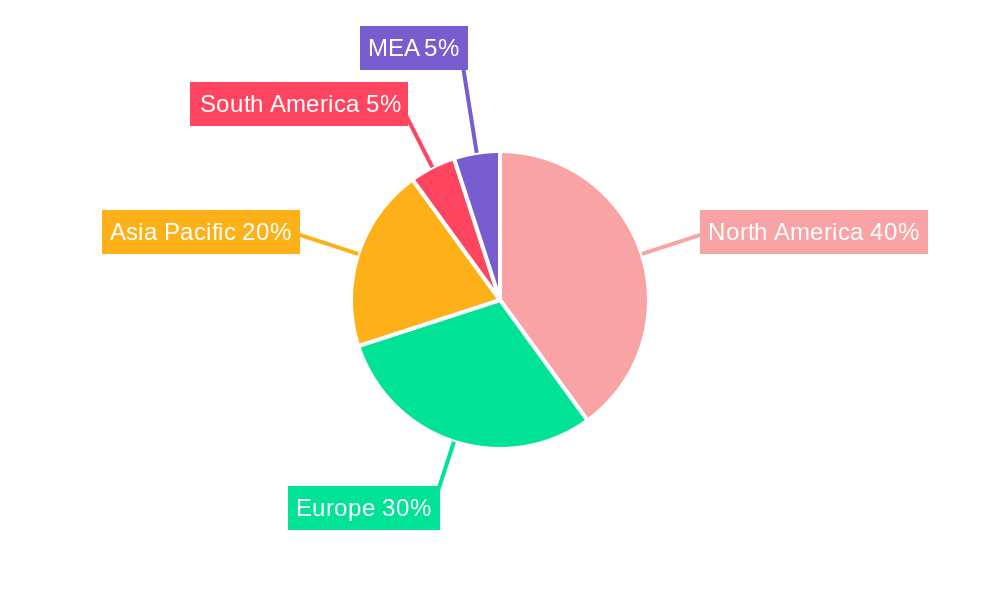
The Data Classification market is experiencing robust growth, projected to reach a substantial size by 2033. A 24% CAGR from 2025 indicates significant expansion driven by increasing data volumes, stringent regulatory compliance requirements (like GDPR and CCPA), and the rising need to protect sensitive information across diverse industries. The BFSI, healthcare, and government sectors are key adopters, emphasizing data security and privacy. The shift towards cloud-based solutions is a prominent trend, offering scalability and cost-effectiveness. Software solutions currently dominate the market, but the services segment is expected to grow rapidly due to increasing demand for expert consultation and implementation assistance. While the market faces some restraints, such as the complexity of implementation and high initial investment costs, the overall growth trajectory remains strongly positive, fueled by the aforementioned drivers. Key players, including IBM, Microsoft, and Broadcom (Symantec), are investing heavily in innovation and partnerships to capitalize on these market opportunities. The North American region currently holds a significant market share due to early adoption and a robust technological infrastructure, but the Asia-Pacific region is poised for considerable growth, driven by increasing digitalization and government initiatives.
The diverse applications of data classification, ranging from access management and governance to email and mobile protection, contribute to the market's breadth and depth. Further segmentation by deployment (on-premise versus cloud) reflects the evolving preferences of organizations. The competitive landscape is dynamic, with both established technology vendors and specialized data security firms vying for market share. Successful players will need to focus on providing comprehensive solutions that address the evolving needs of organizations in effectively managing and securing their sensitive data. Future growth will likely be influenced by advancements in artificial intelligence (AI) and machine learning (ML) for automated data classification, further simplifying the process and enhancing accuracy. The continued evolution of regulatory landscapes will also play a critical role in shaping the market's future.
Data Classification Market: A Comprehensive Report (2019-2033)
This in-depth report provides a comprehensive analysis of the Data Classification Market, encompassing market dynamics, growth trends, regional dominance, product landscape, key challenges and opportunities, and a detailed outlook for the forecast period (2025-2033). The report covers the parent market and dives deep into various segments, including by application, industry vertical, solution, and deployment, providing a granular understanding of this rapidly evolving landscape. The study period spans from 2019 to 2033, with 2025 serving as the base and estimated year. The total market size is predicted to reach xx Million by 2033.
Data Classification Market Dynamics & Structure
The Data Classification Market is characterized by a moderately concentrated landscape, with key players like IBM Corporation, Broadcom Inc. (Symantec Corporation), and Microsoft Corporation holding significant market share. However, the market is also witnessing increased competition from smaller, specialized vendors offering innovative solutions. Technological advancements, particularly in AI and machine learning, are driving significant innovation, enhancing the accuracy and efficiency of data classification systems.
Stringent data privacy regulations (e.g., GDPR, CCPA) are shaping market growth by mandating robust data classification and protection measures. The increasing volume and complexity of data, coupled with rising cyber threats, fuel demand for sophisticated data classification solutions. Furthermore, cloud adoption and the increasing use of mobile devices necessitate effective data classification across diverse environments. Mergers and acquisitions (M&A) activity has been moderate, with xx deals recorded between 2019-2024, mainly focused on enhancing product portfolios and expanding market reach.
- Market Concentration: Moderately concentrated, with top 5 players holding approximately xx% market share in 2024.
- Technological Drivers: AI/ML-powered automation, advanced encryption techniques.
- Regulatory Framework: GDPR, CCPA, and other regional data privacy regulations are key drivers.
- Competitive Substitutes: Limited direct substitutes, but alternative security measures indirectly compete.
- End-User Demographics: Primarily large enterprises and government organizations, with increasing adoption among SMEs.
- M&A Trends: xx M&A deals between 2019-2024, indicating consolidation and expansion strategies.
Data Classification Market Growth Trends & Insights
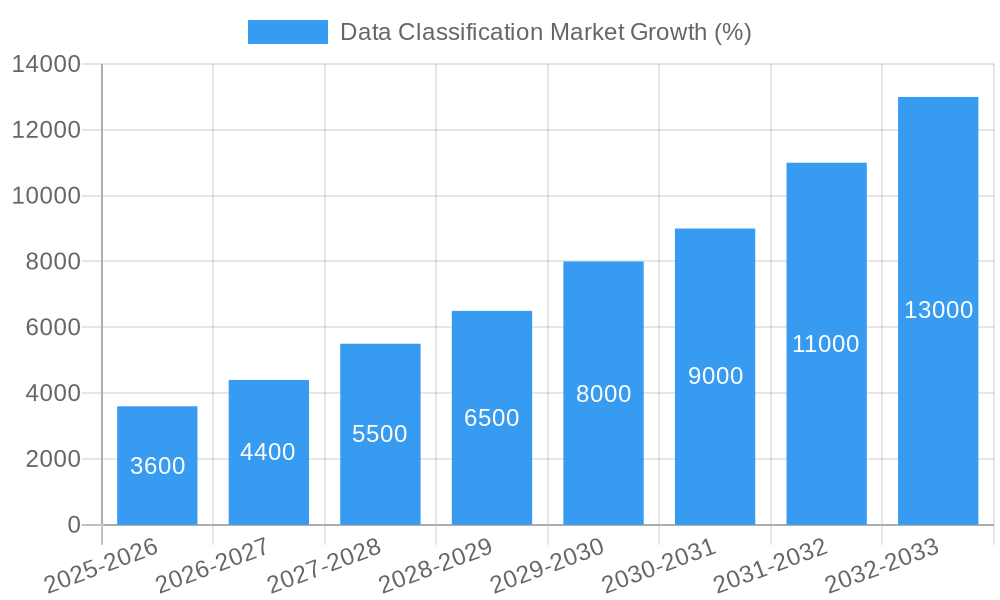
The Data Classification Market experienced significant growth during the historical period (2019-2024), driven by the factors outlined above. The market size grew from xx Million in 2019 to xx Million in 2024, exhibiting a Compound Annual Growth Rate (CAGR) of xx%. This growth trajectory is expected to continue into the forecast period (2025-2033), with the market size projected to reach xx Million by 2033, driven by increasing data breaches, stringent regulations, and expanding cloud adoption. The market penetration rate is currently at xx%, expected to increase to xx% by 2033. Technological disruptions, such as the rise of cloud-native solutions and AI-driven automation, are further accelerating market expansion. Consumer behavior shifts, including the increased reliance on remote work and mobile devices, also contribute to the heightened demand for robust data classification solutions.
Dominant Regions, Countries, or Segments in Data Classification Market
North America currently dominates the Data Classification Market, holding the largest market share (xx%) in 2024 due to high regulatory compliance needs and advanced technological infrastructure. Europe follows closely behind, driven by strong data privacy regulations like GDPR. Within segments, the Access Management application segment demonstrates the highest growth, with a market size of xx Million in 2024, driven by the growing need for secure access control and user authentication. The BFSI and Government & Defence industry verticals are major adopters, followed by Healthcare. The software solution segment holds a larger share compared to the services segment due to higher initial investments by organizations. The cloud deployment model is experiencing rapid growth, exceeding the on-premise model, due to its scalability, cost-effectiveness, and ease of access.
- Key Drivers (North America): Strong regulatory environment, high technological maturity, high adoption rate in BFSI and Government sectors.
- Key Drivers (Europe): GDPR compliance, increasing digitalization across industries.
- High-Growth Segments: Access Management application, BFSI and Government & Defence industry verticals, cloud deployment model, software solutions.
Data Classification Market Product Landscape
The Data Classification Market is characterized by a diverse range of solutions, from basic rule-based systems to sophisticated AI-powered platforms. Products vary in features, such as automated classification, granular access control, encryption capabilities, and reporting functionalities. Key innovations include advanced machine learning algorithms that improve classification accuracy and efficiency, as well as integration with cloud platforms for seamless data protection across hybrid environments. These solutions offer unique selling propositions centered on ease of use, enhanced security, and cost-effectiveness.
Key Drivers, Barriers & Challenges in Data Classification Market
Key Drivers:
- Increasing data breaches and cyberattacks necessitate robust data protection measures.
- Stringent data privacy regulations (GDPR, CCPA) drive demand for compliance solutions.
- Growing cloud adoption necessitates secure data classification across hybrid environments.
- Rise of AI and ML enhances the accuracy and efficiency of data classification.
Key Challenges & Restraints:
- High implementation costs can be a barrier for smaller organizations.
- Complex integrations with existing IT infrastructure can present challenges.
- Lack of skilled professionals to manage and maintain data classification systems hinders adoption.
- Difficulty in classifying unstructured data remains a significant hurdle.
Emerging Opportunities in Data Classification Market
- Expanding into untapped markets, particularly in developing economies.
- Developing solutions for emerging technologies like IoT and edge computing.
- Focusing on innovative applications such as automated data discovery and remediation.
- Catering to the growing demand for data classification solutions in specific industry verticals (e.g., healthcare, manufacturing).
Growth Accelerators in the Data Classification Market Industry
Strategic partnerships between data classification vendors and cloud providers, as well as continuous technological innovation such as AI-driven automation and enhanced encryption methods are crucial growth accelerators. Expanding into new geographic markets and developing solutions tailored to specific industry verticals also promises significant expansion opportunities. Furthermore, increasing awareness of data breaches and associated costs will further drive demand and investment in robust data classification solutions.
Key Players Shaping the Data Classification Market Market
- IBM Corporation
- Broadcom Inc. (Symantec Corporation)
- Microsoft Corporation
- Boldon James Ltd (QinetiQ)
- SECLORE
- Amazon Web Services Inc
- Digital Guardian
- Open Text Corporation
- HANDD Business Solutions
- Covata Limited
Notable Milestones in Data Classification Market Sector
- 2020: Increased adoption of cloud-based data classification solutions.
- 2021: Several key players launched AI-powered data classification platforms.
- 2022: Significant increase in M&A activity within the market.
- 2023: Focus on improving data classification accuracy and efficiency.
- 2024: Growing adoption of zero trust security principles.
In-Depth Data Classification Market Market Outlook
The Data Classification Market is poised for continued robust growth, driven by the factors discussed throughout this report. The increasing volume and sensitivity of data, coupled with evolving regulatory landscapes and sophisticated cyber threats, will fuel demand for advanced data classification solutions. Strategic partnerships, technological innovation, and expansion into untapped markets will continue to be key drivers of long-term growth. The market presents significant opportunities for established players and new entrants alike, particularly those focused on developing innovative solutions for emerging technologies and specific industry verticals.
Data Classification Market Segmentation
-
1. Solution
- 1.1. Software
- 1.2. Services
-
2. Deployment
- 2.1. On-Premise
- 2.2. Cloud
-
3. Application
- 3.1. Access Management
- 3.2. Governanace & Compliance Management
- 3.3. Email & Mobile Protection
- 3.4. Auditing & Reporting
- 3.5. Other Applications
-
4. Industry Verticals
- 4.1. BFSI
- 4.2. Healthcare
- 4.3. Government & Defence
- 4.4. IT & Telecom
- 4.5. Energy & Utilities
- 4.6. Other Industry Verticals
Data Classification Market Segmentation By Geography
-
1. North America
- 1.1. United States
- 1.2. Canada
-
2. Europe
- 2.1. United Kingdom
- 2.2. Germany
- 2.3. France
- 2.4. Rest of Europe
-
3. Asia Pacific
- 3.1. China
- 3.2. Japan
- 3.3. India
- 3.4. Rest of Asia Pacific
-
4. Rest of the World
- 4.1. Latin America
- 4.2. Middle East
Data Classification Market REPORT HIGHLIGHTS
| Aspects | Details |
|---|---|
| Study Period | 2019-2033 |
| Base Year | 2024 |
| Estimated Year | 2025 |
| Forecast Period | 2025-2033 |
| Historical Period | 2019-2024 |
| Growth Rate | CAGR of 24.00% from 2019-2033 |
| Segmentation |
|
Table of Contents
- 1. Introduction
- 1.1. Research Scope
- 1.2. Market Segmentation
- 1.3. Research Methodology
- 1.4. Definitions and Assumptions
- 2. Executive Summary
- 2.1. Introduction
- 3. Market Dynamics
- 3.1. Introduction
- 3.2. Market Drivers
- 3.2.1. ; Government Regulations and Compliance for Privacy & Data Security; Concern for Data Theft due to Mismanagement; Surge in Analytics Applications with Stored Data
- 3.3. Market Restrains
- 3.3.1 Limited Efficiency Compared to Shared Hosting
- 3.3.2 Dedicated Hosting
- 3.3.3 and Cloud Servers
- 3.4. Market Trends
- 3.4.1. Surge in Data Security Solutions for Increased Malware Infection Rates in Computers
- 4. Market Factor Analysis
- 4.1. Porters Five Forces
- 4.2. Supply/Value Chain
- 4.3. PESTEL analysis
- 4.4. Market Entropy
- 4.5. Patent/Trademark Analysis
- 5. Global Data Classification Market Analysis, Insights and Forecast, 2019-2031
- 5.1. Market Analysis, Insights and Forecast - by Solution
- 5.1.1. Software
- 5.1.2. Services
- 5.2. Market Analysis, Insights and Forecast - by Deployment
- 5.2.1. On-Premise
- 5.2.2. Cloud
- 5.3. Market Analysis, Insights and Forecast - by Application
- 5.3.1. Access Management
- 5.3.2. Governanace & Compliance Management
- 5.3.3. Email & Mobile Protection
- 5.3.4. Auditing & Reporting
- 5.3.5. Other Applications
- 5.4. Market Analysis, Insights and Forecast - by Industry Verticals
- 5.4.1. BFSI
- 5.4.2. Healthcare
- 5.4.3. Government & Defence
- 5.4.4. IT & Telecom
- 5.4.5. Energy & Utilities
- 5.4.6. Other Industry Verticals
- 5.5. Market Analysis, Insights and Forecast - by Region
- 5.5.1. North America
- 5.5.2. Europe
- 5.5.3. Asia Pacific
- 5.5.4. Rest of the World
- 5.1. Market Analysis, Insights and Forecast - by Solution
- 6. North America Data Classification Market Analysis, Insights and Forecast, 2019-2031
- 6.1. Market Analysis, Insights and Forecast - by Solution
- 6.1.1. Software
- 6.1.2. Services
- 6.2. Market Analysis, Insights and Forecast - by Deployment
- 6.2.1. On-Premise
- 6.2.2. Cloud
- 6.3. Market Analysis, Insights and Forecast - by Application
- 6.3.1. Access Management
- 6.3.2. Governanace & Compliance Management
- 6.3.3. Email & Mobile Protection
- 6.3.4. Auditing & Reporting
- 6.3.5. Other Applications
- 6.4. Market Analysis, Insights and Forecast - by Industry Verticals
- 6.4.1. BFSI
- 6.4.2. Healthcare
- 6.4.3. Government & Defence
- 6.4.4. IT & Telecom
- 6.4.5. Energy & Utilities
- 6.4.6. Other Industry Verticals
- 6.1. Market Analysis, Insights and Forecast - by Solution
- 7. Europe Data Classification Market Analysis, Insights and Forecast, 2019-2031
- 7.1. Market Analysis, Insights and Forecast - by Solution
- 7.1.1. Software
- 7.1.2. Services
- 7.2. Market Analysis, Insights and Forecast - by Deployment
- 7.2.1. On-Premise
- 7.2.2. Cloud
- 7.3. Market Analysis, Insights and Forecast - by Application
- 7.3.1. Access Management
- 7.3.2. Governanace & Compliance Management
- 7.3.3. Email & Mobile Protection
- 7.3.4. Auditing & Reporting
- 7.3.5. Other Applications
- 7.4. Market Analysis, Insights and Forecast - by Industry Verticals
- 7.4.1. BFSI
- 7.4.2. Healthcare
- 7.4.3. Government & Defence
- 7.4.4. IT & Telecom
- 7.4.5. Energy & Utilities
- 7.4.6. Other Industry Verticals
- 7.1. Market Analysis, Insights and Forecast - by Solution
- 8. Asia Pacific Data Classification Market Analysis, Insights and Forecast, 2019-2031
- 8.1. Market Analysis, Insights and Forecast - by Solution
- 8.1.1. Software
- 8.1.2. Services
- 8.2. Market Analysis, Insights and Forecast - by Deployment
- 8.2.1. On-Premise
- 8.2.2. Cloud
- 8.3. Market Analysis, Insights and Forecast - by Application
- 8.3.1. Access Management
- 8.3.2. Governanace & Compliance Management
- 8.3.3. Email & Mobile Protection
- 8.3.4. Auditing & Reporting
- 8.3.5. Other Applications
- 8.4. Market Analysis, Insights and Forecast - by Industry Verticals
- 8.4.1. BFSI
- 8.4.2. Healthcare
- 8.4.3. Government & Defence
- 8.4.4. IT & Telecom
- 8.4.5. Energy & Utilities
- 8.4.6. Other Industry Verticals
- 8.1. Market Analysis, Insights and Forecast - by Solution
- 9. Rest of the World Data Classification Market Analysis, Insights and Forecast, 2019-2031
- 9.1. Market Analysis, Insights and Forecast - by Solution
- 9.1.1. Software
- 9.1.2. Services
- 9.2. Market Analysis, Insights and Forecast - by Deployment
- 9.2.1. On-Premise
- 9.2.2. Cloud
- 9.3. Market Analysis, Insights and Forecast - by Application
- 9.3.1. Access Management
- 9.3.2. Governanace & Compliance Management
- 9.3.3. Email & Mobile Protection
- 9.3.4. Auditing & Reporting
- 9.3.5. Other Applications
- 9.4. Market Analysis, Insights and Forecast - by Industry Verticals
- 9.4.1. BFSI
- 9.4.2. Healthcare
- 9.4.3. Government & Defence
- 9.4.4. IT & Telecom
- 9.4.5. Energy & Utilities
- 9.4.6. Other Industry Verticals
- 9.1. Market Analysis, Insights and Forecast - by Solution
- 10. North America Data Classification Market Analysis, Insights and Forecast, 2019-2031
- 10.1. Market Analysis, Insights and Forecast - By Country/Sub-region
- 10.1.1 United States
- 10.1.2 Canada
- 10.1.3 Mexico
- 11. Europe Data Classification Market Analysis, Insights and Forecast, 2019-2031
- 11.1. Market Analysis, Insights and Forecast - By Country/Sub-region
- 11.1.1 Germany
- 11.1.2 United Kingdom
- 11.1.3 France
- 11.1.4 Spain
- 11.1.5 Italy
- 11.1.6 Spain
- 11.1.7 Belgium
- 11.1.8 Netherland
- 11.1.9 Nordics
- 11.1.10 Rest of Europe
- 12. Asia Pacific Data Classification Market Analysis, Insights and Forecast, 2019-2031
- 12.1. Market Analysis, Insights and Forecast - By Country/Sub-region
- 12.1.1 China
- 12.1.2 Japan
- 12.1.3 India
- 12.1.4 South Korea
- 12.1.5 Southeast Asia
- 12.1.6 Australia
- 12.1.7 Indonesia
- 12.1.8 Phillipes
- 12.1.9 Singapore
- 12.1.10 Thailandc
- 12.1.11 Rest of Asia Pacific
- 13. South America Data Classification Market Analysis, Insights and Forecast, 2019-2031
- 13.1. Market Analysis, Insights and Forecast - By Country/Sub-region
- 13.1.1 Brazil
- 13.1.2 Argentina
- 13.1.3 Peru
- 13.1.4 Chile
- 13.1.5 Colombia
- 13.1.6 Ecuador
- 13.1.7 Venezuela
- 13.1.8 Rest of South America
- 14. North America Data Classification Market Analysis, Insights and Forecast, 2019-2031
- 14.1. Market Analysis, Insights and Forecast - By Country/Sub-region
- 14.1.1 United States
- 14.1.2 Canada
- 14.1.3 Mexico
- 15. MEA Data Classification Market Analysis, Insights and Forecast, 2019-2031
- 15.1. Market Analysis, Insights and Forecast - By Country/Sub-region
- 15.1.1 United Arab Emirates
- 15.1.2 Saudi Arabia
- 15.1.3 South Africa
- 15.1.4 Rest of Middle East and Africa
- 16. Competitive Analysis
- 16.1. Global Market Share Analysis 2024
- 16.2. Company Profiles
- 16.2.1 IBM Corporation
- 16.2.1.1. Overview
- 16.2.1.2. Products
- 16.2.1.3. SWOT Analysis
- 16.2.1.4. Recent Developments
- 16.2.1.5. Financials (Based on Availability)
- 16.2.2 Broadcom Inc (Symantec Corporation)
- 16.2.2.1. Overview
- 16.2.2.2. Products
- 16.2.2.3. SWOT Analysis
- 16.2.2.4. Recent Developments
- 16.2.2.5. Financials (Based on Availability)
- 16.2.3 Microsoft Corporation
- 16.2.3.1. Overview
- 16.2.3.2. Products
- 16.2.3.3. SWOT Analysis
- 16.2.3.4. Recent Developments
- 16.2.3.5. Financials (Based on Availability)
- 16.2.4 Boldon James Ltd (QinetiQ)
- 16.2.4.1. Overview
- 16.2.4.2. Products
- 16.2.4.3. SWOT Analysis
- 16.2.4.4. Recent Developments
- 16.2.4.5. Financials (Based on Availability)
- 16.2.5 SECLORE
- 16.2.5.1. Overview
- 16.2.5.2. Products
- 16.2.5.3. SWOT Analysis
- 16.2.5.4. Recent Developments
- 16.2.5.5. Financials (Based on Availability)
- 16.2.6 Amazon Web Services Inc
- 16.2.6.1. Overview
- 16.2.6.2. Products
- 16.2.6.3. SWOT Analysis
- 16.2.6.4. Recent Developments
- 16.2.6.5. Financials (Based on Availability)
- 16.2.7 Digital Guardian
- 16.2.7.1. Overview
- 16.2.7.2. Products
- 16.2.7.3. SWOT Analysis
- 16.2.7.4. Recent Developments
- 16.2.7.5. Financials (Based on Availability)
- 16.2.8 Open Text Corporation
- 16.2.8.1. Overview
- 16.2.8.2. Products
- 16.2.8.3. SWOT Analysis
- 16.2.8.4. Recent Developments
- 16.2.8.5. Financials (Based on Availability)
- 16.2.9 HANDD Business Solutions
- 16.2.9.1. Overview
- 16.2.9.2. Products
- 16.2.9.3. SWOT Analysis
- 16.2.9.4. Recent Developments
- 16.2.9.5. Financials (Based on Availability)
- 16.2.10 Covata Limited
- 16.2.10.1. Overview
- 16.2.10.2. Products
- 16.2.10.3. SWOT Analysis
- 16.2.10.4. Recent Developments
- 16.2.10.5. Financials (Based on Availability)
- 16.2.1 IBM Corporation
List of Figures
- Figure 1: Global Data Classification Market Revenue Breakdown (Million, %) by Region 2024 & 2032
- Figure 2: Global Data Classification Market Volume Breakdown (K Unit, %) by Region 2024 & 2032
- Figure 3: North America Data Classification Market Revenue (Million), by Country 2024 & 2032
- Figure 4: North America Data Classification Market Volume (K Unit), by Country 2024 & 2032
- Figure 5: North America Data Classification Market Revenue Share (%), by Country 2024 & 2032
- Figure 6: North America Data Classification Market Volume Share (%), by Country 2024 & 2032
- Figure 7: Europe Data Classification Market Revenue (Million), by Country 2024 & 2032
- Figure 8: Europe Data Classification Market Volume (K Unit), by Country 2024 & 2032
- Figure 9: Europe Data Classification Market Revenue Share (%), by Country 2024 & 2032
- Figure 10: Europe Data Classification Market Volume Share (%), by Country 2024 & 2032
- Figure 11: Asia Pacific Data Classification Market Revenue (Million), by Country 2024 & 2032
- Figure 12: Asia Pacific Data Classification Market Volume (K Unit), by Country 2024 & 2032
- Figure 13: Asia Pacific Data Classification Market Revenue Share (%), by Country 2024 & 2032
- Figure 14: Asia Pacific Data Classification Market Volume Share (%), by Country 2024 & 2032
- Figure 15: South America Data Classification Market Revenue (Million), by Country 2024 & 2032
- Figure 16: South America Data Classification Market Volume (K Unit), by Country 2024 & 2032
- Figure 17: South America Data Classification Market Revenue Share (%), by Country 2024 & 2032
- Figure 18: South America Data Classification Market Volume Share (%), by Country 2024 & 2032
- Figure 19: North America Data Classification Market Revenue (Million), by Country 2024 & 2032
- Figure 20: North America Data Classification Market Volume (K Unit), by Country 2024 & 2032
- Figure 21: North America Data Classification Market Revenue Share (%), by Country 2024 & 2032
- Figure 22: North America Data Classification Market Volume Share (%), by Country 2024 & 2032
- Figure 23: MEA Data Classification Market Revenue (Million), by Country 2024 & 2032
- Figure 24: MEA Data Classification Market Volume (K Unit), by Country 2024 & 2032
- Figure 25: MEA Data Classification Market Revenue Share (%), by Country 2024 & 2032
- Figure 26: MEA Data Classification Market Volume Share (%), by Country 2024 & 2032
- Figure 27: North America Data Classification Market Revenue (Million), by Solution 2024 & 2032
- Figure 28: North America Data Classification Market Volume (K Unit), by Solution 2024 & 2032
- Figure 29: North America Data Classification Market Revenue Share (%), by Solution 2024 & 2032
- Figure 30: North America Data Classification Market Volume Share (%), by Solution 2024 & 2032
- Figure 31: North America Data Classification Market Revenue (Million), by Deployment 2024 & 2032
- Figure 32: North America Data Classification Market Volume (K Unit), by Deployment 2024 & 2032
- Figure 33: North America Data Classification Market Revenue Share (%), by Deployment 2024 & 2032
- Figure 34: North America Data Classification Market Volume Share (%), by Deployment 2024 & 2032
- Figure 35: North America Data Classification Market Revenue (Million), by Application 2024 & 2032
- Figure 36: North America Data Classification Market Volume (K Unit), by Application 2024 & 2032
- Figure 37: North America Data Classification Market Revenue Share (%), by Application 2024 & 2032
- Figure 38: North America Data Classification Market Volume Share (%), by Application 2024 & 2032
- Figure 39: North America Data Classification Market Revenue (Million), by Industry Verticals 2024 & 2032
- Figure 40: North America Data Classification Market Volume (K Unit), by Industry Verticals 2024 & 2032
- Figure 41: North America Data Classification Market Revenue Share (%), by Industry Verticals 2024 & 2032
- Figure 42: North America Data Classification Market Volume Share (%), by Industry Verticals 2024 & 2032
- Figure 43: North America Data Classification Market Revenue (Million), by Country 2024 & 2032
- Figure 44: North America Data Classification Market Volume (K Unit), by Country 2024 & 2032
- Figure 45: North America Data Classification Market Revenue Share (%), by Country 2024 & 2032
- Figure 46: North America Data Classification Market Volume Share (%), by Country 2024 & 2032
- Figure 47: Europe Data Classification Market Revenue (Million), by Solution 2024 & 2032
- Figure 48: Europe Data Classification Market Volume (K Unit), by Solution 2024 & 2032
- Figure 49: Europe Data Classification Market Revenue Share (%), by Solution 2024 & 2032
- Figure 50: Europe Data Classification Market Volume Share (%), by Solution 2024 & 2032
- Figure 51: Europe Data Classification Market Revenue (Million), by Deployment 2024 & 2032
- Figure 52: Europe Data Classification Market Volume (K Unit), by Deployment 2024 & 2032
- Figure 53: Europe Data Classification Market Revenue Share (%), by Deployment 2024 & 2032
- Figure 54: Europe Data Classification Market Volume Share (%), by Deployment 2024 & 2032
- Figure 55: Europe Data Classification Market Revenue (Million), by Application 2024 & 2032
- Figure 56: Europe Data Classification Market Volume (K Unit), by Application 2024 & 2032
- Figure 57: Europe Data Classification Market Revenue Share (%), by Application 2024 & 2032
- Figure 58: Europe Data Classification Market Volume Share (%), by Application 2024 & 2032
- Figure 59: Europe Data Classification Market Revenue (Million), by Industry Verticals 2024 & 2032
- Figure 60: Europe Data Classification Market Volume (K Unit), by Industry Verticals 2024 & 2032
- Figure 61: Europe Data Classification Market Revenue Share (%), by Industry Verticals 2024 & 2032
- Figure 62: Europe Data Classification Market Volume Share (%), by Industry Verticals 2024 & 2032
- Figure 63: Europe Data Classification Market Revenue (Million), by Country 2024 & 2032
- Figure 64: Europe Data Classification Market Volume (K Unit), by Country 2024 & 2032
- Figure 65: Europe Data Classification Market Revenue Share (%), by Country 2024 & 2032
- Figure 66: Europe Data Classification Market Volume Share (%), by Country 2024 & 2032
- Figure 67: Asia Pacific Data Classification Market Revenue (Million), by Solution 2024 & 2032
- Figure 68: Asia Pacific Data Classification Market Volume (K Unit), by Solution 2024 & 2032
- Figure 69: Asia Pacific Data Classification Market Revenue Share (%), by Solution 2024 & 2032
- Figure 70: Asia Pacific Data Classification Market Volume Share (%), by Solution 2024 & 2032
- Figure 71: Asia Pacific Data Classification Market Revenue (Million), by Deployment 2024 & 2032
- Figure 72: Asia Pacific Data Classification Market Volume (K Unit), by Deployment 2024 & 2032
- Figure 73: Asia Pacific Data Classification Market Revenue Share (%), by Deployment 2024 & 2032
- Figure 74: Asia Pacific Data Classification Market Volume Share (%), by Deployment 2024 & 2032
- Figure 75: Asia Pacific Data Classification Market Revenue (Million), by Application 2024 & 2032
- Figure 76: Asia Pacific Data Classification Market Volume (K Unit), by Application 2024 & 2032
- Figure 77: Asia Pacific Data Classification Market Revenue Share (%), by Application 2024 & 2032
- Figure 78: Asia Pacific Data Classification Market Volume Share (%), by Application 2024 & 2032
- Figure 79: Asia Pacific Data Classification Market Revenue (Million), by Industry Verticals 2024 & 2032
- Figure 80: Asia Pacific Data Classification Market Volume (K Unit), by Industry Verticals 2024 & 2032
- Figure 81: Asia Pacific Data Classification Market Revenue Share (%), by Industry Verticals 2024 & 2032
- Figure 82: Asia Pacific Data Classification Market Volume Share (%), by Industry Verticals 2024 & 2032
- Figure 83: Asia Pacific Data Classification Market Revenue (Million), by Country 2024 & 2032
- Figure 84: Asia Pacific Data Classification Market Volume (K Unit), by Country 2024 & 2032
- Figure 85: Asia Pacific Data Classification Market Revenue Share (%), by Country 2024 & 2032
- Figure 86: Asia Pacific Data Classification Market Volume Share (%), by Country 2024 & 2032
- Figure 87: Rest of the World Data Classification Market Revenue (Million), by Solution 2024 & 2032
- Figure 88: Rest of the World Data Classification Market Volume (K Unit), by Solution 2024 & 2032
- Figure 89: Rest of the World Data Classification Market Revenue Share (%), by Solution 2024 & 2032
- Figure 90: Rest of the World Data Classification Market Volume Share (%), by Solution 2024 & 2032
- Figure 91: Rest of the World Data Classification Market Revenue (Million), by Deployment 2024 & 2032
- Figure 92: Rest of the World Data Classification Market Volume (K Unit), by Deployment 2024 & 2032
- Figure 93: Rest of the World Data Classification Market Revenue Share (%), by Deployment 2024 & 2032
- Figure 94: Rest of the World Data Classification Market Volume Share (%), by Deployment 2024 & 2032
- Figure 95: Rest of the World Data Classification Market Revenue (Million), by Application 2024 & 2032
- Figure 96: Rest of the World Data Classification Market Volume (K Unit), by Application 2024 & 2032
- Figure 97: Rest of the World Data Classification Market Revenue Share (%), by Application 2024 & 2032
- Figure 98: Rest of the World Data Classification Market Volume Share (%), by Application 2024 & 2032
- Figure 99: Rest of the World Data Classification Market Revenue (Million), by Industry Verticals 2024 & 2032
- Figure 100: Rest of the World Data Classification Market Volume (K Unit), by Industry Verticals 2024 & 2032
- Figure 101: Rest of the World Data Classification Market Revenue Share (%), by Industry Verticals 2024 & 2032
- Figure 102: Rest of the World Data Classification Market Volume Share (%), by Industry Verticals 2024 & 2032
- Figure 103: Rest of the World Data Classification Market Revenue (Million), by Country 2024 & 2032
- Figure 104: Rest of the World Data Classification Market Volume (K Unit), by Country 2024 & 2032
- Figure 105: Rest of the World Data Classification Market Revenue Share (%), by Country 2024 & 2032
- Figure 106: Rest of the World Data Classification Market Volume Share (%), by Country 2024 & 2032
List of Tables
- Table 1: Global Data Classification Market Revenue Million Forecast, by Region 2019 & 2032
- Table 2: Global Data Classification Market Volume K Unit Forecast, by Region 2019 & 2032
- Table 3: Global Data Classification Market Revenue Million Forecast, by Solution 2019 & 2032
- Table 4: Global Data Classification Market Volume K Unit Forecast, by Solution 2019 & 2032
- Table 5: Global Data Classification Market Revenue Million Forecast, by Deployment 2019 & 2032
- Table 6: Global Data Classification Market Volume K Unit Forecast, by Deployment 2019 & 2032
- Table 7: Global Data Classification Market Revenue Million Forecast, by Application 2019 & 2032
- Table 8: Global Data Classification Market Volume K Unit Forecast, by Application 2019 & 2032
- Table 9: Global Data Classification Market Revenue Million Forecast, by Industry Verticals 2019 & 2032
- Table 10: Global Data Classification Market Volume K Unit Forecast, by Industry Verticals 2019 & 2032
- Table 11: Global Data Classification Market Revenue Million Forecast, by Region 2019 & 2032
- Table 12: Global Data Classification Market Volume K Unit Forecast, by Region 2019 & 2032
- Table 13: Global Data Classification Market Revenue Million Forecast, by Country 2019 & 2032
- Table 14: Global Data Classification Market Volume K Unit Forecast, by Country 2019 & 2032
- Table 15: United States Data Classification Market Revenue (Million) Forecast, by Application 2019 & 2032
- Table 16: United States Data Classification Market Volume (K Unit) Forecast, by Application 2019 & 2032
- Table 17: Canada Data Classification Market Revenue (Million) Forecast, by Application 2019 & 2032
- Table 18: Canada Data Classification Market Volume (K Unit) Forecast, by Application 2019 & 2032
- Table 19: Mexico Data Classification Market Revenue (Million) Forecast, by Application 2019 & 2032
- Table 20: Mexico Data Classification Market Volume (K Unit) Forecast, by Application 2019 & 2032
- Table 21: Global Data Classification Market Revenue Million Forecast, by Country 2019 & 2032
- Table 22: Global Data Classification Market Volume K Unit Forecast, by Country 2019 & 2032
- Table 23: Germany Data Classification Market Revenue (Million) Forecast, by Application 2019 & 2032
- Table 24: Germany Data Classification Market Volume (K Unit) Forecast, by Application 2019 & 2032
- Table 25: United Kingdom Data Classification Market Revenue (Million) Forecast, by Application 2019 & 2032
- Table 26: United Kingdom Data Classification Market Volume (K Unit) Forecast, by Application 2019 & 2032
- Table 27: France Data Classification Market Revenue (Million) Forecast, by Application 2019 & 2032
- Table 28: France Data Classification Market Volume (K Unit) Forecast, by Application 2019 & 2032
- Table 29: Spain Data Classification Market Revenue (Million) Forecast, by Application 2019 & 2032
- Table 30: Spain Data Classification Market Volume (K Unit) Forecast, by Application 2019 & 2032
- Table 31: Italy Data Classification Market Revenue (Million) Forecast, by Application 2019 & 2032
- Table 32: Italy Data Classification Market Volume (K Unit) Forecast, by Application 2019 & 2032
- Table 33: Spain Data Classification Market Revenue (Million) Forecast, by Application 2019 & 2032
- Table 34: Spain Data Classification Market Volume (K Unit) Forecast, by Application 2019 & 2032
- Table 35: Belgium Data Classification Market Revenue (Million) Forecast, by Application 2019 & 2032
- Table 36: Belgium Data Classification Market Volume (K Unit) Forecast, by Application 2019 & 2032
- Table 37: Netherland Data Classification Market Revenue (Million) Forecast, by Application 2019 & 2032
- Table 38: Netherland Data Classification Market Volume (K Unit) Forecast, by Application 2019 & 2032
- Table 39: Nordics Data Classification Market Revenue (Million) Forecast, by Application 2019 & 2032
- Table 40: Nordics Data Classification Market Volume (K Unit) Forecast, by Application 2019 & 2032
- Table 41: Rest of Europe Data Classification Market Revenue (Million) Forecast, by Application 2019 & 2032
- Table 42: Rest of Europe Data Classification Market Volume (K Unit) Forecast, by Application 2019 & 2032
- Table 43: Global Data Classification Market Revenue Million Forecast, by Country 2019 & 2032
- Table 44: Global Data Classification Market Volume K Unit Forecast, by Country 2019 & 2032
- Table 45: China Data Classification Market Revenue (Million) Forecast, by Application 2019 & 2032
- Table 46: China Data Classification Market Volume (K Unit) Forecast, by Application 2019 & 2032
- Table 47: Japan Data Classification Market Revenue (Million) Forecast, by Application 2019 & 2032
- Table 48: Japan Data Classification Market Volume (K Unit) Forecast, by Application 2019 & 2032
- Table 49: India Data Classification Market Revenue (Million) Forecast, by Application 2019 & 2032
- Table 50: India Data Classification Market Volume (K Unit) Forecast, by Application 2019 & 2032
- Table 51: South Korea Data Classification Market Revenue (Million) Forecast, by Application 2019 & 2032
- Table 52: South Korea Data Classification Market Volume (K Unit) Forecast, by Application 2019 & 2032
- Table 53: Southeast Asia Data Classification Market Revenue (Million) Forecast, by Application 2019 & 2032
- Table 54: Southeast Asia Data Classification Market Volume (K Unit) Forecast, by Application 2019 & 2032
- Table 55: Australia Data Classification Market Revenue (Million) Forecast, by Application 2019 & 2032
- Table 56: Australia Data Classification Market Volume (K Unit) Forecast, by Application 2019 & 2032
- Table 57: Indonesia Data Classification Market Revenue (Million) Forecast, by Application 2019 & 2032
- Table 58: Indonesia Data Classification Market Volume (K Unit) Forecast, by Application 2019 & 2032
- Table 59: Phillipes Data Classification Market Revenue (Million) Forecast, by Application 2019 & 2032
- Table 60: Phillipes Data Classification Market Volume (K Unit) Forecast, by Application 2019 & 2032
- Table 61: Singapore Data Classification Market Revenue (Million) Forecast, by Application 2019 & 2032
- Table 62: Singapore Data Classification Market Volume (K Unit) Forecast, by Application 2019 & 2032
- Table 63: Thailandc Data Classification Market Revenue (Million) Forecast, by Application 2019 & 2032
- Table 64: Thailandc Data Classification Market Volume (K Unit) Forecast, by Application 2019 & 2032
- Table 65: Rest of Asia Pacific Data Classification Market Revenue (Million) Forecast, by Application 2019 & 2032
- Table 66: Rest of Asia Pacific Data Classification Market Volume (K Unit) Forecast, by Application 2019 & 2032
- Table 67: Global Data Classification Market Revenue Million Forecast, by Country 2019 & 2032
- Table 68: Global Data Classification Market Volume K Unit Forecast, by Country 2019 & 2032
- Table 69: Brazil Data Classification Market Revenue (Million) Forecast, by Application 2019 & 2032
- Table 70: Brazil Data Classification Market Volume (K Unit) Forecast, by Application 2019 & 2032
- Table 71: Argentina Data Classification Market Revenue (Million) Forecast, by Application 2019 & 2032
- Table 72: Argentina Data Classification Market Volume (K Unit) Forecast, by Application 2019 & 2032
- Table 73: Peru Data Classification Market Revenue (Million) Forecast, by Application 2019 & 2032
- Table 74: Peru Data Classification Market Volume (K Unit) Forecast, by Application 2019 & 2032
- Table 75: Chile Data Classification Market Revenue (Million) Forecast, by Application 2019 & 2032
- Table 76: Chile Data Classification Market Volume (K Unit) Forecast, by Application 2019 & 2032
- Table 77: Colombia Data Classification Market Revenue (Million) Forecast, by Application 2019 & 2032
- Table 78: Colombia Data Classification Market Volume (K Unit) Forecast, by Application 2019 & 2032
- Table 79: Ecuador Data Classification Market Revenue (Million) Forecast, by Application 2019 & 2032
- Table 80: Ecuador Data Classification Market Volume (K Unit) Forecast, by Application 2019 & 2032
- Table 81: Venezuela Data Classification Market Revenue (Million) Forecast, by Application 2019 & 2032
- Table 82: Venezuela Data Classification Market Volume (K Unit) Forecast, by Application 2019 & 2032
- Table 83: Rest of South America Data Classification Market Revenue (Million) Forecast, by Application 2019 & 2032
- Table 84: Rest of South America Data Classification Market Volume (K Unit) Forecast, by Application 2019 & 2032
- Table 85: Global Data Classification Market Revenue Million Forecast, by Country 2019 & 2032
- Table 86: Global Data Classification Market Volume K Unit Forecast, by Country 2019 & 2032
- Table 87: United States Data Classification Market Revenue (Million) Forecast, by Application 2019 & 2032
- Table 88: United States Data Classification Market Volume (K Unit) Forecast, by Application 2019 & 2032
- Table 89: Canada Data Classification Market Revenue (Million) Forecast, by Application 2019 & 2032
- Table 90: Canada Data Classification Market Volume (K Unit) Forecast, by Application 2019 & 2032
- Table 91: Mexico Data Classification Market Revenue (Million) Forecast, by Application 2019 & 2032
- Table 92: Mexico Data Classification Market Volume (K Unit) Forecast, by Application 2019 & 2032
- Table 93: Global Data Classification Market Revenue Million Forecast, by Country 2019 & 2032
- Table 94: Global Data Classification Market Volume K Unit Forecast, by Country 2019 & 2032
- Table 95: United Arab Emirates Data Classification Market Revenue (Million) Forecast, by Application 2019 & 2032
- Table 96: United Arab Emirates Data Classification Market Volume (K Unit) Forecast, by Application 2019 & 2032
- Table 97: Saudi Arabia Data Classification Market Revenue (Million) Forecast, by Application 2019 & 2032
- Table 98: Saudi Arabia Data Classification Market Volume (K Unit) Forecast, by Application 2019 & 2032
- Table 99: South Africa Data Classification Market Revenue (Million) Forecast, by Application 2019 & 2032
- Table 100: South Africa Data Classification Market Volume (K Unit) Forecast, by Application 2019 & 2032
- Table 101: Rest of Middle East and Africa Data Classification Market Revenue (Million) Forecast, by Application 2019 & 2032
- Table 102: Rest of Middle East and Africa Data Classification Market Volume (K Unit) Forecast, by Application 2019 & 2032
- Table 103: Global Data Classification Market Revenue Million Forecast, by Solution 2019 & 2032
- Table 104: Global Data Classification Market Volume K Unit Forecast, by Solution 2019 & 2032
- Table 105: Global Data Classification Market Revenue Million Forecast, by Deployment 2019 & 2032
- Table 106: Global Data Classification Market Volume K Unit Forecast, by Deployment 2019 & 2032
- Table 107: Global Data Classification Market Revenue Million Forecast, by Application 2019 & 2032
- Table 108: Global Data Classification Market Volume K Unit Forecast, by Application 2019 & 2032
- Table 109: Global Data Classification Market Revenue Million Forecast, by Industry Verticals 2019 & 2032
- Table 110: Global Data Classification Market Volume K Unit Forecast, by Industry Verticals 2019 & 2032
- Table 111: Global Data Classification Market Revenue Million Forecast, by Country 2019 & 2032
- Table 112: Global Data Classification Market Volume K Unit Forecast, by Country 2019 & 2032
- Table 113: United States Data Classification Market Revenue (Million) Forecast, by Application 2019 & 2032
- Table 114: United States Data Classification Market Volume (K Unit) Forecast, by Application 2019 & 2032
- Table 115: Canada Data Classification Market Revenue (Million) Forecast, by Application 2019 & 2032
- Table 116: Canada Data Classification Market Volume (K Unit) Forecast, by Application 2019 & 2032
- Table 117: Global Data Classification Market Revenue Million Forecast, by Solution 2019 & 2032
- Table 118: Global Data Classification Market Volume K Unit Forecast, by Solution 2019 & 2032
- Table 119: Global Data Classification Market Revenue Million Forecast, by Deployment 2019 & 2032
- Table 120: Global Data Classification Market Volume K Unit Forecast, by Deployment 2019 & 2032
- Table 121: Global Data Classification Market Revenue Million Forecast, by Application 2019 & 2032
- Table 122: Global Data Classification Market Volume K Unit Forecast, by Application 2019 & 2032
- Table 123: Global Data Classification Market Revenue Million Forecast, by Industry Verticals 2019 & 2032
- Table 124: Global Data Classification Market Volume K Unit Forecast, by Industry Verticals 2019 & 2032
- Table 125: Global Data Classification Market Revenue Million Forecast, by Country 2019 & 2032
- Table 126: Global Data Classification Market Volume K Unit Forecast, by Country 2019 & 2032
- Table 127: United Kingdom Data Classification Market Revenue (Million) Forecast, by Application 2019 & 2032
- Table 128: United Kingdom Data Classification Market Volume (K Unit) Forecast, by Application 2019 & 2032
- Table 129: Germany Data Classification Market Revenue (Million) Forecast, by Application 2019 & 2032
- Table 130: Germany Data Classification Market Volume (K Unit) Forecast, by Application 2019 & 2032
- Table 131: France Data Classification Market Revenue (Million) Forecast, by Application 2019 & 2032
- Table 132: France Data Classification Market Volume (K Unit) Forecast, by Application 2019 & 2032
- Table 133: Rest of Europe Data Classification Market Revenue (Million) Forecast, by Application 2019 & 2032
- Table 134: Rest of Europe Data Classification Market Volume (K Unit) Forecast, by Application 2019 & 2032
- Table 135: Global Data Classification Market Revenue Million Forecast, by Solution 2019 & 2032
- Table 136: Global Data Classification Market Volume K Unit Forecast, by Solution 2019 & 2032
- Table 137: Global Data Classification Market Revenue Million Forecast, by Deployment 2019 & 2032
- Table 138: Global Data Classification Market Volume K Unit Forecast, by Deployment 2019 & 2032
- Table 139: Global Data Classification Market Revenue Million Forecast, by Application 2019 & 2032
- Table 140: Global Data Classification Market Volume K Unit Forecast, by Application 2019 & 2032
- Table 141: Global Data Classification Market Revenue Million Forecast, by Industry Verticals 2019 & 2032
- Table 142: Global Data Classification Market Volume K Unit Forecast, by Industry Verticals 2019 & 2032
- Table 143: Global Data Classification Market Revenue Million Forecast, by Country 2019 & 2032
- Table 144: Global Data Classification Market Volume K Unit Forecast, by Country 2019 & 2032
- Table 145: China Data Classification Market Revenue (Million) Forecast, by Application 2019 & 2032
- Table 146: China Data Classification Market Volume (K Unit) Forecast, by Application 2019 & 2032
- Table 147: Japan Data Classification Market Revenue (Million) Forecast, by Application 2019 & 2032
- Table 148: Japan Data Classification Market Volume (K Unit) Forecast, by Application 2019 & 2032
- Table 149: India Data Classification Market Revenue (Million) Forecast, by Application 2019 & 2032
- Table 150: India Data Classification Market Volume (K Unit) Forecast, by Application 2019 & 2032
- Table 151: Rest of Asia Pacific Data Classification Market Revenue (Million) Forecast, by Application 2019 & 2032
- Table 152: Rest of Asia Pacific Data Classification Market Volume (K Unit) Forecast, by Application 2019 & 2032
- Table 153: Global Data Classification Market Revenue Million Forecast, by Solution 2019 & 2032
- Table 154: Global Data Classification Market Volume K Unit Forecast, by Solution 2019 & 2032
- Table 155: Global Data Classification Market Revenue Million Forecast, by Deployment 2019 & 2032
- Table 156: Global Data Classification Market Volume K Unit Forecast, by Deployment 2019 & 2032
- Table 157: Global Data Classification Market Revenue Million Forecast, by Application 2019 & 2032
- Table 158: Global Data Classification Market Volume K Unit Forecast, by Application 2019 & 2032
- Table 159: Global Data Classification Market Revenue Million Forecast, by Industry Verticals 2019 & 2032
- Table 160: Global Data Classification Market Volume K Unit Forecast, by Industry Verticals 2019 & 2032
- Table 161: Global Data Classification Market Revenue Million Forecast, by Country 2019 & 2032
- Table 162: Global Data Classification Market Volume K Unit Forecast, by Country 2019 & 2032
- Table 163: Latin America Data Classification Market Revenue (Million) Forecast, by Application 2019 & 2032
- Table 164: Latin America Data Classification Market Volume (K Unit) Forecast, by Application 2019 & 2032
- Table 165: Middle East Data Classification Market Revenue (Million) Forecast, by Application 2019 & 2032
- Table 166: Middle East Data Classification Market Volume (K Unit) Forecast, by Application 2019 & 2032
Frequently Asked Questions
1. What is the projected Compound Annual Growth Rate (CAGR) of the Data Classification Market?
The projected CAGR is approximately 24.00%.
2. Which companies are prominent players in the Data Classification Market?
Key companies in the market include IBM Corporation, Broadcom Inc (Symantec Corporation), Microsoft Corporation, Boldon James Ltd (QinetiQ), SECLORE, Amazon Web Services Inc, Digital Guardian, Open Text Corporation, HANDD Business Solutions, Covata Limited.
3. What are the main segments of the Data Classification Market?
The market segments include Solution, Deployment, Application, Industry Verticals.
4. Can you provide details about the market size?
The market size is estimated to be USD XX Million as of 2022.
5. What are some drivers contributing to market growth?
; Government Regulations and Compliance for Privacy & Data Security; Concern for Data Theft due to Mismanagement; Surge in Analytics Applications with Stored Data.
6. What are the notable trends driving market growth?
Surge in Data Security Solutions for Increased Malware Infection Rates in Computers.
7. Are there any restraints impacting market growth?
Limited Efficiency Compared to Shared Hosting. Dedicated Hosting. and Cloud Servers.
8. Can you provide examples of recent developments in the market?
N/A
9. What pricing options are available for accessing the report?
Pricing options include single-user, multi-user, and enterprise licenses priced at USD 4750, USD 5250, and USD 8750 respectively.
10. Is the market size provided in terms of value or volume?
The market size is provided in terms of value, measured in Million and volume, measured in K Unit.
11. Are there any specific market keywords associated with the report?
Yes, the market keyword associated with the report is "Data Classification Market," which aids in identifying and referencing the specific market segment covered.
12. How do I determine which pricing option suits my needs best?
The pricing options vary based on user requirements and access needs. Individual users may opt for single-user licenses, while businesses requiring broader access may choose multi-user or enterprise licenses for cost-effective access to the report.
13. Are there any additional resources or data provided in the Data Classification Market report?
While the report offers comprehensive insights, it's advisable to review the specific contents or supplementary materials provided to ascertain if additional resources or data are available.
14. How can I stay updated on further developments or reports in the Data Classification Market?
To stay informed about further developments, trends, and reports in the Data Classification Market, consider subscribing to industry newsletters, following relevant companies and organizations, or regularly checking reputable industry news sources and publications.
Methodology
Step 1 - Identification of Relevant Samples Size from Population Database


Step 2 - Approaches for Defining Global Market Size (Value, Volume* & Price*)

Note*: In applicable scenarios
Step 3 - Data Sources
Primary Research
- Web Analytics
- Survey Reports
- Research Institute
- Latest Research Reports
- Opinion Leaders
Secondary Research
- Annual Reports
- White Paper
- Latest Press Release
- Industry Association
- Paid Database
- Investor Presentations

Step 4 - Data Triangulation
Involves using different sources of information in order to increase the validity of a study
These sources are likely to be stakeholders in a program - participants, other researchers, program staff, other community members, and so on.
Then we put all data in single framework & apply various statistical tools to find out the dynamic on the market.
During the analysis stage, feedback from the stakeholder groups would be compared to determine areas of agreement as well as areas of divergence


