
Key Insights
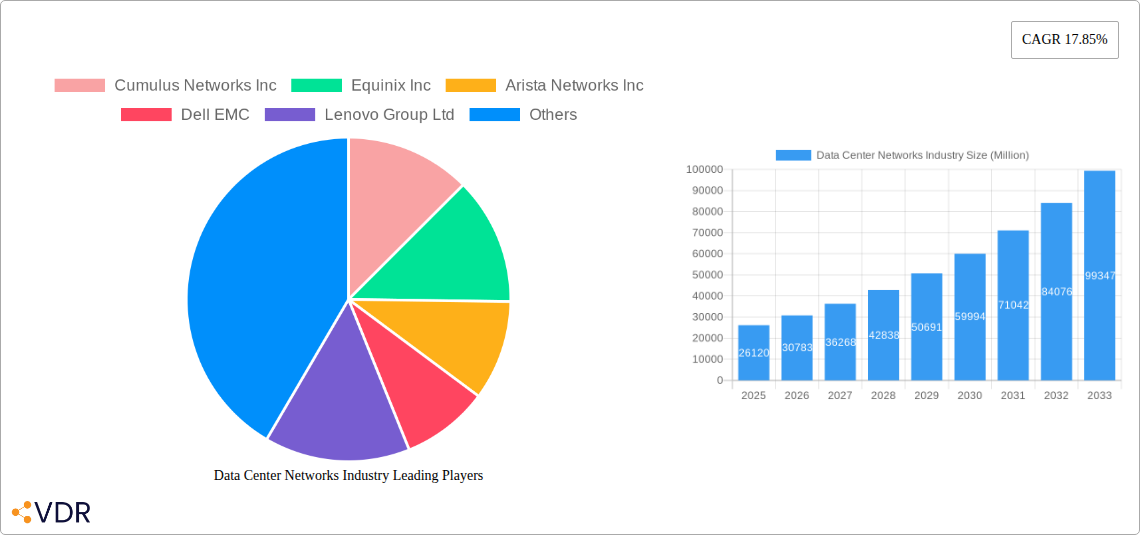
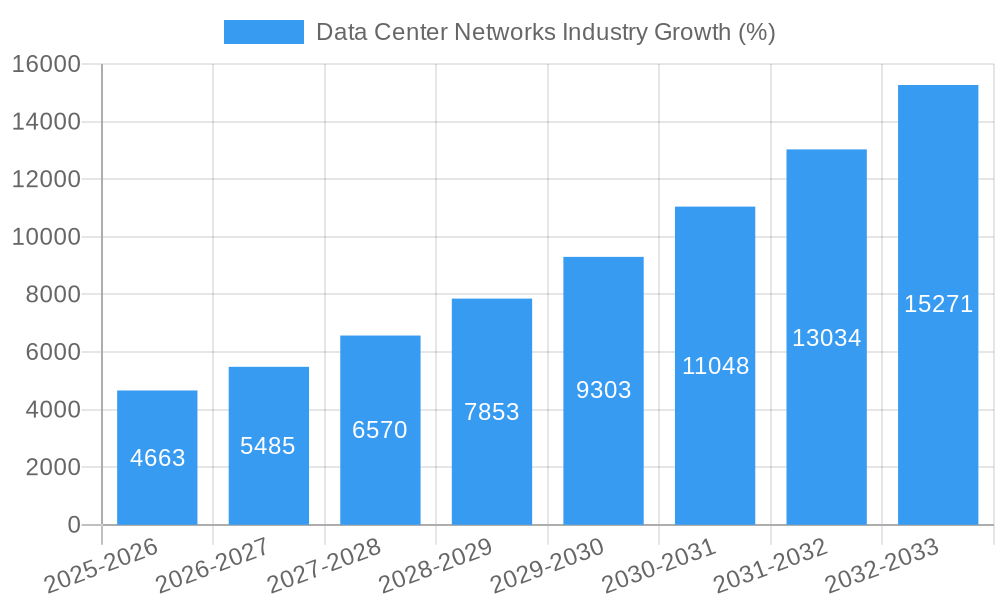
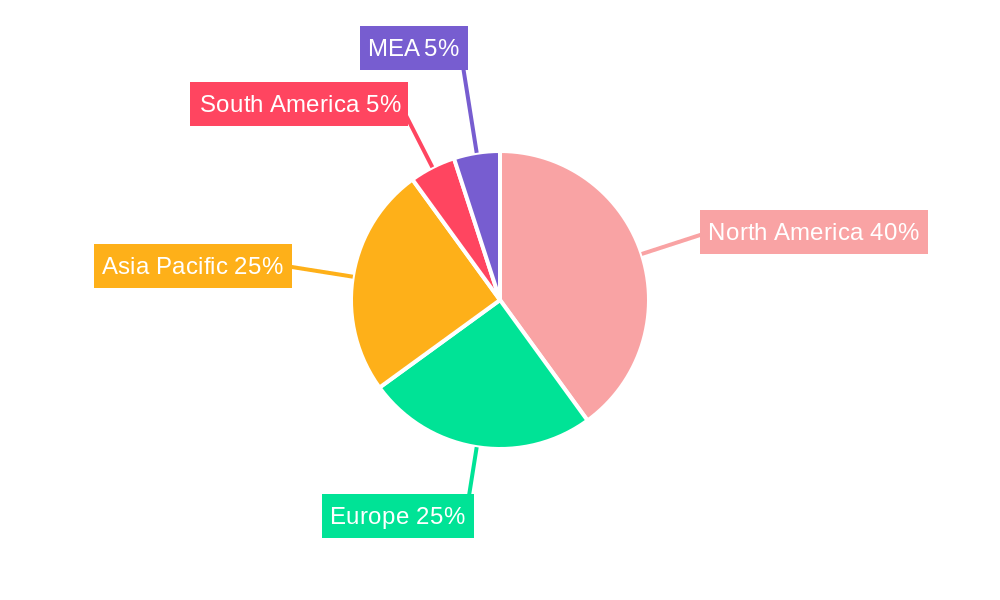
The Data Center Networks market, valued at $26.12 billion in 2025, is experiencing robust growth, projected to expand at a Compound Annual Growth Rate (CAGR) of 17.85% from 2025 to 2033. This significant expansion is driven by several key factors. The increasing adoption of cloud computing and the proliferation of big data initiatives are fueling demand for high-bandwidth, low-latency network infrastructure. Furthermore, the ongoing digital transformation across various sectors, including BFSI (Banking, Financial Services, and Insurance), healthcare, and retail, is significantly boosting investment in advanced data center networking solutions. The rising need for enhanced security and improved network management capabilities is also contributing to market growth. Key segments driving this growth include Ethernet switches, which remain the dominant product category, followed by Storage Area Networks (SANs) and routers. Geographically, North America currently holds a substantial market share, attributed to the high concentration of data centers and early adoption of advanced technologies. However, the Asia-Pacific region is projected to witness the fastest growth due to rapid economic development and increasing digitalization across emerging economies like India and China.
Despite the optimistic outlook, the market faces some challenges. High initial investment costs associated with deploying advanced data center networking technologies can act as a restraint, particularly for small and medium-sized enterprises. Furthermore, the complexity of managing and maintaining these sophisticated networks presents an operational hurdle. However, the continuous innovation in areas such as software-defined networking (SDN) and network function virtualization (NFV) is expected to mitigate these challenges and unlock further growth opportunities. Competition among established players like Cisco, Juniper, and Arista, as well as emerging vendors offering innovative solutions, is intense, driving innovation and price competitiveness. The market is poised for continued expansion, fueled by ongoing technological advancements and the unwavering demand for robust and scalable data center networking infrastructure to support the ever-growing digital landscape.
Data Center Networks Industry Market Report: 2019-2033
This comprehensive report provides an in-depth analysis of the Data Center Networks industry, encompassing market dynamics, growth trends, regional dominance, product landscape, key players, and future outlook. The study period covers 2019-2033, with 2025 as the base and estimated year. The forecast period spans 2025-2033, and the historical period covers 2019-2024. The report examines both parent and child markets, including key segments like Ethernet Switches, Storage Area Networks, Routers, and other products, across various end-user verticals such as BFSI, Healthcare, Retail, Government, and others. The total market value in 2025 is estimated to be xx Million.
Data Center Networks Industry Market Dynamics & Structure
The Data Center Networks market is characterized by a moderately consolidated structure with a few dominant players and several niche players. Technological innovation, particularly in areas like software-defined networking (SDN) and network function virtualization (NFV), is a key driver. Regulatory frameworks concerning data privacy and security significantly influence market dynamics. Competitive product substitutes, such as cloud-based networking services, pose a challenge to traditional hardware vendors. The end-user demographics are diverse, with a growing demand from cloud providers and large enterprises. M&A activity remains relatively high, reflecting consolidation within the industry. The market share of the top 5 players is estimated at xx%.
- Market Concentration: Moderately consolidated, with top players holding xx% market share in 2025.
- Technological Innovation: SDN, NFV, and AI-driven network management are key drivers.
- Regulatory Landscape: Data privacy regulations (e.g., GDPR) influence vendor strategies.
- Competitive Substitutes: Cloud-based networking solutions are emerging as competitors.
- M&A Activity: Significant M&A activity observed in the historical period, with xx deals recorded between 2019 and 2024.
- Innovation Barriers: High initial investment costs for R&D and integration complexities.
Data Center Networks Industry Growth Trends & Insights
The Data Center Networks market experienced significant growth during the historical period (2019-2024), driven by the increasing adoption of cloud computing, big data analytics, and the Internet of Things (IoT). The market size has expanded from xx Million in 2019 to xx Million in 2024, exhibiting a CAGR of xx%. The adoption rate of advanced networking technologies, such as SDN and NFV, is accelerating, while the shift toward software-defined data centers further fuels market growth. Consumer behavior is marked by increasing demand for higher bandwidth, lower latency, and enhanced security. Technological disruptions, such as the emergence of 5G and edge computing, are expected to create new opportunities for growth. The market is projected to reach xx Million by 2033, exhibiting a CAGR of xx% during the forecast period (2025-2033). Market penetration in key segments is expected to increase from xx% in 2025 to xx% by 2033.
Dominant Regions, Countries, or Segments in Data Center Networks Industry
North America and Europe currently hold the largest market share in the Data Center Networks industry, driven by strong technological advancements, high adoption rates, and the presence of major data center hubs. Within product segments, Ethernet Switches dominate the market, followed by Routers and Storage Area Networks. The BFSI and Healthcare sectors are leading end-user verticals, driven by their high dependence on reliable and secure data center infrastructure. Asia Pacific is anticipated to exhibit significant growth in the forecast period, supported by robust economic growth and increasing investments in digital infrastructure.
- Leading Region: North America
- Key Drivers (North America): Strong presence of hyperscale data centers, technological innovation, and high investment in IT infrastructure.
- Key Drivers (Europe): Growing adoption of cloud services and stringent data privacy regulations.
- Key Drivers (Asia Pacific): Rapid economic development and increasing digitalization.
- Leading Segment (Product): Ethernet Switches – driving growth due to widespread adoption and ongoing improvements in performance and features.
- Leading Segment (End-user): BFSI – characterized by stringent security needs and high data traffic.
Data Center Networks Industry Product Landscape
The Data Center Networks product landscape is characterized by a wide range of products, including high-performance Ethernet switches, advanced routers, and sophisticated storage area networks. Recent innovations include increased port density, improved energy efficiency, and advanced security features. Products are tailored to specific applications, ranging from high-performance computing to cloud-based services. Key features include advanced QoS, intelligent traffic management, and automated network provisioning. Unique selling propositions often focus on speed, scalability, and resilience.
Key Drivers, Barriers & Challenges in Data Center Networks Industry
Key Drivers: The increasing adoption of cloud computing, big data analytics, and IoT applications is driving the demand for robust and scalable data center networks. Furthermore, the rise of 5G and edge computing is creating new opportunities for growth. Government initiatives promoting digital transformation are also positive factors.
Challenges: Supply chain disruptions, particularly concerning semiconductor components, pose a major challenge. Regulatory hurdles, such as data privacy regulations, impose compliance costs on vendors. Intense competition from established players and emerging startups exerts pressure on pricing and margins. The impact of these challenges is estimated to reduce market growth by xx% in 2026.
Emerging Opportunities in Data Center Networks Industry
Emerging opportunities include the expansion of 5G and edge computing, the growing adoption of AI and machine learning in network management, and the rise of software-defined data centers. Untapped markets exist in developing economies, and the increasing demand for enhanced network security creates new business opportunities. Developing tailored solutions for specific vertical markets (e.g., healthcare, manufacturing) presents promising avenues.
Growth Accelerators in the Data Center Networks Industry
Technological breakthroughs in areas such as 400GbE and 800GbE technologies are accelerating market expansion. Strategic partnerships between hardware and software vendors are fostering innovation and driving adoption. Market expansion strategies targeting emerging markets and untapped verticals contribute significantly to long-term growth prospects.
Key Players Shaping the Data Center Networks Industry Market
- Cumulus Networks Inc
- Equinix Inc
- Arista Networks Inc
- Dell EMC
- Lenovo Group Ltd
- Cisco Systems Inc
- Juniper Networks Inc
- Extreme Networks Inc
- NEC Corporation
- Big Switch Networks Inc
- Huawei Technologies Co Ltd
- H3C Holding Limited
- VMware Inc
Notable Milestones in Data Center Networks Industry Sector
- March 2023: Arista Networks launched the Arista WAN Routing System, modernizing wide area networks.
- March 2023: Cisco Systems Inc. expanded its data center footprint in Chennai, India, enhancing network access for Indian enterprises.
In-Depth Data Center Networks Industry Market Outlook
The Data Center Networks market is poised for continued growth, driven by sustained demand from cloud providers, enterprises, and government agencies. Strategic investments in advanced networking technologies and expansion into new markets offer significant opportunities. The market's future potential is strong, promising substantial returns for stakeholders. Companies that successfully adapt to evolving technological landscapes and focus on innovative solutions will secure competitive advantages.
Data Center Networks Industry Segmentation
-
1. Product
- 1.1. Ethernet Switches
- 1.2. Storage Area Network
- 1.3. Router
- 1.4. Other Products
-
2. End-user Vertical
- 2.1. BFSI
- 2.2. Healthcare
- 2.3. Retail
- 2.4. Government
- 2.5. Other End-user Verticals
Data Center Networks Industry Segmentation By Geography
-
1. North America
- 1.1. United States
- 1.2. Canada
-
2. Europe
- 2.1. Germany
- 2.2. United Kingdom
- 2.3. Rest of Europe
-
3. Asia Pacific
- 3.1. China
- 3.2. India
- 3.3. Rest of Asia Pacific
- 4. Latin America
- 5. Middle East
Data Center Networks Industry REPORT HIGHLIGHTS
| Aspects | Details |
|---|---|
| Study Period | 2019-2033 |
| Base Year | 2024 |
| Estimated Year | 2025 |
| Forecast Period | 2025-2033 |
| Historical Period | 2019-2024 |
| Growth Rate | CAGR of 17.85% from 2019-2033 |
| Segmentation |
|
Table of Contents
- 1. Introduction
- 1.1. Research Scope
- 1.2. Market Segmentation
- 1.3. Research Methodology
- 1.4. Definitions and Assumptions
- 2. Executive Summary
- 2.1. Introduction
- 3. Market Dynamics
- 3.1. Introduction
- 3.2. Market Drivers
- 3.2.1. Increasing Utilization of Cloud Storage is Driving the Market Growth; Rising Need for Backup and Storage is Expanding the Market Demand; The Growth in Retail and E-Commerce is Anticipated to Drive the Market Demand
- 3.3. Market Restrains
- 3.3.1. Lack of Skilled Professionals is Hindering the Market Demand
- 3.4. Market Trends
- 3.4.1. The Growth in Retail and E-Commerce is Anticipated to Drive the Market Demand
- 4. Market Factor Analysis
- 4.1. Porters Five Forces
- 4.2. Supply/Value Chain
- 4.3. PESTEL analysis
- 4.4. Market Entropy
- 4.5. Patent/Trademark Analysis
- 5. Global Data Center Networks Industry Analysis, Insights and Forecast, 2019-2031
- 5.1. Market Analysis, Insights and Forecast - by Product
- 5.1.1. Ethernet Switches
- 5.1.2. Storage Area Network
- 5.1.3. Router
- 5.1.4. Other Products
- 5.2. Market Analysis, Insights and Forecast - by End-user Vertical
- 5.2.1. BFSI
- 5.2.2. Healthcare
- 5.2.3. Retail
- 5.2.4. Government
- 5.2.5. Other End-user Verticals
- 5.3. Market Analysis, Insights and Forecast - by Region
- 5.3.1. North America
- 5.3.2. Europe
- 5.3.3. Asia Pacific
- 5.3.4. Latin America
- 5.3.5. Middle East
- 5.1. Market Analysis, Insights and Forecast - by Product
- 6. North America Data Center Networks Industry Analysis, Insights and Forecast, 2019-2031
- 6.1. Market Analysis, Insights and Forecast - by Product
- 6.1.1. Ethernet Switches
- 6.1.2. Storage Area Network
- 6.1.3. Router
- 6.1.4. Other Products
- 6.2. Market Analysis, Insights and Forecast - by End-user Vertical
- 6.2.1. BFSI
- 6.2.2. Healthcare
- 6.2.3. Retail
- 6.2.4. Government
- 6.2.5. Other End-user Verticals
- 6.1. Market Analysis, Insights and Forecast - by Product
- 7. Europe Data Center Networks Industry Analysis, Insights and Forecast, 2019-2031
- 7.1. Market Analysis, Insights and Forecast - by Product
- 7.1.1. Ethernet Switches
- 7.1.2. Storage Area Network
- 7.1.3. Router
- 7.1.4. Other Products
- 7.2. Market Analysis, Insights and Forecast - by End-user Vertical
- 7.2.1. BFSI
- 7.2.2. Healthcare
- 7.2.3. Retail
- 7.2.4. Government
- 7.2.5. Other End-user Verticals
- 7.1. Market Analysis, Insights and Forecast - by Product
- 8. Asia Pacific Data Center Networks Industry Analysis, Insights and Forecast, 2019-2031
- 8.1. Market Analysis, Insights and Forecast - by Product
- 8.1.1. Ethernet Switches
- 8.1.2. Storage Area Network
- 8.1.3. Router
- 8.1.4. Other Products
- 8.2. Market Analysis, Insights and Forecast - by End-user Vertical
- 8.2.1. BFSI
- 8.2.2. Healthcare
- 8.2.3. Retail
- 8.2.4. Government
- 8.2.5. Other End-user Verticals
- 8.1. Market Analysis, Insights and Forecast - by Product
- 9. Latin America Data Center Networks Industry Analysis, Insights and Forecast, 2019-2031
- 9.1. Market Analysis, Insights and Forecast - by Product
- 9.1.1. Ethernet Switches
- 9.1.2. Storage Area Network
- 9.1.3. Router
- 9.1.4. Other Products
- 9.2. Market Analysis, Insights and Forecast - by End-user Vertical
- 9.2.1. BFSI
- 9.2.2. Healthcare
- 9.2.3. Retail
- 9.2.4. Government
- 9.2.5. Other End-user Verticals
- 9.1. Market Analysis, Insights and Forecast - by Product
- 10. Middle East Data Center Networks Industry Analysis, Insights and Forecast, 2019-2031
- 10.1. Market Analysis, Insights and Forecast - by Product
- 10.1.1. Ethernet Switches
- 10.1.2. Storage Area Network
- 10.1.3. Router
- 10.1.4. Other Products
- 10.2. Market Analysis, Insights and Forecast - by End-user Vertical
- 10.2.1. BFSI
- 10.2.2. Healthcare
- 10.2.3. Retail
- 10.2.4. Government
- 10.2.5. Other End-user Verticals
- 10.1. Market Analysis, Insights and Forecast - by Product
- 11. North America Data Center Networks Industry Analysis, Insights and Forecast, 2019-2031
- 11.1. Market Analysis, Insights and Forecast - By Country/Sub-region
- 11.1.1 United States
- 11.1.2 Canada
- 11.1.3 Mexico
- 12. Europe Data Center Networks Industry Analysis, Insights and Forecast, 2019-2031
- 12.1. Market Analysis, Insights and Forecast - By Country/Sub-region
- 12.1.1 Germany
- 12.1.2 United Kingdom
- 12.1.3 France
- 12.1.4 Spain
- 12.1.5 Italy
- 12.1.6 Spain
- 12.1.7 Belgium
- 12.1.8 Netherland
- 12.1.9 Nordics
- 12.1.10 Rest of Europe
- 13. Asia Pacific Data Center Networks Industry Analysis, Insights and Forecast, 2019-2031
- 13.1. Market Analysis, Insights and Forecast - By Country/Sub-region
- 13.1.1 China
- 13.1.2 Japan
- 13.1.3 India
- 13.1.4 South Korea
- 13.1.5 Southeast Asia
- 13.1.6 Australia
- 13.1.7 Indonesia
- 13.1.8 Phillipes
- 13.1.9 Singapore
- 13.1.10 Thailandc
- 13.1.11 Rest of Asia Pacific
- 14. South America Data Center Networks Industry Analysis, Insights and Forecast, 2019-2031
- 14.1. Market Analysis, Insights and Forecast - By Country/Sub-region
- 14.1.1 Brazil
- 14.1.2 Argentina
- 14.1.3 Peru
- 14.1.4 Chile
- 14.1.5 Colombia
- 14.1.6 Ecuador
- 14.1.7 Venezuela
- 14.1.8 Rest of South America
- 15. North America Data Center Networks Industry Analysis, Insights and Forecast, 2019-2031
- 15.1. Market Analysis, Insights and Forecast - By Country/Sub-region
- 15.1.1 United States
- 15.1.2 Canada
- 15.1.3 Mexico
- 16. MEA Data Center Networks Industry Analysis, Insights and Forecast, 2019-2031
- 16.1. Market Analysis, Insights and Forecast - By Country/Sub-region
- 16.1.1 United Arab Emirates
- 16.1.2 Saudi Arabia
- 16.1.3 South Africa
- 16.1.4 Rest of Middle East and Africa
- 17. Competitive Analysis
- 17.1. Global Market Share Analysis 2024
- 17.2. Company Profiles
- 17.2.1 Cumulus Networks Inc
- 17.2.1.1. Overview
- 17.2.1.2. Products
- 17.2.1.3. SWOT Analysis
- 17.2.1.4. Recent Developments
- 17.2.1.5. Financials (Based on Availability)
- 17.2.2 Equinix Inc
- 17.2.2.1. Overview
- 17.2.2.2. Products
- 17.2.2.3. SWOT Analysis
- 17.2.2.4. Recent Developments
- 17.2.2.5. Financials (Based on Availability)
- 17.2.3 Arista Networks Inc
- 17.2.3.1. Overview
- 17.2.3.2. Products
- 17.2.3.3. SWOT Analysis
- 17.2.3.4. Recent Developments
- 17.2.3.5. Financials (Based on Availability)
- 17.2.4 Dell EMC
- 17.2.4.1. Overview
- 17.2.4.2. Products
- 17.2.4.3. SWOT Analysis
- 17.2.4.4. Recent Developments
- 17.2.4.5. Financials (Based on Availability)
- 17.2.5 Lenovo Group Ltd
- 17.2.5.1. Overview
- 17.2.5.2. Products
- 17.2.5.3. SWOT Analysis
- 17.2.5.4. Recent Developments
- 17.2.5.5. Financials (Based on Availability)
- 17.2.6 Cisco Systems Inc
- 17.2.6.1. Overview
- 17.2.6.2. Products
- 17.2.6.3. SWOT Analysis
- 17.2.6.4. Recent Developments
- 17.2.6.5. Financials (Based on Availability)
- 17.2.7 Juniper Networks Inc
- 17.2.7.1. Overview
- 17.2.7.2. Products
- 17.2.7.3. SWOT Analysis
- 17.2.7.4. Recent Developments
- 17.2.7.5. Financials (Based on Availability)
- 17.2.8 Extreme Networks Inc
- 17.2.8.1. Overview
- 17.2.8.2. Products
- 17.2.8.3. SWOT Analysis
- 17.2.8.4. Recent Developments
- 17.2.8.5. Financials (Based on Availability)
- 17.2.9 NEC Corporation
- 17.2.9.1. Overview
- 17.2.9.2. Products
- 17.2.9.3. SWOT Analysis
- 17.2.9.4. Recent Developments
- 17.2.9.5. Financials (Based on Availability)
- 17.2.10 Big Switch Networks Inc
- 17.2.10.1. Overview
- 17.2.10.2. Products
- 17.2.10.3. SWOT Analysis
- 17.2.10.4. Recent Developments
- 17.2.10.5. Financials (Based on Availability)
- 17.2.11 Huawei Technologies Co Ltd
- 17.2.11.1. Overview
- 17.2.11.2. Products
- 17.2.11.3. SWOT Analysis
- 17.2.11.4. Recent Developments
- 17.2.11.5. Financials (Based on Availability)
- 17.2.12 H3C Holding Limited
- 17.2.12.1. Overview
- 17.2.12.2. Products
- 17.2.12.3. SWOT Analysis
- 17.2.12.4. Recent Developments
- 17.2.12.5. Financials (Based on Availability)
- 17.2.13 VMware Inc
- 17.2.13.1. Overview
- 17.2.13.2. Products
- 17.2.13.3. SWOT Analysis
- 17.2.13.4. Recent Developments
- 17.2.13.5. Financials (Based on Availability)
- 17.2.1 Cumulus Networks Inc
List of Figures
- Figure 1: Global Data Center Networks Industry Revenue Breakdown (Million, %) by Region 2024 & 2032
- Figure 2: North America Data Center Networks Industry Revenue (Million), by Country 2024 & 2032
- Figure 3: North America Data Center Networks Industry Revenue Share (%), by Country 2024 & 2032
- Figure 4: Europe Data Center Networks Industry Revenue (Million), by Country 2024 & 2032
- Figure 5: Europe Data Center Networks Industry Revenue Share (%), by Country 2024 & 2032
- Figure 6: Asia Pacific Data Center Networks Industry Revenue (Million), by Country 2024 & 2032
- Figure 7: Asia Pacific Data Center Networks Industry Revenue Share (%), by Country 2024 & 2032
- Figure 8: South America Data Center Networks Industry Revenue (Million), by Country 2024 & 2032
- Figure 9: South America Data Center Networks Industry Revenue Share (%), by Country 2024 & 2032
- Figure 10: North America Data Center Networks Industry Revenue (Million), by Country 2024 & 2032
- Figure 11: North America Data Center Networks Industry Revenue Share (%), by Country 2024 & 2032
- Figure 12: MEA Data Center Networks Industry Revenue (Million), by Country 2024 & 2032
- Figure 13: MEA Data Center Networks Industry Revenue Share (%), by Country 2024 & 2032
- Figure 14: North America Data Center Networks Industry Revenue (Million), by Product 2024 & 2032
- Figure 15: North America Data Center Networks Industry Revenue Share (%), by Product 2024 & 2032
- Figure 16: North America Data Center Networks Industry Revenue (Million), by End-user Vertical 2024 & 2032
- Figure 17: North America Data Center Networks Industry Revenue Share (%), by End-user Vertical 2024 & 2032
- Figure 18: North America Data Center Networks Industry Revenue (Million), by Country 2024 & 2032
- Figure 19: North America Data Center Networks Industry Revenue Share (%), by Country 2024 & 2032
- Figure 20: Europe Data Center Networks Industry Revenue (Million), by Product 2024 & 2032
- Figure 21: Europe Data Center Networks Industry Revenue Share (%), by Product 2024 & 2032
- Figure 22: Europe Data Center Networks Industry Revenue (Million), by End-user Vertical 2024 & 2032
- Figure 23: Europe Data Center Networks Industry Revenue Share (%), by End-user Vertical 2024 & 2032
- Figure 24: Europe Data Center Networks Industry Revenue (Million), by Country 2024 & 2032
- Figure 25: Europe Data Center Networks Industry Revenue Share (%), by Country 2024 & 2032
- Figure 26: Asia Pacific Data Center Networks Industry Revenue (Million), by Product 2024 & 2032
- Figure 27: Asia Pacific Data Center Networks Industry Revenue Share (%), by Product 2024 & 2032
- Figure 28: Asia Pacific Data Center Networks Industry Revenue (Million), by End-user Vertical 2024 & 2032
- Figure 29: Asia Pacific Data Center Networks Industry Revenue Share (%), by End-user Vertical 2024 & 2032
- Figure 30: Asia Pacific Data Center Networks Industry Revenue (Million), by Country 2024 & 2032
- Figure 31: Asia Pacific Data Center Networks Industry Revenue Share (%), by Country 2024 & 2032
- Figure 32: Latin America Data Center Networks Industry Revenue (Million), by Product 2024 & 2032
- Figure 33: Latin America Data Center Networks Industry Revenue Share (%), by Product 2024 & 2032
- Figure 34: Latin America Data Center Networks Industry Revenue (Million), by End-user Vertical 2024 & 2032
- Figure 35: Latin America Data Center Networks Industry Revenue Share (%), by End-user Vertical 2024 & 2032
- Figure 36: Latin America Data Center Networks Industry Revenue (Million), by Country 2024 & 2032
- Figure 37: Latin America Data Center Networks Industry Revenue Share (%), by Country 2024 & 2032
- Figure 38: Middle East Data Center Networks Industry Revenue (Million), by Product 2024 & 2032
- Figure 39: Middle East Data Center Networks Industry Revenue Share (%), by Product 2024 & 2032
- Figure 40: Middle East Data Center Networks Industry Revenue (Million), by End-user Vertical 2024 & 2032
- Figure 41: Middle East Data Center Networks Industry Revenue Share (%), by End-user Vertical 2024 & 2032
- Figure 42: Middle East Data Center Networks Industry Revenue (Million), by Country 2024 & 2032
- Figure 43: Middle East Data Center Networks Industry Revenue Share (%), by Country 2024 & 2032
List of Tables
- Table 1: Global Data Center Networks Industry Revenue Million Forecast, by Region 2019 & 2032
- Table 2: Global Data Center Networks Industry Revenue Million Forecast, by Product 2019 & 2032
- Table 3: Global Data Center Networks Industry Revenue Million Forecast, by End-user Vertical 2019 & 2032
- Table 4: Global Data Center Networks Industry Revenue Million Forecast, by Region 2019 & 2032
- Table 5: Global Data Center Networks Industry Revenue Million Forecast, by Country 2019 & 2032
- Table 6: United States Data Center Networks Industry Revenue (Million) Forecast, by Application 2019 & 2032
- Table 7: Canada Data Center Networks Industry Revenue (Million) Forecast, by Application 2019 & 2032
- Table 8: Mexico Data Center Networks Industry Revenue (Million) Forecast, by Application 2019 & 2032
- Table 9: Global Data Center Networks Industry Revenue Million Forecast, by Country 2019 & 2032
- Table 10: Germany Data Center Networks Industry Revenue (Million) Forecast, by Application 2019 & 2032
- Table 11: United Kingdom Data Center Networks Industry Revenue (Million) Forecast, by Application 2019 & 2032
- Table 12: France Data Center Networks Industry Revenue (Million) Forecast, by Application 2019 & 2032
- Table 13: Spain Data Center Networks Industry Revenue (Million) Forecast, by Application 2019 & 2032
- Table 14: Italy Data Center Networks Industry Revenue (Million) Forecast, by Application 2019 & 2032
- Table 15: Spain Data Center Networks Industry Revenue (Million) Forecast, by Application 2019 & 2032
- Table 16: Belgium Data Center Networks Industry Revenue (Million) Forecast, by Application 2019 & 2032
- Table 17: Netherland Data Center Networks Industry Revenue (Million) Forecast, by Application 2019 & 2032
- Table 18: Nordics Data Center Networks Industry Revenue (Million) Forecast, by Application 2019 & 2032
- Table 19: Rest of Europe Data Center Networks Industry Revenue (Million) Forecast, by Application 2019 & 2032
- Table 20: Global Data Center Networks Industry Revenue Million Forecast, by Country 2019 & 2032
- Table 21: China Data Center Networks Industry Revenue (Million) Forecast, by Application 2019 & 2032
- Table 22: Japan Data Center Networks Industry Revenue (Million) Forecast, by Application 2019 & 2032
- Table 23: India Data Center Networks Industry Revenue (Million) Forecast, by Application 2019 & 2032
- Table 24: South Korea Data Center Networks Industry Revenue (Million) Forecast, by Application 2019 & 2032
- Table 25: Southeast Asia Data Center Networks Industry Revenue (Million) Forecast, by Application 2019 & 2032
- Table 26: Australia Data Center Networks Industry Revenue (Million) Forecast, by Application 2019 & 2032
- Table 27: Indonesia Data Center Networks Industry Revenue (Million) Forecast, by Application 2019 & 2032
- Table 28: Phillipes Data Center Networks Industry Revenue (Million) Forecast, by Application 2019 & 2032
- Table 29: Singapore Data Center Networks Industry Revenue (Million) Forecast, by Application 2019 & 2032
- Table 30: Thailandc Data Center Networks Industry Revenue (Million) Forecast, by Application 2019 & 2032
- Table 31: Rest of Asia Pacific Data Center Networks Industry Revenue (Million) Forecast, by Application 2019 & 2032
- Table 32: Global Data Center Networks Industry Revenue Million Forecast, by Country 2019 & 2032
- Table 33: Brazil Data Center Networks Industry Revenue (Million) Forecast, by Application 2019 & 2032
- Table 34: Argentina Data Center Networks Industry Revenue (Million) Forecast, by Application 2019 & 2032
- Table 35: Peru Data Center Networks Industry Revenue (Million) Forecast, by Application 2019 & 2032
- Table 36: Chile Data Center Networks Industry Revenue (Million) Forecast, by Application 2019 & 2032
- Table 37: Colombia Data Center Networks Industry Revenue (Million) Forecast, by Application 2019 & 2032
- Table 38: Ecuador Data Center Networks Industry Revenue (Million) Forecast, by Application 2019 & 2032
- Table 39: Venezuela Data Center Networks Industry Revenue (Million) Forecast, by Application 2019 & 2032
- Table 40: Rest of South America Data Center Networks Industry Revenue (Million) Forecast, by Application 2019 & 2032
- Table 41: Global Data Center Networks Industry Revenue Million Forecast, by Country 2019 & 2032
- Table 42: United States Data Center Networks Industry Revenue (Million) Forecast, by Application 2019 & 2032
- Table 43: Canada Data Center Networks Industry Revenue (Million) Forecast, by Application 2019 & 2032
- Table 44: Mexico Data Center Networks Industry Revenue (Million) Forecast, by Application 2019 & 2032
- Table 45: Global Data Center Networks Industry Revenue Million Forecast, by Country 2019 & 2032
- Table 46: United Arab Emirates Data Center Networks Industry Revenue (Million) Forecast, by Application 2019 & 2032
- Table 47: Saudi Arabia Data Center Networks Industry Revenue (Million) Forecast, by Application 2019 & 2032
- Table 48: South Africa Data Center Networks Industry Revenue (Million) Forecast, by Application 2019 & 2032
- Table 49: Rest of Middle East and Africa Data Center Networks Industry Revenue (Million) Forecast, by Application 2019 & 2032
- Table 50: Global Data Center Networks Industry Revenue Million Forecast, by Product 2019 & 2032
- Table 51: Global Data Center Networks Industry Revenue Million Forecast, by End-user Vertical 2019 & 2032
- Table 52: Global Data Center Networks Industry Revenue Million Forecast, by Country 2019 & 2032
- Table 53: United States Data Center Networks Industry Revenue (Million) Forecast, by Application 2019 & 2032
- Table 54: Canada Data Center Networks Industry Revenue (Million) Forecast, by Application 2019 & 2032
- Table 55: Global Data Center Networks Industry Revenue Million Forecast, by Product 2019 & 2032
- Table 56: Global Data Center Networks Industry Revenue Million Forecast, by End-user Vertical 2019 & 2032
- Table 57: Global Data Center Networks Industry Revenue Million Forecast, by Country 2019 & 2032
- Table 58: Germany Data Center Networks Industry Revenue (Million) Forecast, by Application 2019 & 2032
- Table 59: United Kingdom Data Center Networks Industry Revenue (Million) Forecast, by Application 2019 & 2032
- Table 60: Rest of Europe Data Center Networks Industry Revenue (Million) Forecast, by Application 2019 & 2032
- Table 61: Global Data Center Networks Industry Revenue Million Forecast, by Product 2019 & 2032
- Table 62: Global Data Center Networks Industry Revenue Million Forecast, by End-user Vertical 2019 & 2032
- Table 63: Global Data Center Networks Industry Revenue Million Forecast, by Country 2019 & 2032
- Table 64: China Data Center Networks Industry Revenue (Million) Forecast, by Application 2019 & 2032
- Table 65: India Data Center Networks Industry Revenue (Million) Forecast, by Application 2019 & 2032
- Table 66: Rest of Asia Pacific Data Center Networks Industry Revenue (Million) Forecast, by Application 2019 & 2032
- Table 67: Global Data Center Networks Industry Revenue Million Forecast, by Product 2019 & 2032
- Table 68: Global Data Center Networks Industry Revenue Million Forecast, by End-user Vertical 2019 & 2032
- Table 69: Global Data Center Networks Industry Revenue Million Forecast, by Country 2019 & 2032
- Table 70: Global Data Center Networks Industry Revenue Million Forecast, by Product 2019 & 2032
- Table 71: Global Data Center Networks Industry Revenue Million Forecast, by End-user Vertical 2019 & 2032
- Table 72: Global Data Center Networks Industry Revenue Million Forecast, by Country 2019 & 2032
Frequently Asked Questions
1. What is the projected Compound Annual Growth Rate (CAGR) of the Data Center Networks Industry?
The projected CAGR is approximately 17.85%.
2. Which companies are prominent players in the Data Center Networks Industry?
Key companies in the market include Cumulus Networks Inc, Equinix Inc, Arista Networks Inc, Dell EMC, Lenovo Group Ltd, Cisco Systems Inc, Juniper Networks Inc, Extreme Networks Inc, NEC Corporation, Big Switch Networks Inc, Huawei Technologies Co Ltd, H3C Holding Limited, VMware Inc.
3. What are the main segments of the Data Center Networks Industry?
The market segments include Product, End-user Vertical.
4. Can you provide details about the market size?
The market size is estimated to be USD 26.12 Million as of 2022.
5. What are some drivers contributing to market growth?
Increasing Utilization of Cloud Storage is Driving the Market Growth; Rising Need for Backup and Storage is Expanding the Market Demand; The Growth in Retail and E-Commerce is Anticipated to Drive the Market Demand.
6. What are the notable trends driving market growth?
The Growth in Retail and E-Commerce is Anticipated to Drive the Market Demand.
7. Are there any restraints impacting market growth?
Lack of Skilled Professionals is Hindering the Market Demand.
8. Can you provide examples of recent developments in the market?
March 2023 - Arista Networks introduced the Arista WAN Routing System, which integrates three new networking offerings: enterprise-class routing platforms, carrier/cloud-neutral internet transit capabilities, and the CloudVision Pathfinder Service to simplify and enhance customer-wide area networks. Based on Arista's EOS routing capabilities, and CloudVision management, the Arista WAN Routing System bears the architecture, features, and platforms to modernize federated and software-defined wide area networks.
9. What pricing options are available for accessing the report?
Pricing options include single-user, multi-user, and enterprise licenses priced at USD 4750, USD 5250, and USD 8750 respectively.
10. Is the market size provided in terms of value or volume?
The market size is provided in terms of value, measured in Million.
11. Are there any specific market keywords associated with the report?
Yes, the market keyword associated with the report is "Data Center Networks Industry," which aids in identifying and referencing the specific market segment covered.
12. How do I determine which pricing option suits my needs best?
The pricing options vary based on user requirements and access needs. Individual users may opt for single-user licenses, while businesses requiring broader access may choose multi-user or enterprise licenses for cost-effective access to the report.
13. Are there any additional resources or data provided in the Data Center Networks Industry report?
While the report offers comprehensive insights, it's advisable to review the specific contents or supplementary materials provided to ascertain if additional resources or data are available.
14. How can I stay updated on further developments or reports in the Data Center Networks Industry?
To stay informed about further developments, trends, and reports in the Data Center Networks Industry, consider subscribing to industry newsletters, following relevant companies and organizations, or regularly checking reputable industry news sources and publications.
Methodology
Step 1 - Identification of Relevant Samples Size from Population Database


Step 2 - Approaches for Defining Global Market Size (Value, Volume* & Price*)

Note*: In applicable scenarios
Step 3 - Data Sources
Primary Research
- Web Analytics
- Survey Reports
- Research Institute
- Latest Research Reports
- Opinion Leaders
Secondary Research
- Annual Reports
- White Paper
- Latest Press Release
- Industry Association
- Paid Database
- Investor Presentations

Step 4 - Data Triangulation
Involves using different sources of information in order to increase the validity of a study
These sources are likely to be stakeholders in a program - participants, other researchers, program staff, other community members, and so on.
Then we put all data in single framework & apply various statistical tools to find out the dynamic on the market.
During the analysis stage, feedback from the stakeholder groups would be compared to determine areas of agreement as well as areas of divergence


