
Key Insights
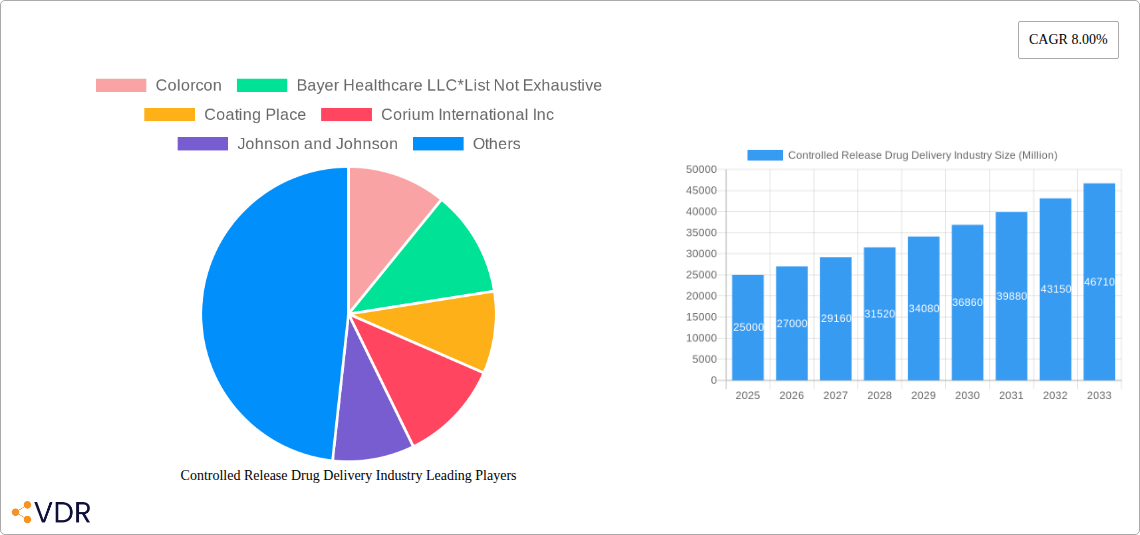
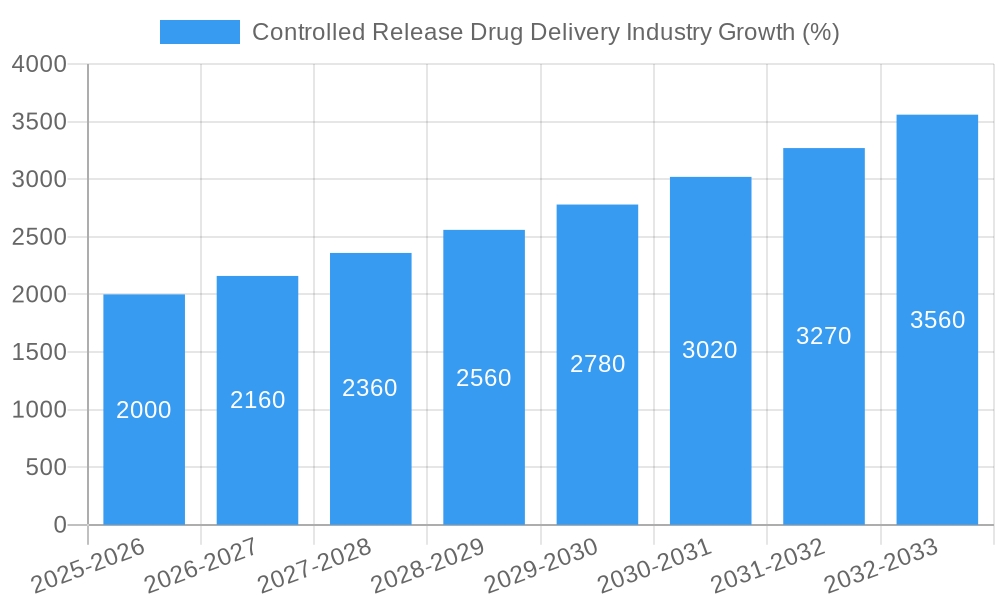
The controlled release drug delivery market is experiencing robust growth, projected to reach a substantial size due to the increasing demand for improved patient compliance and therapeutic efficacy. A compound annual growth rate (CAGR) of 8% from 2019 to 2033 indicates a significant expansion of this market. This growth is fueled by several key drivers, including the rising prevalence of chronic diseases requiring long-term medication, advancements in drug delivery technologies like microencapsulation and targeted delivery systems, and a growing preference for convenient and less invasive administration routes such as transdermal patches and inhalers. The market is segmented by technology (microencapsulation, transdermal, targeted delivery, and others) and application (metered dose inhalers, injectables, transdermal and ocular patches, and others). While challenges remain, including regulatory hurdles and high research and development costs associated with new delivery systems, the overall market outlook remains positive.
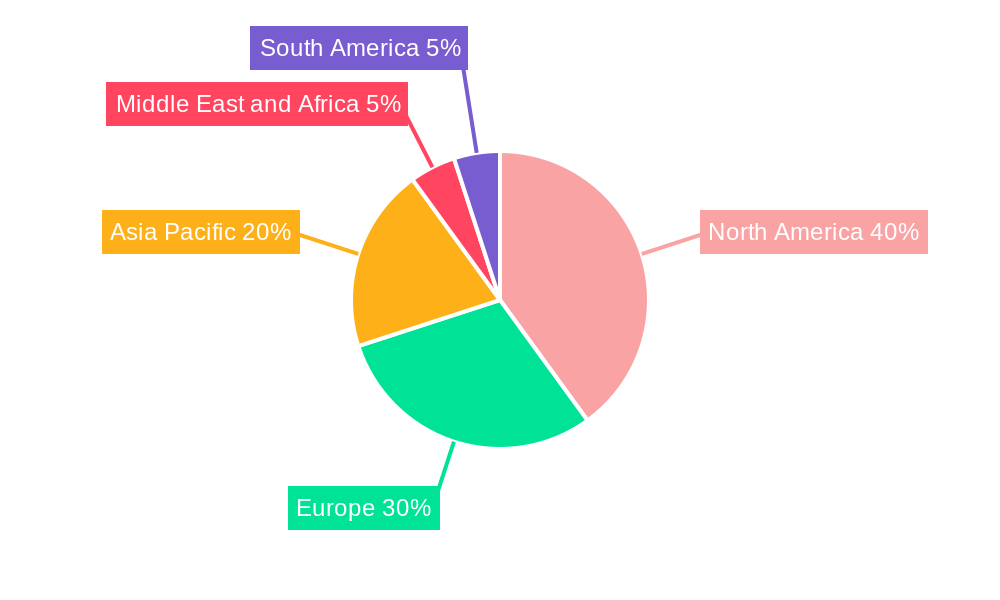
The market's geographical distribution showcases a strong presence across North America, Europe, and Asia Pacific. North America, with its robust healthcare infrastructure and high adoption of advanced drug delivery systems, currently holds a significant market share. However, the Asia Pacific region is expected to witness substantial growth in the coming years, driven by increasing healthcare expenditure and rising prevalence of chronic diseases in developing economies like India and China. Major players like Colorcon, Bayer Healthcare, Johnson & Johnson, Merck, and GlaxoSmithKline are actively involved in research, development, and market expansion, contributing to the market's dynamic landscape. The competitive landscape is characterized by both large pharmaceutical companies and specialized drug delivery technology providers, fostering innovation and competition to enhance existing treatments and introduce novel drug delivery approaches. Given these trends, the controlled release drug delivery market is poised for continued expansion, offering significant opportunities for both established players and emerging companies.
Controlled Release Drug Delivery Industry: A Comprehensive Market Report (2019-2033)
This comprehensive report provides an in-depth analysis of the Controlled Release Drug Delivery industry, encompassing market dynamics, growth trends, regional insights, product landscape, key players, and future outlook. The study period spans from 2019 to 2033, with a base year of 2025 and a forecast period of 2025-2033. The report segments the market by technology (Micro Encapsulation, Transdermal, Targeted Delivery, Other Technologies) and application (Metered Dose Inhalers, Injectable, Transdermal and Ocular Patches, Other Applications), offering granular insights into various market segments and their growth trajectories. The report is invaluable for pharmaceutical companies, investors, researchers, and industry professionals seeking a clear understanding of this dynamic market. The total market value is predicted to reach xx Million units by 2033.
Controlled Release Drug Delivery Industry Market Dynamics & Structure
The controlled release drug delivery market is characterized by moderate concentration, with several key players holding significant market share. Technological innovation, particularly in areas like targeted drug delivery and advanced microencapsulation, is a primary growth driver. Stringent regulatory frameworks influence product development and approval timelines, while the existence of competitive substitute therapies creates ongoing pressure on market participants. The aging global population and the increasing prevalence of chronic diseases fuel demand. M&A activity is steady, with larger companies seeking to expand their portfolios through acquisitions of smaller, innovative firms.
- Market Concentration: Moderately concentrated, with top 5 players holding approximately 45% market share in 2024 (estimated).
- Technological Innovation: Focus on improving drug efficacy, reducing side effects, enhancing patient compliance, and expanding treatment options.
- Regulatory Landscape: Stringent regulations requiring extensive clinical trials and approvals, impacting the speed of product launches.
- Competitive Substitutes: Traditional drug delivery methods compete with controlled release systems, impacting market adoption.
- End-User Demographics: Aging population and rising prevalence of chronic diseases significantly influence market growth.
- M&A Trends: Strategic acquisitions observed, with larger players consolidating market share and accessing new technologies. Approximately 15-20 M&A deals recorded annually in the past five years.
Controlled Release Drug Delivery Industry Growth Trends & Insights
The controlled release drug delivery market experienced substantial growth during the historical period (2019-2024) and is projected to maintain a healthy Compound Annual Growth Rate (CAGR) of xx% during the forecast period (2025-2033). This growth is fueled by the increasing demand for improved therapeutics, the rising adoption of advanced technologies, and favorable regulatory support for innovative drug delivery systems. Technological disruptions, such as the development of biocompatible polymers and advanced nanocarriers, are continually transforming the market landscape. Consumer preferences are shifting toward more convenient and efficacious treatment options, driving the demand for advanced controlled release systems. Market penetration is increasing across various therapeutic areas, particularly in oncology, endocrinology, and cardiovascular diseases. By 2033, market penetration is expected to reach xx%.
Dominant Regions, Countries, or Segments in Controlled Release Drug Delivery Industry
North America currently holds the largest market share, driven by robust R&D activities, the presence of major pharmaceutical companies, and favorable regulatory environments. However, Asia-Pacific is expected to witness significant growth during the forecast period, owing to increasing healthcare expenditure and rising awareness about advanced drug delivery technologies. Within segments, Microencapsulation holds a substantial market share due to its widespread applications and cost-effectiveness. Targeted delivery is a fast-growing segment, owing to its potential for improved therapeutic outcomes and reduced side effects.
- North America: High market share due to advanced healthcare infrastructure and strong presence of major industry players.
- Asia-Pacific: High growth potential driven by increasing healthcare expenditure and rising prevalence of chronic diseases.
- Microencapsulation: Largest segment due to its versatility and established market presence.
- Targeted Delivery: Fastest-growing segment, driven by technological advancements and improved therapeutic outcomes.
Controlled Release Drug Delivery Industry Product Landscape
The controlled release drug delivery market offers a diverse range of products, including implants, patches, injectables, and inhalers. Innovative formulations such as biodegradable polymers, nanoparticles, and liposomes are enhancing drug efficacy and reducing side effects. The key selling propositions focus on extended release times, improved patient compliance, reduced dosing frequency, and targeted drug delivery to specific tissues or organs. Recent technological advancements have focused on minimizing toxicity, enhancing biocompatibility, and improving drug stability.
Key Drivers, Barriers & Challenges in Controlled Release Drug Delivery Industry
Key Drivers:
- Increasing prevalence of chronic diseases.
- Growing demand for patient-friendly drug delivery systems.
- Technological advancements in microencapsulation and targeted delivery.
- Favorable regulatory support for innovative drug delivery systems.
Challenges & Restraints:
- High R&D costs associated with the development of complex formulations.
- Stringent regulatory requirements and lengthy approval processes.
- Potential for manufacturing complexities and scalability issues.
- Competition from traditional drug delivery methods. This impact results in a approximately 5% reduction in overall market growth annually.
Emerging Opportunities in Controlled Release Drug Delivery Industry
Emerging opportunities lie in the development of personalized drug delivery systems, the expansion into new therapeutic areas (e.g., gene therapy), and the integration of digital technologies for improved monitoring and patient compliance. Untapped markets in developing countries represent significant growth potential. The increasing use of biocompatible materials and the development of novel drug release mechanisms will drive innovation.
Growth Accelerators in the Controlled Release Drug Delivery Industry Industry
Technological breakthroughs in areas such as nanotechnology, biomaterials, and artificial intelligence are creating new opportunities for innovation and improvement in controlled release drug delivery. Strategic partnerships between pharmaceutical companies and technology providers are accelerating the pace of innovation and market penetration. Expanding into emerging markets and focusing on unmet clinical needs are key strategies for growth.
Key Players Shaping the Controlled Release Drug Delivery Market
- Colorcon
- Bayer Healthcare LLC
- Coating Place
- Corium International Inc
- Johnson and Johnson
- Merck and Co Inc
- Lonza
- Adare Pharma Solutions
- GlaxoSmithKline PLC
Notable Milestones in Controlled Release Drug Delivery Industry Sector
- June 2022: A research study at the University of Michigan demonstrated a novel method for drug microencapsulation, enabling the slow release of peptide drugs, opening opportunities for new treatments.
- March 2022: Evonik's launch of Eudratec SoluFlow, a microparticle technology enhancing the solubility of active pharmaceutical ingredients, addresses a key challenge in oral drug formulation, expanding treatment options for various diseases.
In-Depth Controlled Release Drug Delivery Industry Market Outlook
The future of the controlled release drug delivery market is bright, driven by continued technological advancements, increasing demand for improved therapeutics, and the expansion of the global aging population. Strategic collaborations and partnerships among industry players will accelerate innovation and market penetration. Significant growth potential lies in developing personalized medicine approaches and expanding into emerging markets with unmet clinical needs. The market is poised for sustained growth, driven by the aforementioned factors and a continuous focus on improving patient outcomes.
Controlled Release Drug Delivery Industry Segmentation
-
1. Technology
- 1.1. Micro Encapsulation
- 1.2. Transdermal
- 1.3. Targeted Delivery
- 1.4. Other Technologies
-
2. Application
- 2.1. Metered Dose Inhalers
- 2.2. Injectable
- 2.3. Transdermal and Ocular Patches
- 2.4. Other Applications
Controlled Release Drug Delivery Industry Segmentation By Geography
-
1. North America
- 1.1. United States
- 1.2. Canada
- 1.3. Mexico
-
2. Europe
- 2.1. Germany
- 2.2. United Kingdom
- 2.3. France
- 2.4. Italy
- 2.5. Spain
- 2.6. Rest of Europe
-
3. Asia Pacific
- 3.1. China
- 3.2. Japan
- 3.3. India
- 3.4. Australia
- 3.5. South Korea
- 3.6. Rest of Asia Pacific
-
4. Middle East and Africa
- 4.1. GCC
- 4.2. South Africa
- 4.3. Rest of Middle East and Africa
-
5. South America
- 5.1. Brazil
- 5.2. Argentina
- 5.3. Rest of South America
Controlled Release Drug Delivery Industry REPORT HIGHLIGHTS
| Aspects | Details |
|---|---|
| Study Period | 2019-2033 |
| Base Year | 2024 |
| Estimated Year | 2025 |
| Forecast Period | 2025-2033 |
| Historical Period | 2019-2024 |
| Growth Rate | CAGR of 8.00% from 2019-2033 |
| Segmentation |
|
Table of Contents
- 1. Introduction
- 1.1. Research Scope
- 1.2. Market Segmentation
- 1.3. Research Methodology
- 1.4. Definitions and Assumptions
- 2. Executive Summary
- 2.1. Introduction
- 3. Market Dynamics
- 3.1. Introduction
- 3.2. Market Drivers
- 3.2.1. Rise in Incidence of Chronic diseases; Growing Geriatric and Pediatric Population
- 3.3. Market Restrains
- 3.3.1. Higher Cost Compared to the Conventional Method
- 3.4. Market Trends
- 3.4.1. The Targeted Delivery Segment is Expected to Hold a Major Market Share in the Controlled Release Drug Delivery Market.
- 4. Market Factor Analysis
- 4.1. Porters Five Forces
- 4.2. Supply/Value Chain
- 4.3. PESTEL analysis
- 4.4. Market Entropy
- 4.5. Patent/Trademark Analysis
- 5. Global Controlled Release Drug Delivery Industry Analysis, Insights and Forecast, 2019-2031
- 5.1. Market Analysis, Insights and Forecast - by Technology
- 5.1.1. Micro Encapsulation
- 5.1.2. Transdermal
- 5.1.3. Targeted Delivery
- 5.1.4. Other Technologies
- 5.2. Market Analysis, Insights and Forecast - by Application
- 5.2.1. Metered Dose Inhalers
- 5.2.2. Injectable
- 5.2.3. Transdermal and Ocular Patches
- 5.2.4. Other Applications
- 5.3. Market Analysis, Insights and Forecast - by Region
- 5.3.1. North America
- 5.3.2. Europe
- 5.3.3. Asia Pacific
- 5.3.4. Middle East and Africa
- 5.3.5. South America
- 5.1. Market Analysis, Insights and Forecast - by Technology
- 6. North America Controlled Release Drug Delivery Industry Analysis, Insights and Forecast, 2019-2031
- 6.1. Market Analysis, Insights and Forecast - by Technology
- 6.1.1. Micro Encapsulation
- 6.1.2. Transdermal
- 6.1.3. Targeted Delivery
- 6.1.4. Other Technologies
- 6.2. Market Analysis, Insights and Forecast - by Application
- 6.2.1. Metered Dose Inhalers
- 6.2.2. Injectable
- 6.2.3. Transdermal and Ocular Patches
- 6.2.4. Other Applications
- 6.1. Market Analysis, Insights and Forecast - by Technology
- 7. Europe Controlled Release Drug Delivery Industry Analysis, Insights and Forecast, 2019-2031
- 7.1. Market Analysis, Insights and Forecast - by Technology
- 7.1.1. Micro Encapsulation
- 7.1.2. Transdermal
- 7.1.3. Targeted Delivery
- 7.1.4. Other Technologies
- 7.2. Market Analysis, Insights and Forecast - by Application
- 7.2.1. Metered Dose Inhalers
- 7.2.2. Injectable
- 7.2.3. Transdermal and Ocular Patches
- 7.2.4. Other Applications
- 7.1. Market Analysis, Insights and Forecast - by Technology
- 8. Asia Pacific Controlled Release Drug Delivery Industry Analysis, Insights and Forecast, 2019-2031
- 8.1. Market Analysis, Insights and Forecast - by Technology
- 8.1.1. Micro Encapsulation
- 8.1.2. Transdermal
- 8.1.3. Targeted Delivery
- 8.1.4. Other Technologies
- 8.2. Market Analysis, Insights and Forecast - by Application
- 8.2.1. Metered Dose Inhalers
- 8.2.2. Injectable
- 8.2.3. Transdermal and Ocular Patches
- 8.2.4. Other Applications
- 8.1. Market Analysis, Insights and Forecast - by Technology
- 9. Middle East and Africa Controlled Release Drug Delivery Industry Analysis, Insights and Forecast, 2019-2031
- 9.1. Market Analysis, Insights and Forecast - by Technology
- 9.1.1. Micro Encapsulation
- 9.1.2. Transdermal
- 9.1.3. Targeted Delivery
- 9.1.4. Other Technologies
- 9.2. Market Analysis, Insights and Forecast - by Application
- 9.2.1. Metered Dose Inhalers
- 9.2.2. Injectable
- 9.2.3. Transdermal and Ocular Patches
- 9.2.4. Other Applications
- 9.1. Market Analysis, Insights and Forecast - by Technology
- 10. South America Controlled Release Drug Delivery Industry Analysis, Insights and Forecast, 2019-2031
- 10.1. Market Analysis, Insights and Forecast - by Technology
- 10.1.1. Micro Encapsulation
- 10.1.2. Transdermal
- 10.1.3. Targeted Delivery
- 10.1.4. Other Technologies
- 10.2. Market Analysis, Insights and Forecast - by Application
- 10.2.1. Metered Dose Inhalers
- 10.2.2. Injectable
- 10.2.3. Transdermal and Ocular Patches
- 10.2.4. Other Applications
- 10.1. Market Analysis, Insights and Forecast - by Technology
- 11. North America Controlled Release Drug Delivery Industry Analysis, Insights and Forecast, 2019-2031
- 11.1. Market Analysis, Insights and Forecast - By Country/Sub-region
- 11.1.1 United States
- 11.1.2 Canada
- 11.1.3 Mexico
- 12. Europe Controlled Release Drug Delivery Industry Analysis, Insights and Forecast, 2019-2031
- 12.1. Market Analysis, Insights and Forecast - By Country/Sub-region
- 12.1.1 Germany
- 12.1.2 United Kingdom
- 12.1.3 France
- 12.1.4 Italy
- 12.1.5 Spain
- 12.1.6 Rest of Europe
- 13. Asia Pacific Controlled Release Drug Delivery Industry Analysis, Insights and Forecast, 2019-2031
- 13.1. Market Analysis, Insights and Forecast - By Country/Sub-region
- 13.1.1 China
- 13.1.2 Japan
- 13.1.3 India
- 13.1.4 Australia
- 13.1.5 South Korea
- 13.1.6 Rest of Asia Pacific
- 14. Middle East and Africa Controlled Release Drug Delivery Industry Analysis, Insights and Forecast, 2019-2031
- 14.1. Market Analysis, Insights and Forecast - By Country/Sub-region
- 14.1.1 GCC
- 14.1.2 South Africa
- 14.1.3 Rest of Middle East and Africa
- 15. South America Controlled Release Drug Delivery Industry Analysis, Insights and Forecast, 2019-2031
- 15.1. Market Analysis, Insights and Forecast - By Country/Sub-region
- 15.1.1 Brazil
- 15.1.2 Argentina
- 15.1.3 Rest of South America
- 16. Competitive Analysis
- 16.1. Global Market Share Analysis 2024
- 16.2. Company Profiles
- 16.2.1 Colorcon
- 16.2.1.1. Overview
- 16.2.1.2. Products
- 16.2.1.3. SWOT Analysis
- 16.2.1.4. Recent Developments
- 16.2.1.5. Financials (Based on Availability)
- 16.2.2 Bayer Healthcare LLC*List Not Exhaustive
- 16.2.2.1. Overview
- 16.2.2.2. Products
- 16.2.2.3. SWOT Analysis
- 16.2.2.4. Recent Developments
- 16.2.2.5. Financials (Based on Availability)
- 16.2.3 Coating Place
- 16.2.3.1. Overview
- 16.2.3.2. Products
- 16.2.3.3. SWOT Analysis
- 16.2.3.4. Recent Developments
- 16.2.3.5. Financials (Based on Availability)
- 16.2.4 Corium International Inc
- 16.2.4.1. Overview
- 16.2.4.2. Products
- 16.2.4.3. SWOT Analysis
- 16.2.4.4. Recent Developments
- 16.2.4.5. Financials (Based on Availability)
- 16.2.5 Johnson and Johnson
- 16.2.5.1. Overview
- 16.2.5.2. Products
- 16.2.5.3. SWOT Analysis
- 16.2.5.4. Recent Developments
- 16.2.5.5. Financials (Based on Availability)
- 16.2.6 Merck and Co Inc
- 16.2.6.1. Overview
- 16.2.6.2. Products
- 16.2.6.3. SWOT Analysis
- 16.2.6.4. Recent Developments
- 16.2.6.5. Financials (Based on Availability)
- 16.2.7 Lonza
- 16.2.7.1. Overview
- 16.2.7.2. Products
- 16.2.7.3. SWOT Analysis
- 16.2.7.4. Recent Developments
- 16.2.7.5. Financials (Based on Availability)
- 16.2.8 Adare Pharma Solutions
- 16.2.8.1. Overview
- 16.2.8.2. Products
- 16.2.8.3. SWOT Analysis
- 16.2.8.4. Recent Developments
- 16.2.8.5. Financials (Based on Availability)
- 16.2.9 GlaxoSmithKline PLC
- 16.2.9.1. Overview
- 16.2.9.2. Products
- 16.2.9.3. SWOT Analysis
- 16.2.9.4. Recent Developments
- 16.2.9.5. Financials (Based on Availability)
- 16.2.1 Colorcon
List of Figures
- Figure 1: Global Controlled Release Drug Delivery Industry Revenue Breakdown (Million, %) by Region 2024 & 2032
- Figure 2: North America Controlled Release Drug Delivery Industry Revenue (Million), by Country 2024 & 2032
- Figure 3: North America Controlled Release Drug Delivery Industry Revenue Share (%), by Country 2024 & 2032
- Figure 4: Europe Controlled Release Drug Delivery Industry Revenue (Million), by Country 2024 & 2032
- Figure 5: Europe Controlled Release Drug Delivery Industry Revenue Share (%), by Country 2024 & 2032
- Figure 6: Asia Pacific Controlled Release Drug Delivery Industry Revenue (Million), by Country 2024 & 2032
- Figure 7: Asia Pacific Controlled Release Drug Delivery Industry Revenue Share (%), by Country 2024 & 2032
- Figure 8: Middle East and Africa Controlled Release Drug Delivery Industry Revenue (Million), by Country 2024 & 2032
- Figure 9: Middle East and Africa Controlled Release Drug Delivery Industry Revenue Share (%), by Country 2024 & 2032
- Figure 10: South America Controlled Release Drug Delivery Industry Revenue (Million), by Country 2024 & 2032
- Figure 11: South America Controlled Release Drug Delivery Industry Revenue Share (%), by Country 2024 & 2032
- Figure 12: North America Controlled Release Drug Delivery Industry Revenue (Million), by Technology 2024 & 2032
- Figure 13: North America Controlled Release Drug Delivery Industry Revenue Share (%), by Technology 2024 & 2032
- Figure 14: North America Controlled Release Drug Delivery Industry Revenue (Million), by Application 2024 & 2032
- Figure 15: North America Controlled Release Drug Delivery Industry Revenue Share (%), by Application 2024 & 2032
- Figure 16: North America Controlled Release Drug Delivery Industry Revenue (Million), by Country 2024 & 2032
- Figure 17: North America Controlled Release Drug Delivery Industry Revenue Share (%), by Country 2024 & 2032
- Figure 18: Europe Controlled Release Drug Delivery Industry Revenue (Million), by Technology 2024 & 2032
- Figure 19: Europe Controlled Release Drug Delivery Industry Revenue Share (%), by Technology 2024 & 2032
- Figure 20: Europe Controlled Release Drug Delivery Industry Revenue (Million), by Application 2024 & 2032
- Figure 21: Europe Controlled Release Drug Delivery Industry Revenue Share (%), by Application 2024 & 2032
- Figure 22: Europe Controlled Release Drug Delivery Industry Revenue (Million), by Country 2024 & 2032
- Figure 23: Europe Controlled Release Drug Delivery Industry Revenue Share (%), by Country 2024 & 2032
- Figure 24: Asia Pacific Controlled Release Drug Delivery Industry Revenue (Million), by Technology 2024 & 2032
- Figure 25: Asia Pacific Controlled Release Drug Delivery Industry Revenue Share (%), by Technology 2024 & 2032
- Figure 26: Asia Pacific Controlled Release Drug Delivery Industry Revenue (Million), by Application 2024 & 2032
- Figure 27: Asia Pacific Controlled Release Drug Delivery Industry Revenue Share (%), by Application 2024 & 2032
- Figure 28: Asia Pacific Controlled Release Drug Delivery Industry Revenue (Million), by Country 2024 & 2032
- Figure 29: Asia Pacific Controlled Release Drug Delivery Industry Revenue Share (%), by Country 2024 & 2032
- Figure 30: Middle East and Africa Controlled Release Drug Delivery Industry Revenue (Million), by Technology 2024 & 2032
- Figure 31: Middle East and Africa Controlled Release Drug Delivery Industry Revenue Share (%), by Technology 2024 & 2032
- Figure 32: Middle East and Africa Controlled Release Drug Delivery Industry Revenue (Million), by Application 2024 & 2032
- Figure 33: Middle East and Africa Controlled Release Drug Delivery Industry Revenue Share (%), by Application 2024 & 2032
- Figure 34: Middle East and Africa Controlled Release Drug Delivery Industry Revenue (Million), by Country 2024 & 2032
- Figure 35: Middle East and Africa Controlled Release Drug Delivery Industry Revenue Share (%), by Country 2024 & 2032
- Figure 36: South America Controlled Release Drug Delivery Industry Revenue (Million), by Technology 2024 & 2032
- Figure 37: South America Controlled Release Drug Delivery Industry Revenue Share (%), by Technology 2024 & 2032
- Figure 38: South America Controlled Release Drug Delivery Industry Revenue (Million), by Application 2024 & 2032
- Figure 39: South America Controlled Release Drug Delivery Industry Revenue Share (%), by Application 2024 & 2032
- Figure 40: South America Controlled Release Drug Delivery Industry Revenue (Million), by Country 2024 & 2032
- Figure 41: South America Controlled Release Drug Delivery Industry Revenue Share (%), by Country 2024 & 2032
List of Tables
- Table 1: Global Controlled Release Drug Delivery Industry Revenue Million Forecast, by Region 2019 & 2032
- Table 2: Global Controlled Release Drug Delivery Industry Revenue Million Forecast, by Technology 2019 & 2032
- Table 3: Global Controlled Release Drug Delivery Industry Revenue Million Forecast, by Application 2019 & 2032
- Table 4: Global Controlled Release Drug Delivery Industry Revenue Million Forecast, by Region 2019 & 2032
- Table 5: Global Controlled Release Drug Delivery Industry Revenue Million Forecast, by Country 2019 & 2032
- Table 6: United States Controlled Release Drug Delivery Industry Revenue (Million) Forecast, by Application 2019 & 2032
- Table 7: Canada Controlled Release Drug Delivery Industry Revenue (Million) Forecast, by Application 2019 & 2032
- Table 8: Mexico Controlled Release Drug Delivery Industry Revenue (Million) Forecast, by Application 2019 & 2032
- Table 9: Global Controlled Release Drug Delivery Industry Revenue Million Forecast, by Country 2019 & 2032
- Table 10: Germany Controlled Release Drug Delivery Industry Revenue (Million) Forecast, by Application 2019 & 2032
- Table 11: United Kingdom Controlled Release Drug Delivery Industry Revenue (Million) Forecast, by Application 2019 & 2032
- Table 12: France Controlled Release Drug Delivery Industry Revenue (Million) Forecast, by Application 2019 & 2032
- Table 13: Italy Controlled Release Drug Delivery Industry Revenue (Million) Forecast, by Application 2019 & 2032
- Table 14: Spain Controlled Release Drug Delivery Industry Revenue (Million) Forecast, by Application 2019 & 2032
- Table 15: Rest of Europe Controlled Release Drug Delivery Industry Revenue (Million) Forecast, by Application 2019 & 2032
- Table 16: Global Controlled Release Drug Delivery Industry Revenue Million Forecast, by Country 2019 & 2032
- Table 17: China Controlled Release Drug Delivery Industry Revenue (Million) Forecast, by Application 2019 & 2032
- Table 18: Japan Controlled Release Drug Delivery Industry Revenue (Million) Forecast, by Application 2019 & 2032
- Table 19: India Controlled Release Drug Delivery Industry Revenue (Million) Forecast, by Application 2019 & 2032
- Table 20: Australia Controlled Release Drug Delivery Industry Revenue (Million) Forecast, by Application 2019 & 2032
- Table 21: South Korea Controlled Release Drug Delivery Industry Revenue (Million) Forecast, by Application 2019 & 2032
- Table 22: Rest of Asia Pacific Controlled Release Drug Delivery Industry Revenue (Million) Forecast, by Application 2019 & 2032
- Table 23: Global Controlled Release Drug Delivery Industry Revenue Million Forecast, by Country 2019 & 2032
- Table 24: GCC Controlled Release Drug Delivery Industry Revenue (Million) Forecast, by Application 2019 & 2032
- Table 25: South Africa Controlled Release Drug Delivery Industry Revenue (Million) Forecast, by Application 2019 & 2032
- Table 26: Rest of Middle East and Africa Controlled Release Drug Delivery Industry Revenue (Million) Forecast, by Application 2019 & 2032
- Table 27: Global Controlled Release Drug Delivery Industry Revenue Million Forecast, by Country 2019 & 2032
- Table 28: Brazil Controlled Release Drug Delivery Industry Revenue (Million) Forecast, by Application 2019 & 2032
- Table 29: Argentina Controlled Release Drug Delivery Industry Revenue (Million) Forecast, by Application 2019 & 2032
- Table 30: Rest of South America Controlled Release Drug Delivery Industry Revenue (Million) Forecast, by Application 2019 & 2032
- Table 31: Global Controlled Release Drug Delivery Industry Revenue Million Forecast, by Technology 2019 & 2032
- Table 32: Global Controlled Release Drug Delivery Industry Revenue Million Forecast, by Application 2019 & 2032
- Table 33: Global Controlled Release Drug Delivery Industry Revenue Million Forecast, by Country 2019 & 2032
- Table 34: United States Controlled Release Drug Delivery Industry Revenue (Million) Forecast, by Application 2019 & 2032
- Table 35: Canada Controlled Release Drug Delivery Industry Revenue (Million) Forecast, by Application 2019 & 2032
- Table 36: Mexico Controlled Release Drug Delivery Industry Revenue (Million) Forecast, by Application 2019 & 2032
- Table 37: Global Controlled Release Drug Delivery Industry Revenue Million Forecast, by Technology 2019 & 2032
- Table 38: Global Controlled Release Drug Delivery Industry Revenue Million Forecast, by Application 2019 & 2032
- Table 39: Global Controlled Release Drug Delivery Industry Revenue Million Forecast, by Country 2019 & 2032
- Table 40: Germany Controlled Release Drug Delivery Industry Revenue (Million) Forecast, by Application 2019 & 2032
- Table 41: United Kingdom Controlled Release Drug Delivery Industry Revenue (Million) Forecast, by Application 2019 & 2032
- Table 42: France Controlled Release Drug Delivery Industry Revenue (Million) Forecast, by Application 2019 & 2032
- Table 43: Italy Controlled Release Drug Delivery Industry Revenue (Million) Forecast, by Application 2019 & 2032
- Table 44: Spain Controlled Release Drug Delivery Industry Revenue (Million) Forecast, by Application 2019 & 2032
- Table 45: Rest of Europe Controlled Release Drug Delivery Industry Revenue (Million) Forecast, by Application 2019 & 2032
- Table 46: Global Controlled Release Drug Delivery Industry Revenue Million Forecast, by Technology 2019 & 2032
- Table 47: Global Controlled Release Drug Delivery Industry Revenue Million Forecast, by Application 2019 & 2032
- Table 48: Global Controlled Release Drug Delivery Industry Revenue Million Forecast, by Country 2019 & 2032
- Table 49: China Controlled Release Drug Delivery Industry Revenue (Million) Forecast, by Application 2019 & 2032
- Table 50: Japan Controlled Release Drug Delivery Industry Revenue (Million) Forecast, by Application 2019 & 2032
- Table 51: India Controlled Release Drug Delivery Industry Revenue (Million) Forecast, by Application 2019 & 2032
- Table 52: Australia Controlled Release Drug Delivery Industry Revenue (Million) Forecast, by Application 2019 & 2032
- Table 53: South Korea Controlled Release Drug Delivery Industry Revenue (Million) Forecast, by Application 2019 & 2032
- Table 54: Rest of Asia Pacific Controlled Release Drug Delivery Industry Revenue (Million) Forecast, by Application 2019 & 2032
- Table 55: Global Controlled Release Drug Delivery Industry Revenue Million Forecast, by Technology 2019 & 2032
- Table 56: Global Controlled Release Drug Delivery Industry Revenue Million Forecast, by Application 2019 & 2032
- Table 57: Global Controlled Release Drug Delivery Industry Revenue Million Forecast, by Country 2019 & 2032
- Table 58: GCC Controlled Release Drug Delivery Industry Revenue (Million) Forecast, by Application 2019 & 2032
- Table 59: South Africa Controlled Release Drug Delivery Industry Revenue (Million) Forecast, by Application 2019 & 2032
- Table 60: Rest of Middle East and Africa Controlled Release Drug Delivery Industry Revenue (Million) Forecast, by Application 2019 & 2032
- Table 61: Global Controlled Release Drug Delivery Industry Revenue Million Forecast, by Technology 2019 & 2032
- Table 62: Global Controlled Release Drug Delivery Industry Revenue Million Forecast, by Application 2019 & 2032
- Table 63: Global Controlled Release Drug Delivery Industry Revenue Million Forecast, by Country 2019 & 2032
- Table 64: Brazil Controlled Release Drug Delivery Industry Revenue (Million) Forecast, by Application 2019 & 2032
- Table 65: Argentina Controlled Release Drug Delivery Industry Revenue (Million) Forecast, by Application 2019 & 2032
- Table 66: Rest of South America Controlled Release Drug Delivery Industry Revenue (Million) Forecast, by Application 2019 & 2032
Frequently Asked Questions
1. What is the projected Compound Annual Growth Rate (CAGR) of the Controlled Release Drug Delivery Industry?
The projected CAGR is approximately 8.00%.
2. Which companies are prominent players in the Controlled Release Drug Delivery Industry?
Key companies in the market include Colorcon, Bayer Healthcare LLC*List Not Exhaustive, Coating Place, Corium International Inc, Johnson and Johnson, Merck and Co Inc, Lonza, Adare Pharma Solutions, GlaxoSmithKline PLC.
3. What are the main segments of the Controlled Release Drug Delivery Industry?
The market segments include Technology, Application.
4. Can you provide details about the market size?
The market size is estimated to be USD XX Million as of 2022.
5. What are some drivers contributing to market growth?
Rise in Incidence of Chronic diseases; Growing Geriatric and Pediatric Population.
6. What are the notable trends driving market growth?
The Targeted Delivery Segment is Expected to Hold a Major Market Share in the Controlled Release Drug Delivery Market..
7. Are there any restraints impacting market growth?
Higher Cost Compared to the Conventional Method.
8. Can you provide examples of recent developments in the market?
June 2022: A research study was conducted at the University of Michigan that demonstrated a new method of drug microencapsulation, allowing several peptide drugs to be slowly released into the body.
9. What pricing options are available for accessing the report?
Pricing options include single-user, multi-user, and enterprise licenses priced at USD 4750, USD 5250, and USD 8750 respectively.
10. Is the market size provided in terms of value or volume?
The market size is provided in terms of value, measured in Million.
11. Are there any specific market keywords associated with the report?
Yes, the market keyword associated with the report is "Controlled Release Drug Delivery Industry," which aids in identifying and referencing the specific market segment covered.
12. How do I determine which pricing option suits my needs best?
The pricing options vary based on user requirements and access needs. Individual users may opt for single-user licenses, while businesses requiring broader access may choose multi-user or enterprise licenses for cost-effective access to the report.
13. Are there any additional resources or data provided in the Controlled Release Drug Delivery Industry report?
While the report offers comprehensive insights, it's advisable to review the specific contents or supplementary materials provided to ascertain if additional resources or data are available.
14. How can I stay updated on further developments or reports in the Controlled Release Drug Delivery Industry?
To stay informed about further developments, trends, and reports in the Controlled Release Drug Delivery Industry, consider subscribing to industry newsletters, following relevant companies and organizations, or regularly checking reputable industry news sources and publications.
Methodology
Step 1 - Identification of Relevant Samples Size from Population Database


Step 2 - Approaches for Defining Global Market Size (Value, Volume* & Price*)

Note*: In applicable scenarios
Step 3 - Data Sources
Primary Research
- Web Analytics
- Survey Reports
- Research Institute
- Latest Research Reports
- Opinion Leaders
Secondary Research
- Annual Reports
- White Paper
- Latest Press Release
- Industry Association
- Paid Database
- Investor Presentations

Step 4 - Data Triangulation
Involves using different sources of information in order to increase the validity of a study
These sources are likely to be stakeholders in a program - participants, other researchers, program staff, other community members, and so on.
Then we put all data in single framework & apply various statistical tools to find out the dynamic on the market.
During the analysis stage, feedback from the stakeholder groups would be compared to determine areas of agreement as well as areas of divergence


