
Key Insights
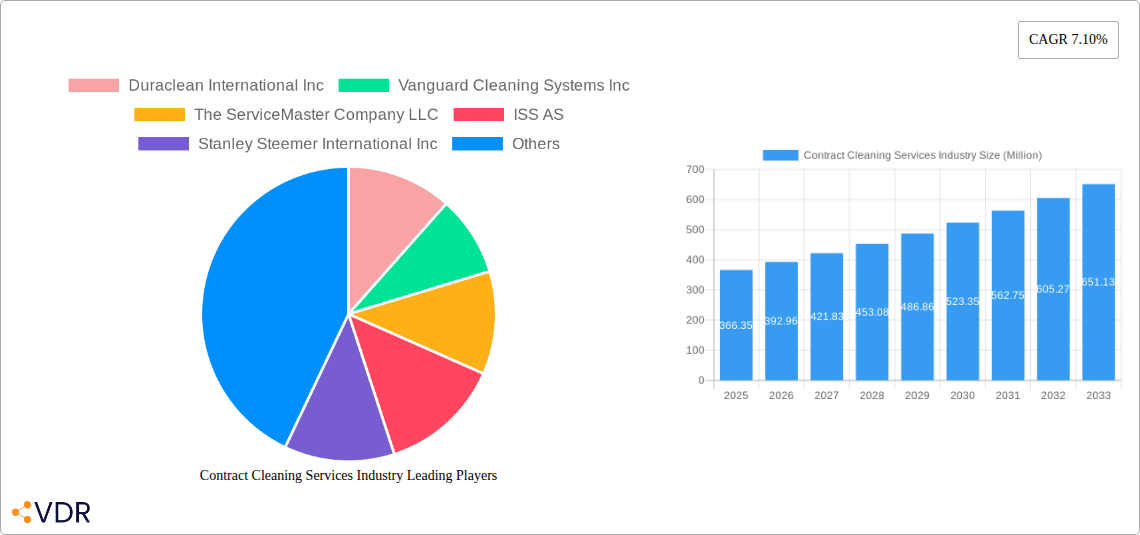
The contract cleaning services market, valued at $366.35 million in 2025, is experiencing robust growth, projected to expand at a Compound Annual Growth Rate (CAGR) of 7.10% from 2025 to 2033. This growth is fueled by several key factors. Increased urbanization and the rise of commercial real estate necessitate professional cleaning services, driving demand across residential, commercial, and industrial segments. Stringent hygiene regulations in healthcare and hospitality sectors further contribute to market expansion. Growing awareness of workplace hygiene and the importance of a healthy environment are also pushing businesses to outsource cleaning services. Technological advancements, such as the introduction of automated cleaning equipment and eco-friendly cleaning solutions, are enhancing efficiency and sustainability, boosting market attractiveness. The industry is also witnessing consolidation, with larger companies acquiring smaller firms, leading to enhanced service offerings and market reach. However, factors like fluctuating labor costs and economic downturns could potentially restrain market growth.
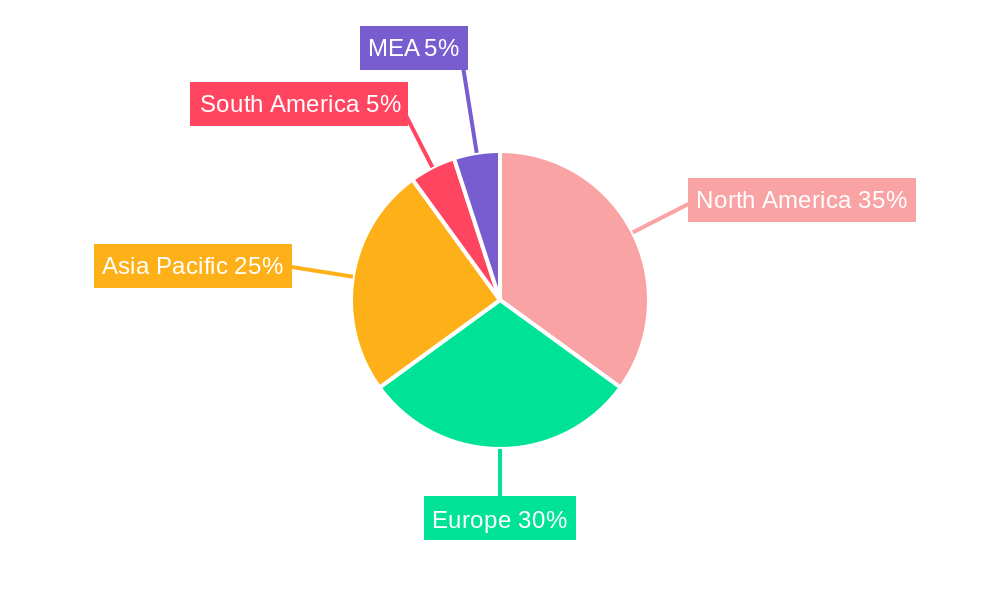
The market segmentation reveals a diverse landscape. While specific data on segment shares is unavailable, we can infer that the commercial sector likely holds the largest market share due to the high concentration of office buildings, retail spaces, and hospitality venues requiring regular cleaning services. The industrial segment is also anticipated to showcase considerable growth, driven by the demand for specialized cleaning solutions in manufacturing and production facilities. The residential segment, while important, may exhibit slower growth compared to the others due to its comparatively smaller average contract size. Geographically, North America and Europe currently hold significant market shares, reflecting high adoption rates and established service providers. However, the Asia-Pacific region is projected to display strong growth potential due to rapid urbanization and economic expansion. Key players like Duraclean International Inc, Vanguard Cleaning Systems Inc, and ServiceMaster are leveraging strategic partnerships and technological innovations to strengthen their market positions and compete effectively in this dynamic industry.
This comprehensive report provides an in-depth analysis of the Contract Cleaning Services Industry, covering market dynamics, growth trends, key players, and future outlook. With a focus on the parent market (Cleaning Services) and child markets (Residential, Commercial, Industrial cleaning), this report offers invaluable insights for industry professionals, investors, and strategic decision-makers. The report utilizes data from 2019-2024 (Historical Period) and projects to 2033 (Forecast Period), with 2025 serving as the base and estimated year. Market values are presented in millions of units.
Contract Cleaning Services Industry Market Dynamics & Structure
The contract cleaning services market is characterized by moderate concentration, with a few large players and numerous smaller regional operators. Market size in 2024 was estimated at $XX Million. Technological innovation, particularly in robotics and sustainable cleaning solutions, is a key driver. Stringent regulatory frameworks regarding hygiene and safety standards significantly influence operations. Competitive substitutes include in-house cleaning teams and self-service cleaning solutions. End-user demographics, including the growing prevalence of commercial spaces and increased awareness of hygiene, contribute to market growth. M&A activity remains moderate, with approximately XX deals recorded between 2019-2024, resulting in a xx% market share shift amongst the top 10 players.
- Market Concentration: Moderately concentrated, with top 10 players holding approximately 60% market share.
- Technological Innovation: Robotics, AI-powered cleaning solutions, and sustainable cleaning products are key drivers.
- Regulatory Framework: Stringent hygiene and safety regulations impact operational costs and strategies.
- Competitive Substitutes: In-house cleaning teams and self-service cleaning solutions present competition.
- End-User Demographics: Growth in commercial and industrial sectors fuels demand.
- M&A Trends: Moderate activity with a focus on expansion and technological integration.
Contract Cleaning Services Industry Growth Trends & Insights
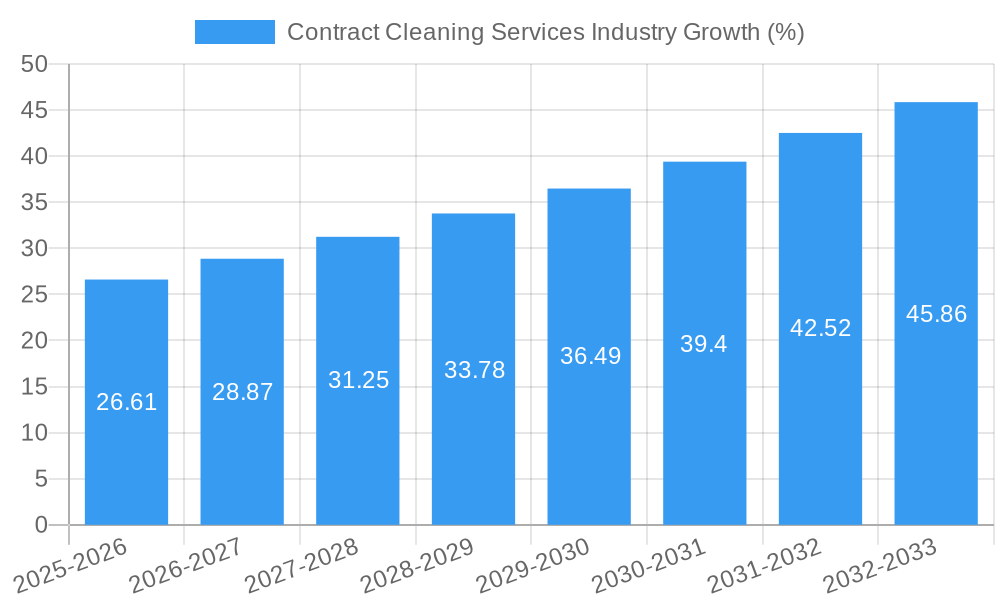
The contract cleaning services market experienced steady growth between 2019 and 2024, with a CAGR of xx%. This growth is attributed to several factors including increased awareness of hygiene, rising demand from commercial and industrial sectors, and technological advancements. Market penetration in key regions remains relatively high in developed countries while showing significant growth potential in emerging markets. Technological disruptions, particularly the adoption of robotic cleaning systems, are expected to further boost efficiency and reduce costs, leading to market expansion. Shifting consumer behavior toward premium services and sustainability concerns are also shaping the market. The overall market size is projected to reach $XX Million by 2033.
Dominant Regions, Countries, or Segments in Contract Cleaning Services Industry
The Commercial segment dominates the contract cleaning services market, accounting for approximately 65% of the total market value in 2024. This dominance is primarily driven by the continuous expansion of commercial real estate, the increasing demand for professional cleaning services in office buildings, retail spaces, and healthcare facilities, and stricter hygiene standards in these settings. North America and Europe continue to be the leading regions, driven by robust economies, high awareness of hygiene, and a well-established cleaning services sector. However, Asia-Pacific exhibits the highest growth potential due to rapid urbanization and industrialization.
- Key Drivers (Commercial Segment):
- Growing commercial real estate sector
- Increased emphasis on workplace hygiene and safety
- Stringent regulatory compliance requirements
- Demand for specialized cleaning services (e.g., medical facilities)
- Dominance Factors:
- High market share
- Consistent growth trajectory
- Strong presence of major players
- Diverse range of service offerings.
Contract Cleaning Services Industry Product Landscape
The product landscape is evolving rapidly, with a shift towards eco-friendly and technologically advanced cleaning solutions. Innovations include robotic cleaning systems, automated floor scrubbers, and specialized cleaning chemicals formulated for specific applications and surfaces. These products offer enhanced efficiency, reduced environmental impact, and improved cleaning performance. Key selling propositions focus on reduced operational costs, improved hygiene standards, and sustainable practices.
Key Drivers, Barriers & Challenges in Contract Cleaning Services Industry
Key Drivers:
- Increased focus on hygiene and sanitation.
- Growth of commercial and industrial sectors.
- Technological advancements in cleaning equipment and solutions.
- Stringent government regulations promoting workplace safety.
Challenges & Restraints:
- Fluctuating labor costs and availability.
- Intense competition from smaller players.
- Price sensitivity among certain end-users.
- Regulatory compliance complexities and associated costs.
- Supply chain disruptions impacting raw material costs.
Emerging Opportunities in Contract Cleaning Services Industry
- Untapped markets: Expanding into developing economies and rural areas.
- Innovative applications: Specialised cleaning solutions for specific sectors (e.g., data centers).
- Evolving consumer preferences: Growing demand for green cleaning solutions and specialized services.
- Technological advancements: Integration of AI, IoT, and robotics in cleaning operations.
Growth Accelerators in the Contract Cleaning Services Industry
Technological breakthroughs in robotics and AI-driven cleaning solutions are key drivers of long-term growth. Strategic partnerships between cleaning service providers and technology companies are also contributing to the development of innovative and efficient solutions. Market expansion into underserved regions and the development of specialized cleaning services for niche sectors are further fueling growth.
Key Players Shaping the Contract Cleaning Services Industry Market
- Duraclean International Inc
- Vanguard Cleaning Systems Inc
- The ServiceMaster Company LLC
- ISS AS
- Stanley Steemer International Inc
- Pritchard Industries Inc
- Sodexo Group
- ABM Industries Incorporated
- Anago Cleaning Systems Inc
- Jani-King International Inc
Notable Milestones in Contract Cleaning Services Industry Sector
- October 2022: SBFM secures a five-year contract with PureGym, signifying the growing demand for commercial cleaning services in the fitness industry.
- July 2022: Gausium and Diversey-TASKI's global partnership accelerates the adoption of robotic cleaning solutions, highlighting the industry's move toward automation.
In-Depth Contract Cleaning Services Industry Market Outlook
The contract cleaning services market is poised for significant growth in the coming years, driven by technological innovation, increasing awareness of hygiene, and expansion into new markets. Strategic partnerships, investment in technology, and a focus on sustainable practices will be crucial for companies to capitalize on the growth opportunities presented by this evolving market. The market is expected to reach $XX Million by 2033, representing a substantial increase from the 2024 figures.
Contract Cleaning Services Industry Segmentation
-
1. End User
- 1.1. Residential
- 1.2. Commercial
- 1.3. Industrial
Contract Cleaning Services Industry Segmentation By Geography
- 1. North America
- 2. Europe
- 3. Asia Pacific
- 4. Latin America
- 5. Middle East and Africa
Contract Cleaning Services Industry REPORT HIGHLIGHTS
| Aspects | Details |
|---|---|
| Study Period | 2019-2033 |
| Base Year | 2024 |
| Estimated Year | 2025 |
| Forecast Period | 2025-2033 |
| Historical Period | 2019-2024 |
| Growth Rate | CAGR of 7.10% from 2019-2033 |
| Segmentation |
|
Table of Contents
- 1. Introduction
- 1.1. Research Scope
- 1.2. Market Segmentation
- 1.3. Research Methodology
- 1.4. Definitions and Assumptions
- 2. Executive Summary
- 2.1. Introduction
- 3. Market Dynamics
- 3.1. Introduction
- 3.2. Market Drivers
- 3.2.1. Increasing Hygienic Consciousness
- 3.3. Market Restrains
- 3.3.1. Lack of Skilled Workforce
- 3.4. Market Trends
- 3.4.1. Commercial Cleaning is Expected to Hold a Significant Share
- 4. Market Factor Analysis
- 4.1. Porters Five Forces
- 4.2. Supply/Value Chain
- 4.3. PESTEL analysis
- 4.4. Market Entropy
- 4.5. Patent/Trademark Analysis
- 5. Global Contract Cleaning Services Industry Analysis, Insights and Forecast, 2019-2031
- 5.1. Market Analysis, Insights and Forecast - by End User
- 5.1.1. Residential
- 5.1.2. Commercial
- 5.1.3. Industrial
- 5.2. Market Analysis, Insights and Forecast - by Region
- 5.2.1. North America
- 5.2.2. Europe
- 5.2.3. Asia Pacific
- 5.2.4. Latin America
- 5.2.5. Middle East and Africa
- 5.1. Market Analysis, Insights and Forecast - by End User
- 6. North America Contract Cleaning Services Industry Analysis, Insights and Forecast, 2019-2031
- 6.1. Market Analysis, Insights and Forecast - by End User
- 6.1.1. Residential
- 6.1.2. Commercial
- 6.1.3. Industrial
- 6.1. Market Analysis, Insights and Forecast - by End User
- 7. Europe Contract Cleaning Services Industry Analysis, Insights and Forecast, 2019-2031
- 7.1. Market Analysis, Insights and Forecast - by End User
- 7.1.1. Residential
- 7.1.2. Commercial
- 7.1.3. Industrial
- 7.1. Market Analysis, Insights and Forecast - by End User
- 8. Asia Pacific Contract Cleaning Services Industry Analysis, Insights and Forecast, 2019-2031
- 8.1. Market Analysis, Insights and Forecast - by End User
- 8.1.1. Residential
- 8.1.2. Commercial
- 8.1.3. Industrial
- 8.1. Market Analysis, Insights and Forecast - by End User
- 9. Latin America Contract Cleaning Services Industry Analysis, Insights and Forecast, 2019-2031
- 9.1. Market Analysis, Insights and Forecast - by End User
- 9.1.1. Residential
- 9.1.2. Commercial
- 9.1.3. Industrial
- 9.1. Market Analysis, Insights and Forecast - by End User
- 10. Middle East and Africa Contract Cleaning Services Industry Analysis, Insights and Forecast, 2019-2031
- 10.1. Market Analysis, Insights and Forecast - by End User
- 10.1.1. Residential
- 10.1.2. Commercial
- 10.1.3. Industrial
- 10.1. Market Analysis, Insights and Forecast - by End User
- 11. North America Contract Cleaning Services Industry Analysis, Insights and Forecast, 2019-2031
- 11.1. Market Analysis, Insights and Forecast - By Country/Sub-region
- 11.1.1. undefined
- 12. Europe Contract Cleaning Services Industry Analysis, Insights and Forecast, 2019-2031
- 12.1. Market Analysis, Insights and Forecast - By Country/Sub-region
- 12.1.1. undefined
- 13. Asia Pacific Contract Cleaning Services Industry Analysis, Insights and Forecast, 2019-2031
- 13.1. Market Analysis, Insights and Forecast - By Country/Sub-region
- 13.1.1. undefined
- 14. South America Contract Cleaning Services Industry Analysis, Insights and Forecast, 2019-2031
- 14.1. Market Analysis, Insights and Forecast - By Country/Sub-region
- 14.1.1. undefined
- 15. North America Contract Cleaning Services Industry Analysis, Insights and Forecast, 2019-2031
- 15.1. Market Analysis, Insights and Forecast - By Country/Sub-region
- 15.1.1. undefined
- 16. MEA Contract Cleaning Services Industry Analysis, Insights and Forecast, 2019-2031
- 16.1. Market Analysis, Insights and Forecast - By Country/Sub-region
- 16.1.1. undefined
- 17. Competitive Analysis
- 17.1. Global Market Share Analysis 2024
- 17.2. Company Profiles
- 17.2.1 Duraclean International Inc
- 17.2.1.1. Overview
- 17.2.1.2. Products
- 17.2.1.3. SWOT Analysis
- 17.2.1.4. Recent Developments
- 17.2.1.5. Financials (Based on Availability)
- 17.2.2 Vanguard Cleaning Systems Inc
- 17.2.2.1. Overview
- 17.2.2.2. Products
- 17.2.2.3. SWOT Analysis
- 17.2.2.4. Recent Developments
- 17.2.2.5. Financials (Based on Availability)
- 17.2.3 The ServiceMaster Company LLC
- 17.2.3.1. Overview
- 17.2.3.2. Products
- 17.2.3.3. SWOT Analysis
- 17.2.3.4. Recent Developments
- 17.2.3.5. Financials (Based on Availability)
- 17.2.4 ISS AS
- 17.2.4.1. Overview
- 17.2.4.2. Products
- 17.2.4.3. SWOT Analysis
- 17.2.4.4. Recent Developments
- 17.2.4.5. Financials (Based on Availability)
- 17.2.5 Stanley Steemer International Inc
- 17.2.5.1. Overview
- 17.2.5.2. Products
- 17.2.5.3. SWOT Analysis
- 17.2.5.4. Recent Developments
- 17.2.5.5. Financials (Based on Availability)
- 17.2.6 Pritchard Industries Inc
- 17.2.6.1. Overview
- 17.2.6.2. Products
- 17.2.6.3. SWOT Analysis
- 17.2.6.4. Recent Developments
- 17.2.6.5. Financials (Based on Availability)
- 17.2.7 Sodexo Group
- 17.2.7.1. Overview
- 17.2.7.2. Products
- 17.2.7.3. SWOT Analysis
- 17.2.7.4. Recent Developments
- 17.2.7.5. Financials (Based on Availability)
- 17.2.8 ABM Industries Incorporated
- 17.2.8.1. Overview
- 17.2.8.2. Products
- 17.2.8.3. SWOT Analysis
- 17.2.8.4. Recent Developments
- 17.2.8.5. Financials (Based on Availability)
- 17.2.9 Anago Cleaning Systems Inc
- 17.2.9.1. Overview
- 17.2.9.2. Products
- 17.2.9.3. SWOT Analysis
- 17.2.9.4. Recent Developments
- 17.2.9.5. Financials (Based on Availability)
- 17.2.10 Jani-King International Inc
- 17.2.10.1. Overview
- 17.2.10.2. Products
- 17.2.10.3. SWOT Analysis
- 17.2.10.4. Recent Developments
- 17.2.10.5. Financials (Based on Availability)
- 17.2.1 Duraclean International Inc
List of Figures
- Figure 1: Global Contract Cleaning Services Industry Revenue Breakdown (Million, %) by Region 2024 & 2032
- Figure 2: Global Contract Cleaning Services Industry Volume Breakdown (K Unit, %) by Region 2024 & 2032
- Figure 3: North America Contract Cleaning Services Industry Revenue (Million), by Country 2024 & 2032
- Figure 4: North America Contract Cleaning Services Industry Volume (K Unit), by Country 2024 & 2032
- Figure 5: North America Contract Cleaning Services Industry Revenue Share (%), by Country 2024 & 2032
- Figure 6: North America Contract Cleaning Services Industry Volume Share (%), by Country 2024 & 2032
- Figure 7: Europe Contract Cleaning Services Industry Revenue (Million), by Country 2024 & 2032
- Figure 8: Europe Contract Cleaning Services Industry Volume (K Unit), by Country 2024 & 2032
- Figure 9: Europe Contract Cleaning Services Industry Revenue Share (%), by Country 2024 & 2032
- Figure 10: Europe Contract Cleaning Services Industry Volume Share (%), by Country 2024 & 2032
- Figure 11: Asia Pacific Contract Cleaning Services Industry Revenue (Million), by Country 2024 & 2032
- Figure 12: Asia Pacific Contract Cleaning Services Industry Volume (K Unit), by Country 2024 & 2032
- Figure 13: Asia Pacific Contract Cleaning Services Industry Revenue Share (%), by Country 2024 & 2032
- Figure 14: Asia Pacific Contract Cleaning Services Industry Volume Share (%), by Country 2024 & 2032
- Figure 15: South America Contract Cleaning Services Industry Revenue (Million), by Country 2024 & 2032
- Figure 16: South America Contract Cleaning Services Industry Volume (K Unit), by Country 2024 & 2032
- Figure 17: South America Contract Cleaning Services Industry Revenue Share (%), by Country 2024 & 2032
- Figure 18: South America Contract Cleaning Services Industry Volume Share (%), by Country 2024 & 2032
- Figure 19: North America Contract Cleaning Services Industry Revenue (Million), by Country 2024 & 2032
- Figure 20: North America Contract Cleaning Services Industry Volume (K Unit), by Country 2024 & 2032
- Figure 21: North America Contract Cleaning Services Industry Revenue Share (%), by Country 2024 & 2032
- Figure 22: North America Contract Cleaning Services Industry Volume Share (%), by Country 2024 & 2032
- Figure 23: MEA Contract Cleaning Services Industry Revenue (Million), by Country 2024 & 2032
- Figure 24: MEA Contract Cleaning Services Industry Volume (K Unit), by Country 2024 & 2032
- Figure 25: MEA Contract Cleaning Services Industry Revenue Share (%), by Country 2024 & 2032
- Figure 26: MEA Contract Cleaning Services Industry Volume Share (%), by Country 2024 & 2032
- Figure 27: North America Contract Cleaning Services Industry Revenue (Million), by End User 2024 & 2032
- Figure 28: North America Contract Cleaning Services Industry Volume (K Unit), by End User 2024 & 2032
- Figure 29: North America Contract Cleaning Services Industry Revenue Share (%), by End User 2024 & 2032
- Figure 30: North America Contract Cleaning Services Industry Volume Share (%), by End User 2024 & 2032
- Figure 31: North America Contract Cleaning Services Industry Revenue (Million), by Country 2024 & 2032
- Figure 32: North America Contract Cleaning Services Industry Volume (K Unit), by Country 2024 & 2032
- Figure 33: North America Contract Cleaning Services Industry Revenue Share (%), by Country 2024 & 2032
- Figure 34: North America Contract Cleaning Services Industry Volume Share (%), by Country 2024 & 2032
- Figure 35: Europe Contract Cleaning Services Industry Revenue (Million), by End User 2024 & 2032
- Figure 36: Europe Contract Cleaning Services Industry Volume (K Unit), by End User 2024 & 2032
- Figure 37: Europe Contract Cleaning Services Industry Revenue Share (%), by End User 2024 & 2032
- Figure 38: Europe Contract Cleaning Services Industry Volume Share (%), by End User 2024 & 2032
- Figure 39: Europe Contract Cleaning Services Industry Revenue (Million), by Country 2024 & 2032
- Figure 40: Europe Contract Cleaning Services Industry Volume (K Unit), by Country 2024 & 2032
- Figure 41: Europe Contract Cleaning Services Industry Revenue Share (%), by Country 2024 & 2032
- Figure 42: Europe Contract Cleaning Services Industry Volume Share (%), by Country 2024 & 2032
- Figure 43: Asia Pacific Contract Cleaning Services Industry Revenue (Million), by End User 2024 & 2032
- Figure 44: Asia Pacific Contract Cleaning Services Industry Volume (K Unit), by End User 2024 & 2032
- Figure 45: Asia Pacific Contract Cleaning Services Industry Revenue Share (%), by End User 2024 & 2032
- Figure 46: Asia Pacific Contract Cleaning Services Industry Volume Share (%), by End User 2024 & 2032
- Figure 47: Asia Pacific Contract Cleaning Services Industry Revenue (Million), by Country 2024 & 2032
- Figure 48: Asia Pacific Contract Cleaning Services Industry Volume (K Unit), by Country 2024 & 2032
- Figure 49: Asia Pacific Contract Cleaning Services Industry Revenue Share (%), by Country 2024 & 2032
- Figure 50: Asia Pacific Contract Cleaning Services Industry Volume Share (%), by Country 2024 & 2032
- Figure 51: Latin America Contract Cleaning Services Industry Revenue (Million), by End User 2024 & 2032
- Figure 52: Latin America Contract Cleaning Services Industry Volume (K Unit), by End User 2024 & 2032
- Figure 53: Latin America Contract Cleaning Services Industry Revenue Share (%), by End User 2024 & 2032
- Figure 54: Latin America Contract Cleaning Services Industry Volume Share (%), by End User 2024 & 2032
- Figure 55: Latin America Contract Cleaning Services Industry Revenue (Million), by Country 2024 & 2032
- Figure 56: Latin America Contract Cleaning Services Industry Volume (K Unit), by Country 2024 & 2032
- Figure 57: Latin America Contract Cleaning Services Industry Revenue Share (%), by Country 2024 & 2032
- Figure 58: Latin America Contract Cleaning Services Industry Volume Share (%), by Country 2024 & 2032
- Figure 59: Middle East and Africa Contract Cleaning Services Industry Revenue (Million), by End User 2024 & 2032
- Figure 60: Middle East and Africa Contract Cleaning Services Industry Volume (K Unit), by End User 2024 & 2032
- Figure 61: Middle East and Africa Contract Cleaning Services Industry Revenue Share (%), by End User 2024 & 2032
- Figure 62: Middle East and Africa Contract Cleaning Services Industry Volume Share (%), by End User 2024 & 2032
- Figure 63: Middle East and Africa Contract Cleaning Services Industry Revenue (Million), by Country 2024 & 2032
- Figure 64: Middle East and Africa Contract Cleaning Services Industry Volume (K Unit), by Country 2024 & 2032
- Figure 65: Middle East and Africa Contract Cleaning Services Industry Revenue Share (%), by Country 2024 & 2032
- Figure 66: Middle East and Africa Contract Cleaning Services Industry Volume Share (%), by Country 2024 & 2032
List of Tables
- Table 1: Global Contract Cleaning Services Industry Revenue Million Forecast, by Region 2019 & 2032
- Table 2: Global Contract Cleaning Services Industry Volume K Unit Forecast, by Region 2019 & 2032
- Table 3: Global Contract Cleaning Services Industry Revenue Million Forecast, by End User 2019 & 2032
- Table 4: Global Contract Cleaning Services Industry Volume K Unit Forecast, by End User 2019 & 2032
- Table 5: Global Contract Cleaning Services Industry Revenue Million Forecast, by Region 2019 & 2032
- Table 6: Global Contract Cleaning Services Industry Volume K Unit Forecast, by Region 2019 & 2032
- Table 7: Global Contract Cleaning Services Industry Revenue Million Forecast, by Country 2019 & 2032
- Table 8: Global Contract Cleaning Services Industry Volume K Unit Forecast, by Country 2019 & 2032
- Table 9: Global Contract Cleaning Services Industry Revenue Million Forecast, by Country 2019 & 2032
- Table 10: Global Contract Cleaning Services Industry Volume K Unit Forecast, by Country 2019 & 2032
- Table 11: Global Contract Cleaning Services Industry Revenue Million Forecast, by Country 2019 & 2032
- Table 12: Global Contract Cleaning Services Industry Volume K Unit Forecast, by Country 2019 & 2032
- Table 13: Global Contract Cleaning Services Industry Revenue Million Forecast, by Country 2019 & 2032
- Table 14: Global Contract Cleaning Services Industry Volume K Unit Forecast, by Country 2019 & 2032
- Table 15: Global Contract Cleaning Services Industry Revenue Million Forecast, by Country 2019 & 2032
- Table 16: Global Contract Cleaning Services Industry Volume K Unit Forecast, by Country 2019 & 2032
- Table 17: Global Contract Cleaning Services Industry Revenue Million Forecast, by Country 2019 & 2032
- Table 18: Global Contract Cleaning Services Industry Volume K Unit Forecast, by Country 2019 & 2032
- Table 19: Global Contract Cleaning Services Industry Revenue Million Forecast, by End User 2019 & 2032
- Table 20: Global Contract Cleaning Services Industry Volume K Unit Forecast, by End User 2019 & 2032
- Table 21: Global Contract Cleaning Services Industry Revenue Million Forecast, by Country 2019 & 2032
- Table 22: Global Contract Cleaning Services Industry Volume K Unit Forecast, by Country 2019 & 2032
- Table 23: Global Contract Cleaning Services Industry Revenue Million Forecast, by End User 2019 & 2032
- Table 24: Global Contract Cleaning Services Industry Volume K Unit Forecast, by End User 2019 & 2032
- Table 25: Global Contract Cleaning Services Industry Revenue Million Forecast, by Country 2019 & 2032
- Table 26: Global Contract Cleaning Services Industry Volume K Unit Forecast, by Country 2019 & 2032
- Table 27: Global Contract Cleaning Services Industry Revenue Million Forecast, by End User 2019 & 2032
- Table 28: Global Contract Cleaning Services Industry Volume K Unit Forecast, by End User 2019 & 2032
- Table 29: Global Contract Cleaning Services Industry Revenue Million Forecast, by Country 2019 & 2032
- Table 30: Global Contract Cleaning Services Industry Volume K Unit Forecast, by Country 2019 & 2032
- Table 31: Global Contract Cleaning Services Industry Revenue Million Forecast, by End User 2019 & 2032
- Table 32: Global Contract Cleaning Services Industry Volume K Unit Forecast, by End User 2019 & 2032
- Table 33: Global Contract Cleaning Services Industry Revenue Million Forecast, by Country 2019 & 2032
- Table 34: Global Contract Cleaning Services Industry Volume K Unit Forecast, by Country 2019 & 2032
- Table 35: Global Contract Cleaning Services Industry Revenue Million Forecast, by End User 2019 & 2032
- Table 36: Global Contract Cleaning Services Industry Volume K Unit Forecast, by End User 2019 & 2032
- Table 37: Global Contract Cleaning Services Industry Revenue Million Forecast, by Country 2019 & 2032
- Table 38: Global Contract Cleaning Services Industry Volume K Unit Forecast, by Country 2019 & 2032
Frequently Asked Questions
1. What is the projected Compound Annual Growth Rate (CAGR) of the Contract Cleaning Services Industry?
The projected CAGR is approximately 7.10%.
2. Which companies are prominent players in the Contract Cleaning Services Industry?
Key companies in the market include Duraclean International Inc, Vanguard Cleaning Systems Inc, The ServiceMaster Company LLC, ISS AS, Stanley Steemer International Inc, Pritchard Industries Inc, Sodexo Group, ABM Industries Incorporated, Anago Cleaning Systems Inc, Jani-King International Inc.
3. What are the main segments of the Contract Cleaning Services Industry?
The market segments include End User.
4. Can you provide details about the market size?
The market size is estimated to be USD 366.35 Million as of 2022.
5. What are some drivers contributing to market growth?
Increasing Hygienic Consciousness.
6. What are the notable trends driving market growth?
Commercial Cleaning is Expected to Hold a Significant Share.
7. Are there any restraints impacting market growth?
Lack of Skilled Workforce.
8. Can you provide examples of recent developments in the market?
October 2022 - With a five-year deal, SBFM plans to provide a full range of commercial cleaning services to PureGym, the largest gym operator in the United Kingdom, at all its UK locations. The contract began on September 1, 2022, and SBFM and PureGym have their main offices in Leeds. With 1.7 million members spread across 525 clubs, primarily in the United Kingdom and Europe, PureGym's venues are usually open. The group recently revealed ambitions to increase the number of clubs in its portfolio by a factor of two, intending to have more than 1,000 clubs worldwide by 2030..
9. What pricing options are available for accessing the report?
Pricing options include single-user, multi-user, and enterprise licenses priced at USD 4750, USD 5250, and USD 8750 respectively.
10. Is the market size provided in terms of value or volume?
The market size is provided in terms of value, measured in Million and volume, measured in K Unit.
11. Are there any specific market keywords associated with the report?
Yes, the market keyword associated with the report is "Contract Cleaning Services Industry," which aids in identifying and referencing the specific market segment covered.
12. How do I determine which pricing option suits my needs best?
The pricing options vary based on user requirements and access needs. Individual users may opt for single-user licenses, while businesses requiring broader access may choose multi-user or enterprise licenses for cost-effective access to the report.
13. Are there any additional resources or data provided in the Contract Cleaning Services Industry report?
While the report offers comprehensive insights, it's advisable to review the specific contents or supplementary materials provided to ascertain if additional resources or data are available.
14. How can I stay updated on further developments or reports in the Contract Cleaning Services Industry?
To stay informed about further developments, trends, and reports in the Contract Cleaning Services Industry, consider subscribing to industry newsletters, following relevant companies and organizations, or regularly checking reputable industry news sources and publications.
Methodology
Step 1 - Identification of Relevant Samples Size from Population Database


Step 2 - Approaches for Defining Global Market Size (Value, Volume* & Price*)

Note*: In applicable scenarios
Step 3 - Data Sources
Primary Research
- Web Analytics
- Survey Reports
- Research Institute
- Latest Research Reports
- Opinion Leaders
Secondary Research
- Annual Reports
- White Paper
- Latest Press Release
- Industry Association
- Paid Database
- Investor Presentations

Step 4 - Data Triangulation
Involves using different sources of information in order to increase the validity of a study
These sources are likely to be stakeholders in a program - participants, other researchers, program staff, other community members, and so on.
Then we put all data in single framework & apply various statistical tools to find out the dynamic on the market.
During the analysis stage, feedback from the stakeholder groups would be compared to determine areas of agreement as well as areas of divergence


