
Key Insights
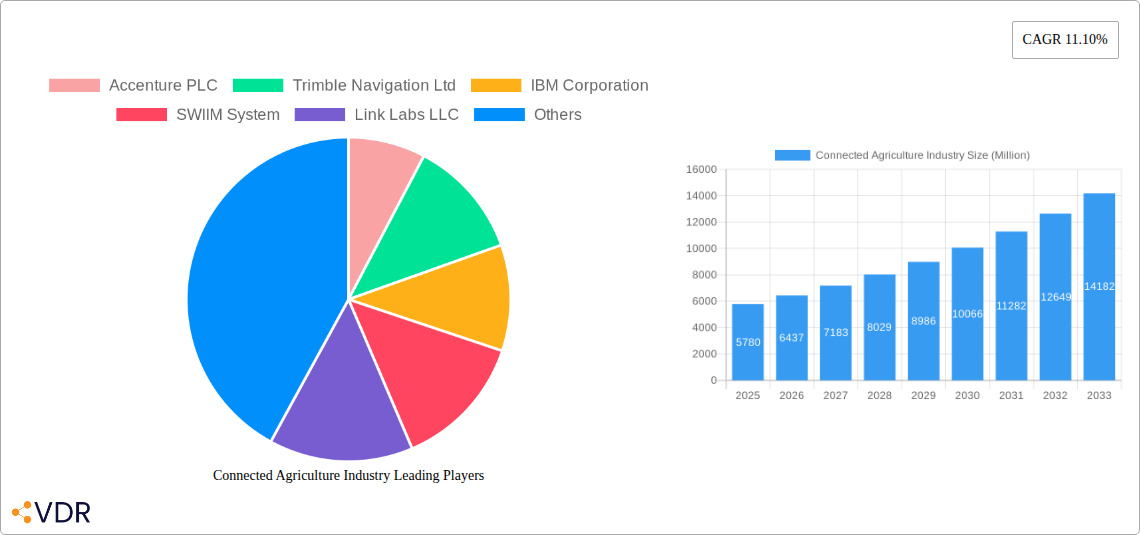
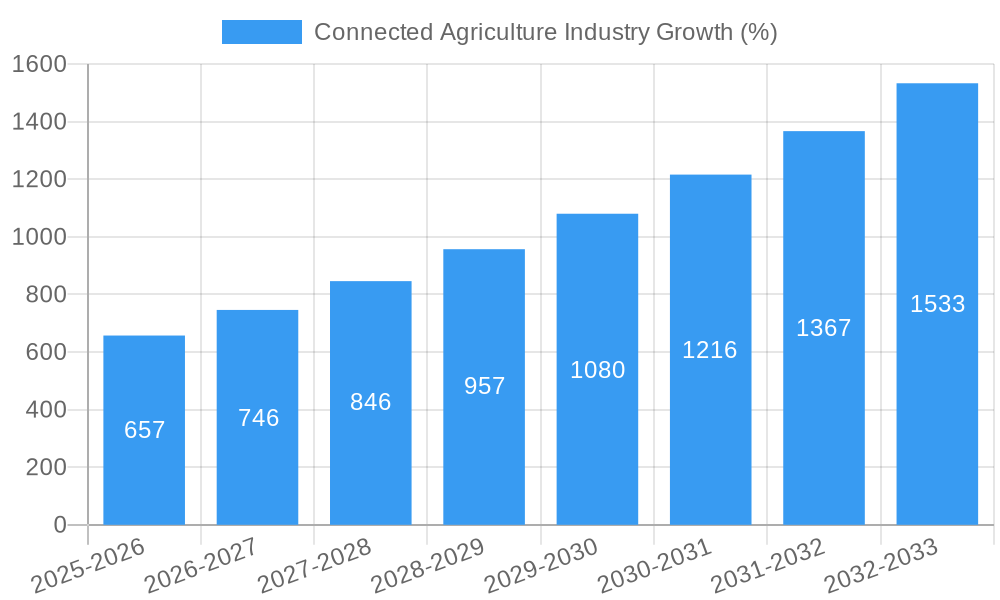
The Connected Agriculture market is experiencing robust growth, projected to reach \$5.78 billion in 2025 and exhibiting a Compound Annual Growth Rate (CAGR) of 11.10% from 2025 to 2033. This expansion is fueled by several key drivers. Increasing demand for enhanced efficiency and productivity in farming, coupled with the rising adoption of precision agriculture techniques, are significantly boosting market growth. The integration of IoT devices, enabling real-time data collection and analysis for better crop management, irrigation scheduling, and livestock monitoring, is a major catalyst. Furthermore, government initiatives promoting technological advancements in agriculture and increasing investments in research and development are fostering innovation and market expansion. The market segments are witnessing diverse growth patterns. Solutions, including software and hardware components, are expected to maintain a strong market share, driven by the growing need for integrated platforms offering data analysis and management tools. Similarly, services focused on supervisory control will see increased demand as farmers require expert support for the implementation and maintenance of connected agriculture technologies. Smart irrigation, aiming for optimized water usage, presents a significant application segment within the connected agriculture space, and the demand for smart logistics solutions in the agricultural supply chain is anticipated to grow substantially.
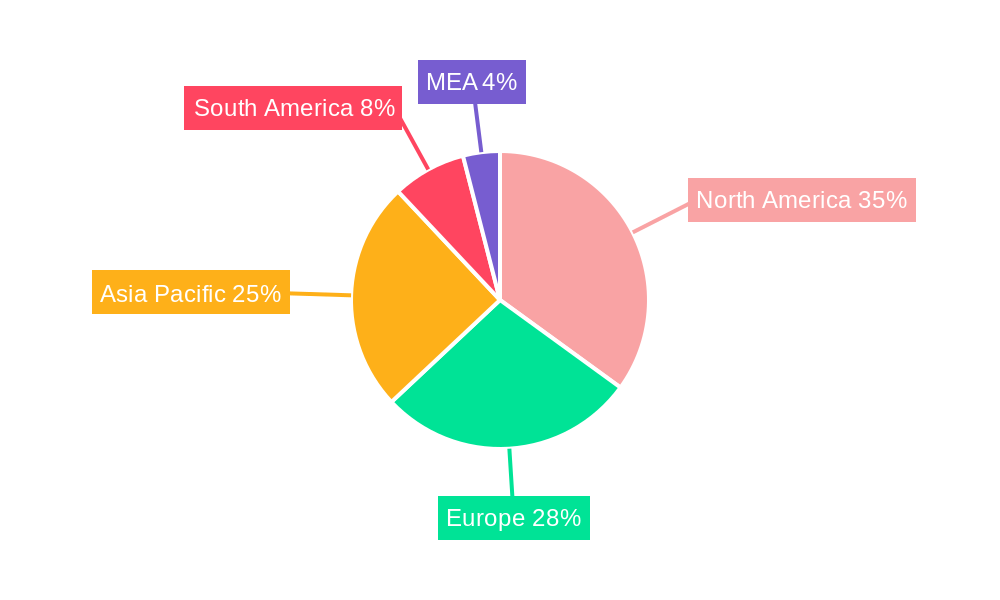
Geographic market penetration varies considerably. North America, driven by early adoption of technological advancements and a well-established agricultural infrastructure, commands a substantial share of the market. However, the Asia-Pacific region exhibits significant growth potential, propelled by the rapid expansion of the agricultural sector and increasing government support for technological adoption in farming practices. Europe, while maintaining a considerable market presence, faces slower growth relative to other regions due to varying levels of technological adoption across different countries and established agricultural practices. The competitive landscape is characterized by a diverse range of players, including technology giants like IBM and Microsoft, alongside specialized agricultural technology providers and telecommunication companies. These companies are constantly innovating and expanding their product and service offerings to cater to the evolving needs of farmers and agricultural businesses. The market's future trajectory indicates continued growth, driven by factors such as increasing data analytics capabilities, advancements in artificial intelligence (AI) and machine learning (ML) applications, and the integration of blockchain technology for enhanced supply chain transparency and traceability.
Connected Agriculture Industry Market Report: 2019-2033
This comprehensive report provides an in-depth analysis of the Connected Agriculture industry, encompassing market dynamics, growth trends, regional dominance, product landscape, and key players. With a focus on the parent market of agricultural technology and its child market segments of precision farming and smart agriculture, this report offers invaluable insights for industry professionals, investors, and stakeholders seeking to navigate this rapidly evolving sector. The study period covers 2019-2033, with a base year of 2025 and a forecast period of 2025-2033. Market values are presented in millions of units.
Connected Agriculture Industry Market Dynamics & Structure
The Connected Agriculture market is experiencing substantial growth, driven by technological advancements, increasing demand for efficient farming practices, and supportive government regulations. Market concentration is moderate, with several key players holding significant shares, but also with room for smaller, specialized firms. The market is characterized by intense competition, with companies focusing on innovation and strategic partnerships to gain a competitive edge. Mergers and acquisitions (M&A) activity is significant, indicating consolidation and expansion within the sector. Over the historical period (2019-2024), an estimated xx M&A deals occurred, with an average deal value of xx million.
- Market Concentration: Moderate, with top 5 players holding approximately xx% market share in 2024.
- Technological Innovation Drivers: IoT, AI, Big Data analytics, cloud computing, precision sensors, GPS technology.
- Regulatory Frameworks: Government initiatives promoting sustainable agriculture and technological adoption are fostering market growth. Specific examples include [insert relevant examples of government support for connected agriculture here].
- Competitive Product Substitutes: Traditional farming methods pose a competitive threat, although their efficiency is being increasingly challenged.
- End-User Demographics: Large-scale commercial farms are the primary adopters; however, small and medium-sized farms are increasingly adopting connected agriculture solutions.
- M&A Trends: Consolidation of FMIS providers, partnerships between machinery manufacturers and agtech companies, driving integration of hardware and software solutions.
Connected Agriculture Industry Growth Trends & Insights
The Connected Agriculture market is experiencing robust growth, fueled by technological disruptions and changing consumer behavior. The market size expanded from xx million in 2019 to an estimated xx million in 2024, demonstrating a significant increase. We project a Compound Annual Growth Rate (CAGR) of xx% from 2025 to 2033, reaching a market value of xx million by 2033. Adoption rates are increasing, particularly among large farms seeking to optimize yields and resource management. This trend is driven by increasing awareness of the benefits of data-driven decision-making, improved operational efficiency, and enhanced sustainability practices. Technological advancements like AI-powered predictive analytics and automated machinery are revolutionizing farming practices, driving higher adoption rates. Consumer demand for sustainably produced food further accelerates the market's growth.
Dominant Regions, Countries, or Segments in Connected Agriculture Industry
North America currently holds the largest market share in the Connected Agriculture industry due to the high adoption rates of precision farming technologies and advanced infrastructure. Europe follows closely, benefiting from government support for digitalization in agriculture. Within segments, Smart Irrigation is experiencing the fastest growth, driven by water scarcity concerns and the need for efficient irrigation management. Farming Planning & Management also shows strong growth, reflecting increased demand for data-driven decision-making.
- Key Drivers in North America: High technology adoption rates, strong farmer investment in technology, established agribusiness infrastructure.
- Key Drivers in Europe: Government support for digitalization in agriculture, strong focus on sustainable farming practices, presence of leading technology providers.
- Smart Irrigation Segment Drivers: Water scarcity issues in many regions, high cost of water, increasing awareness of water-efficient irrigation methods.
- Farming Planning & Management Segment Drivers: Growing demand for optimized resource allocation, precise planting and harvesting, data-driven decision-making.
Connected Agriculture Industry Product Landscape
The Connected Agriculture market offers a diverse range of products, including precision farming sensors, IoT-enabled devices, data analytics platforms, and farm management software. Recent innovations focus on AI-powered predictive analytics, automated machinery, and integrated solutions combining hardware and software. These products enhance operational efficiency, reduce resource consumption, and improve crop yields. Key features include real-time data monitoring, remote control capabilities, and data-driven insights for optimal decision-making. Unique selling propositions include ease of use, seamless integration with existing farm systems, and cost-effective solutions.
Key Drivers, Barriers & Challenges in Connected Agriculture Industry
Key Drivers:
- Technological advancements such as IoT, AI, and big data analytics.
- Increasing demand for efficient and sustainable farming practices.
- Government support and incentives for the adoption of connected agriculture technologies.
- Growing awareness of the benefits of data-driven decision-making.
Challenges:
- High initial investment costs for technology adoption, particularly for smaller farms.
- Concerns regarding data security and privacy.
- Lack of internet connectivity and digital literacy in some regions.
- Interoperability issues between different systems and platforms. This results in an estimated xx% loss of productivity in xx% of farms.
Emerging Opportunities in Connected Agriculture Industry
- Untapped markets in developing countries with high agricultural potential.
- Development of new applications for AI and machine learning in precision farming.
- Growing demand for integrated solutions combining hardware and software.
- Increased focus on sustainable agriculture and environmental monitoring.
Growth Accelerators in the Connected Agriculture Industry Industry
Long-term growth in the connected agriculture industry will be driven by continued technological innovation, strategic partnerships between technology providers and agricultural companies, and expansion into new markets. Government support for digitalization in agriculture will also play a crucial role in driving adoption rates and market growth. The increasing demand for sustainable and efficient farming practices further enhances the market's long-term growth potential.
Key Players Shaping the Connected Agriculture Industry Market
- Accenture PLC
- Trimble Navigation Ltd
- IBM Corporation
- SWIIM System
- Link Labs LLC
- Cisco Systems Inc
- Microsoft Corporation
- Orange Business Services
- SAP SE
- Vodafone Group PLC
Notable Milestones in Connected Agriculture Industry Sector
- November 2023: AGCO acquired FarmFacts GmbH, expanding its Farm Management Information Software (FMIS) capabilities.
- September 2023: John Deere and Yara partnered to improve fertilizer use and increase crop yields.
In-Depth Connected Agriculture Industry Market Outlook
The Connected Agriculture market is poised for continued strong growth, driven by technological innovation, increasing adoption rates, and supportive government policies. Strategic partnerships and market expansion will play a crucial role in shaping the industry's future. The integration of AI and big data analytics will further enhance the efficiency and sustainability of farming practices, leading to significant market expansion and growth opportunities for key players. The focus on data-driven decision-making and precision farming techniques will remain a key driver of market growth throughout the forecast period.
Connected Agriculture Industry Segmentation
-
1. Component
-
1.1. Solution
- 1.1.1. Network Management
- 1.1.2. Agriculture Asset Management
- 1.1.3. Supervisory Control
- 1.2. Service
-
1.1. Solution
-
2. Application
- 2.1. Smart Logistics
- 2.2. Smart Irrigation
- 2.3. Farming Planning and Management
Connected Agriculture Industry Segmentation By Geography
-
1. North America
- 1.1. United States
- 1.2. Canada
-
2. Europe
- 2.1. Germany
- 2.2. United Kingdom
- 2.3. France
- 2.4. Rest of Europe
-
3. Asia Pacific
- 3.1. China
- 3.2. Japan
- 3.3. India
- 3.4. Rest of Asia Pacific
- 4. Latin America
- 5. Middle East and Africa
Connected Agriculture Industry REPORT HIGHLIGHTS
| Aspects | Details |
|---|---|
| Study Period | 2019-2033 |
| Base Year | 2024 |
| Estimated Year | 2025 |
| Forecast Period | 2025-2033 |
| Historical Period | 2019-2024 |
| Growth Rate | CAGR of 11.10% from 2019-2033 |
| Segmentation |
|
Table of Contents
- 1. Introduction
- 1.1. Research Scope
- 1.2. Market Segmentation
- 1.3. Research Methodology
- 1.4. Definitions and Assumptions
- 2. Executive Summary
- 2.1. Introduction
- 3. Market Dynamics
- 3.1. Introduction
- 3.2. Market Drivers
- 3.2.1. Emergence of BYOD (Bring Your Own Drone) in Connected Agriculture; Upsurge in Demand for Smart Water Management Systems
- 3.3. Market Restrains
- 3.3.1. Steep Learning Curve Regarding Connected Agriculture
- 3.4. Market Trends
- 3.4.1 By Application
- 3.4.2 Smart Irrigation is Analyzed to Witness Substantial Growth
- 4. Market Factor Analysis
- 4.1. Porters Five Forces
- 4.2. Supply/Value Chain
- 4.3. PESTEL analysis
- 4.4. Market Entropy
- 4.5. Patent/Trademark Analysis
- 5. Global Connected Agriculture Industry Analysis, Insights and Forecast, 2019-2031
- 5.1. Market Analysis, Insights and Forecast - by Component
- 5.1.1. Solution
- 5.1.1.1. Network Management
- 5.1.1.2. Agriculture Asset Management
- 5.1.1.3. Supervisory Control
- 5.1.2. Service
- 5.1.1. Solution
- 5.2. Market Analysis, Insights and Forecast - by Application
- 5.2.1. Smart Logistics
- 5.2.2. Smart Irrigation
- 5.2.3. Farming Planning and Management
- 5.3. Market Analysis, Insights and Forecast - by Region
- 5.3.1. North America
- 5.3.2. Europe
- 5.3.3. Asia Pacific
- 5.3.4. Latin America
- 5.3.5. Middle East and Africa
- 5.1. Market Analysis, Insights and Forecast - by Component
- 6. North America Connected Agriculture Industry Analysis, Insights and Forecast, 2019-2031
- 6.1. Market Analysis, Insights and Forecast - by Component
- 6.1.1. Solution
- 6.1.1.1. Network Management
- 6.1.1.2. Agriculture Asset Management
- 6.1.1.3. Supervisory Control
- 6.1.2. Service
- 6.1.1. Solution
- 6.2. Market Analysis, Insights and Forecast - by Application
- 6.2.1. Smart Logistics
- 6.2.2. Smart Irrigation
- 6.2.3. Farming Planning and Management
- 6.1. Market Analysis, Insights and Forecast - by Component
- 7. Europe Connected Agriculture Industry Analysis, Insights and Forecast, 2019-2031
- 7.1. Market Analysis, Insights and Forecast - by Component
- 7.1.1. Solution
- 7.1.1.1. Network Management
- 7.1.1.2. Agriculture Asset Management
- 7.1.1.3. Supervisory Control
- 7.1.2. Service
- 7.1.1. Solution
- 7.2. Market Analysis, Insights and Forecast - by Application
- 7.2.1. Smart Logistics
- 7.2.2. Smart Irrigation
- 7.2.3. Farming Planning and Management
- 7.1. Market Analysis, Insights and Forecast - by Component
- 8. Asia Pacific Connected Agriculture Industry Analysis, Insights and Forecast, 2019-2031
- 8.1. Market Analysis, Insights and Forecast - by Component
- 8.1.1. Solution
- 8.1.1.1. Network Management
- 8.1.1.2. Agriculture Asset Management
- 8.1.1.3. Supervisory Control
- 8.1.2. Service
- 8.1.1. Solution
- 8.2. Market Analysis, Insights and Forecast - by Application
- 8.2.1. Smart Logistics
- 8.2.2. Smart Irrigation
- 8.2.3. Farming Planning and Management
- 8.1. Market Analysis, Insights and Forecast - by Component
- 9. Latin America Connected Agriculture Industry Analysis, Insights and Forecast, 2019-2031
- 9.1. Market Analysis, Insights and Forecast - by Component
- 9.1.1. Solution
- 9.1.1.1. Network Management
- 9.1.1.2. Agriculture Asset Management
- 9.1.1.3. Supervisory Control
- 9.1.2. Service
- 9.1.1. Solution
- 9.2. Market Analysis, Insights and Forecast - by Application
- 9.2.1. Smart Logistics
- 9.2.2. Smart Irrigation
- 9.2.3. Farming Planning and Management
- 9.1. Market Analysis, Insights and Forecast - by Component
- 10. Middle East and Africa Connected Agriculture Industry Analysis, Insights and Forecast, 2019-2031
- 10.1. Market Analysis, Insights and Forecast - by Component
- 10.1.1. Solution
- 10.1.1.1. Network Management
- 10.1.1.2. Agriculture Asset Management
- 10.1.1.3. Supervisory Control
- 10.1.2. Service
- 10.1.1. Solution
- 10.2. Market Analysis, Insights and Forecast - by Application
- 10.2.1. Smart Logistics
- 10.2.2. Smart Irrigation
- 10.2.3. Farming Planning and Management
- 10.1. Market Analysis, Insights and Forecast - by Component
- 11. North America Connected Agriculture Industry Analysis, Insights and Forecast, 2019-2031
- 11.1. Market Analysis, Insights and Forecast - By Country/Sub-region
- 11.1.1 United States
- 11.1.2 Canada
- 11.1.3 Mexico
- 12. Europe Connected Agriculture Industry Analysis, Insights and Forecast, 2019-2031
- 12.1. Market Analysis, Insights and Forecast - By Country/Sub-region
- 12.1.1 Germany
- 12.1.2 United Kingdom
- 12.1.3 France
- 12.1.4 Spain
- 12.1.5 Italy
- 12.1.6 Spain
- 12.1.7 Belgium
- 12.1.8 Netherland
- 12.1.9 Nordics
- 12.1.10 Rest of Europe
- 13. Asia Pacific Connected Agriculture Industry Analysis, Insights and Forecast, 2019-2031
- 13.1. Market Analysis, Insights and Forecast - By Country/Sub-region
- 13.1.1 China
- 13.1.2 Japan
- 13.1.3 India
- 13.1.4 South Korea
- 13.1.5 Southeast Asia
- 13.1.6 Australia
- 13.1.7 Indonesia
- 13.1.8 Phillipes
- 13.1.9 Singapore
- 13.1.10 Thailandc
- 13.1.11 Rest of Asia Pacific
- 14. South America Connected Agriculture Industry Analysis, Insights and Forecast, 2019-2031
- 14.1. Market Analysis, Insights and Forecast - By Country/Sub-region
- 14.1.1 Brazil
- 14.1.2 Argentina
- 14.1.3 Peru
- 14.1.4 Chile
- 14.1.5 Colombia
- 14.1.6 Ecuador
- 14.1.7 Venezuela
- 14.1.8 Rest of South America
- 15. North America Connected Agriculture Industry Analysis, Insights and Forecast, 2019-2031
- 15.1. Market Analysis, Insights and Forecast - By Country/Sub-region
- 15.1.1 United States
- 15.1.2 Canada
- 15.1.3 Mexico
- 16. MEA Connected Agriculture Industry Analysis, Insights and Forecast, 2019-2031
- 16.1. Market Analysis, Insights and Forecast - By Country/Sub-region
- 16.1.1 United Arab Emirates
- 16.1.2 Saudi Arabia
- 16.1.3 South Africa
- 16.1.4 Rest of Middle East and Africa
- 17. Competitive Analysis
- 17.1. Global Market Share Analysis 2024
- 17.2. Company Profiles
- 17.2.1 Accenture PLC
- 17.2.1.1. Overview
- 17.2.1.2. Products
- 17.2.1.3. SWOT Analysis
- 17.2.1.4. Recent Developments
- 17.2.1.5. Financials (Based on Availability)
- 17.2.2 Trimble Navigation Ltd
- 17.2.2.1. Overview
- 17.2.2.2. Products
- 17.2.2.3. SWOT Analysis
- 17.2.2.4. Recent Developments
- 17.2.2.5. Financials (Based on Availability)
- 17.2.3 IBM Corporation
- 17.2.3.1. Overview
- 17.2.3.2. Products
- 17.2.3.3. SWOT Analysis
- 17.2.3.4. Recent Developments
- 17.2.3.5. Financials (Based on Availability)
- 17.2.4 SWIIM System
- 17.2.4.1. Overview
- 17.2.4.2. Products
- 17.2.4.3. SWOT Analysis
- 17.2.4.4. Recent Developments
- 17.2.4.5. Financials (Based on Availability)
- 17.2.5 Link Labs LLC
- 17.2.5.1. Overview
- 17.2.5.2. Products
- 17.2.5.3. SWOT Analysis
- 17.2.5.4. Recent Developments
- 17.2.5.5. Financials (Based on Availability)
- 17.2.6 Cisco Systems Inc
- 17.2.6.1. Overview
- 17.2.6.2. Products
- 17.2.6.3. SWOT Analysis
- 17.2.6.4. Recent Developments
- 17.2.6.5. Financials (Based on Availability)
- 17.2.7 Microsoft Corporation
- 17.2.7.1. Overview
- 17.2.7.2. Products
- 17.2.7.3. SWOT Analysis
- 17.2.7.4. Recent Developments
- 17.2.7.5. Financials (Based on Availability)
- 17.2.8 Orange Business Services
- 17.2.8.1. Overview
- 17.2.8.2. Products
- 17.2.8.3. SWOT Analysis
- 17.2.8.4. Recent Developments
- 17.2.8.5. Financials (Based on Availability)
- 17.2.9 SAP SE
- 17.2.9.1. Overview
- 17.2.9.2. Products
- 17.2.9.3. SWOT Analysis
- 17.2.9.4. Recent Developments
- 17.2.9.5. Financials (Based on Availability)
- 17.2.10 Vodafone Group PLC
- 17.2.10.1. Overview
- 17.2.10.2. Products
- 17.2.10.3. SWOT Analysis
- 17.2.10.4. Recent Developments
- 17.2.10.5. Financials (Based on Availability)
- 17.2.1 Accenture PLC
List of Figures
- Figure 1: Global Connected Agriculture Industry Revenue Breakdown (Million, %) by Region 2024 & 2032
- Figure 2: North America Connected Agriculture Industry Revenue (Million), by Country 2024 & 2032
- Figure 3: North America Connected Agriculture Industry Revenue Share (%), by Country 2024 & 2032
- Figure 4: Europe Connected Agriculture Industry Revenue (Million), by Country 2024 & 2032
- Figure 5: Europe Connected Agriculture Industry Revenue Share (%), by Country 2024 & 2032
- Figure 6: Asia Pacific Connected Agriculture Industry Revenue (Million), by Country 2024 & 2032
- Figure 7: Asia Pacific Connected Agriculture Industry Revenue Share (%), by Country 2024 & 2032
- Figure 8: South America Connected Agriculture Industry Revenue (Million), by Country 2024 & 2032
- Figure 9: South America Connected Agriculture Industry Revenue Share (%), by Country 2024 & 2032
- Figure 10: North America Connected Agriculture Industry Revenue (Million), by Country 2024 & 2032
- Figure 11: North America Connected Agriculture Industry Revenue Share (%), by Country 2024 & 2032
- Figure 12: MEA Connected Agriculture Industry Revenue (Million), by Country 2024 & 2032
- Figure 13: MEA Connected Agriculture Industry Revenue Share (%), by Country 2024 & 2032
- Figure 14: North America Connected Agriculture Industry Revenue (Million), by Component 2024 & 2032
- Figure 15: North America Connected Agriculture Industry Revenue Share (%), by Component 2024 & 2032
- Figure 16: North America Connected Agriculture Industry Revenue (Million), by Application 2024 & 2032
- Figure 17: North America Connected Agriculture Industry Revenue Share (%), by Application 2024 & 2032
- Figure 18: North America Connected Agriculture Industry Revenue (Million), by Country 2024 & 2032
- Figure 19: North America Connected Agriculture Industry Revenue Share (%), by Country 2024 & 2032
- Figure 20: Europe Connected Agriculture Industry Revenue (Million), by Component 2024 & 2032
- Figure 21: Europe Connected Agriculture Industry Revenue Share (%), by Component 2024 & 2032
- Figure 22: Europe Connected Agriculture Industry Revenue (Million), by Application 2024 & 2032
- Figure 23: Europe Connected Agriculture Industry Revenue Share (%), by Application 2024 & 2032
- Figure 24: Europe Connected Agriculture Industry Revenue (Million), by Country 2024 & 2032
- Figure 25: Europe Connected Agriculture Industry Revenue Share (%), by Country 2024 & 2032
- Figure 26: Asia Pacific Connected Agriculture Industry Revenue (Million), by Component 2024 & 2032
- Figure 27: Asia Pacific Connected Agriculture Industry Revenue Share (%), by Component 2024 & 2032
- Figure 28: Asia Pacific Connected Agriculture Industry Revenue (Million), by Application 2024 & 2032
- Figure 29: Asia Pacific Connected Agriculture Industry Revenue Share (%), by Application 2024 & 2032
- Figure 30: Asia Pacific Connected Agriculture Industry Revenue (Million), by Country 2024 & 2032
- Figure 31: Asia Pacific Connected Agriculture Industry Revenue Share (%), by Country 2024 & 2032
- Figure 32: Latin America Connected Agriculture Industry Revenue (Million), by Component 2024 & 2032
- Figure 33: Latin America Connected Agriculture Industry Revenue Share (%), by Component 2024 & 2032
- Figure 34: Latin America Connected Agriculture Industry Revenue (Million), by Application 2024 & 2032
- Figure 35: Latin America Connected Agriculture Industry Revenue Share (%), by Application 2024 & 2032
- Figure 36: Latin America Connected Agriculture Industry Revenue (Million), by Country 2024 & 2032
- Figure 37: Latin America Connected Agriculture Industry Revenue Share (%), by Country 2024 & 2032
- Figure 38: Middle East and Africa Connected Agriculture Industry Revenue (Million), by Component 2024 & 2032
- Figure 39: Middle East and Africa Connected Agriculture Industry Revenue Share (%), by Component 2024 & 2032
- Figure 40: Middle East and Africa Connected Agriculture Industry Revenue (Million), by Application 2024 & 2032
- Figure 41: Middle East and Africa Connected Agriculture Industry Revenue Share (%), by Application 2024 & 2032
- Figure 42: Middle East and Africa Connected Agriculture Industry Revenue (Million), by Country 2024 & 2032
- Figure 43: Middle East and Africa Connected Agriculture Industry Revenue Share (%), by Country 2024 & 2032
List of Tables
- Table 1: Global Connected Agriculture Industry Revenue Million Forecast, by Region 2019 & 2032
- Table 2: Global Connected Agriculture Industry Revenue Million Forecast, by Component 2019 & 2032
- Table 3: Global Connected Agriculture Industry Revenue Million Forecast, by Application 2019 & 2032
- Table 4: Global Connected Agriculture Industry Revenue Million Forecast, by Region 2019 & 2032
- Table 5: Global Connected Agriculture Industry Revenue Million Forecast, by Country 2019 & 2032
- Table 6: United States Connected Agriculture Industry Revenue (Million) Forecast, by Application 2019 & 2032
- Table 7: Canada Connected Agriculture Industry Revenue (Million) Forecast, by Application 2019 & 2032
- Table 8: Mexico Connected Agriculture Industry Revenue (Million) Forecast, by Application 2019 & 2032
- Table 9: Global Connected Agriculture Industry Revenue Million Forecast, by Country 2019 & 2032
- Table 10: Germany Connected Agriculture Industry Revenue (Million) Forecast, by Application 2019 & 2032
- Table 11: United Kingdom Connected Agriculture Industry Revenue (Million) Forecast, by Application 2019 & 2032
- Table 12: France Connected Agriculture Industry Revenue (Million) Forecast, by Application 2019 & 2032
- Table 13: Spain Connected Agriculture Industry Revenue (Million) Forecast, by Application 2019 & 2032
- Table 14: Italy Connected Agriculture Industry Revenue (Million) Forecast, by Application 2019 & 2032
- Table 15: Spain Connected Agriculture Industry Revenue (Million) Forecast, by Application 2019 & 2032
- Table 16: Belgium Connected Agriculture Industry Revenue (Million) Forecast, by Application 2019 & 2032
- Table 17: Netherland Connected Agriculture Industry Revenue (Million) Forecast, by Application 2019 & 2032
- Table 18: Nordics Connected Agriculture Industry Revenue (Million) Forecast, by Application 2019 & 2032
- Table 19: Rest of Europe Connected Agriculture Industry Revenue (Million) Forecast, by Application 2019 & 2032
- Table 20: Global Connected Agriculture Industry Revenue Million Forecast, by Country 2019 & 2032
- Table 21: China Connected Agriculture Industry Revenue (Million) Forecast, by Application 2019 & 2032
- Table 22: Japan Connected Agriculture Industry Revenue (Million) Forecast, by Application 2019 & 2032
- Table 23: India Connected Agriculture Industry Revenue (Million) Forecast, by Application 2019 & 2032
- Table 24: South Korea Connected Agriculture Industry Revenue (Million) Forecast, by Application 2019 & 2032
- Table 25: Southeast Asia Connected Agriculture Industry Revenue (Million) Forecast, by Application 2019 & 2032
- Table 26: Australia Connected Agriculture Industry Revenue (Million) Forecast, by Application 2019 & 2032
- Table 27: Indonesia Connected Agriculture Industry Revenue (Million) Forecast, by Application 2019 & 2032
- Table 28: Phillipes Connected Agriculture Industry Revenue (Million) Forecast, by Application 2019 & 2032
- Table 29: Singapore Connected Agriculture Industry Revenue (Million) Forecast, by Application 2019 & 2032
- Table 30: Thailandc Connected Agriculture Industry Revenue (Million) Forecast, by Application 2019 & 2032
- Table 31: Rest of Asia Pacific Connected Agriculture Industry Revenue (Million) Forecast, by Application 2019 & 2032
- Table 32: Global Connected Agriculture Industry Revenue Million Forecast, by Country 2019 & 2032
- Table 33: Brazil Connected Agriculture Industry Revenue (Million) Forecast, by Application 2019 & 2032
- Table 34: Argentina Connected Agriculture Industry Revenue (Million) Forecast, by Application 2019 & 2032
- Table 35: Peru Connected Agriculture Industry Revenue (Million) Forecast, by Application 2019 & 2032
- Table 36: Chile Connected Agriculture Industry Revenue (Million) Forecast, by Application 2019 & 2032
- Table 37: Colombia Connected Agriculture Industry Revenue (Million) Forecast, by Application 2019 & 2032
- Table 38: Ecuador Connected Agriculture Industry Revenue (Million) Forecast, by Application 2019 & 2032
- Table 39: Venezuela Connected Agriculture Industry Revenue (Million) Forecast, by Application 2019 & 2032
- Table 40: Rest of South America Connected Agriculture Industry Revenue (Million) Forecast, by Application 2019 & 2032
- Table 41: Global Connected Agriculture Industry Revenue Million Forecast, by Country 2019 & 2032
- Table 42: United States Connected Agriculture Industry Revenue (Million) Forecast, by Application 2019 & 2032
- Table 43: Canada Connected Agriculture Industry Revenue (Million) Forecast, by Application 2019 & 2032
- Table 44: Mexico Connected Agriculture Industry Revenue (Million) Forecast, by Application 2019 & 2032
- Table 45: Global Connected Agriculture Industry Revenue Million Forecast, by Country 2019 & 2032
- Table 46: United Arab Emirates Connected Agriculture Industry Revenue (Million) Forecast, by Application 2019 & 2032
- Table 47: Saudi Arabia Connected Agriculture Industry Revenue (Million) Forecast, by Application 2019 & 2032
- Table 48: South Africa Connected Agriculture Industry Revenue (Million) Forecast, by Application 2019 & 2032
- Table 49: Rest of Middle East and Africa Connected Agriculture Industry Revenue (Million) Forecast, by Application 2019 & 2032
- Table 50: Global Connected Agriculture Industry Revenue Million Forecast, by Component 2019 & 2032
- Table 51: Global Connected Agriculture Industry Revenue Million Forecast, by Application 2019 & 2032
- Table 52: Global Connected Agriculture Industry Revenue Million Forecast, by Country 2019 & 2032
- Table 53: United States Connected Agriculture Industry Revenue (Million) Forecast, by Application 2019 & 2032
- Table 54: Canada Connected Agriculture Industry Revenue (Million) Forecast, by Application 2019 & 2032
- Table 55: Global Connected Agriculture Industry Revenue Million Forecast, by Component 2019 & 2032
- Table 56: Global Connected Agriculture Industry Revenue Million Forecast, by Application 2019 & 2032
- Table 57: Global Connected Agriculture Industry Revenue Million Forecast, by Country 2019 & 2032
- Table 58: Germany Connected Agriculture Industry Revenue (Million) Forecast, by Application 2019 & 2032
- Table 59: United Kingdom Connected Agriculture Industry Revenue (Million) Forecast, by Application 2019 & 2032
- Table 60: France Connected Agriculture Industry Revenue (Million) Forecast, by Application 2019 & 2032
- Table 61: Rest of Europe Connected Agriculture Industry Revenue (Million) Forecast, by Application 2019 & 2032
- Table 62: Global Connected Agriculture Industry Revenue Million Forecast, by Component 2019 & 2032
- Table 63: Global Connected Agriculture Industry Revenue Million Forecast, by Application 2019 & 2032
- Table 64: Global Connected Agriculture Industry Revenue Million Forecast, by Country 2019 & 2032
- Table 65: China Connected Agriculture Industry Revenue (Million) Forecast, by Application 2019 & 2032
- Table 66: Japan Connected Agriculture Industry Revenue (Million) Forecast, by Application 2019 & 2032
- Table 67: India Connected Agriculture Industry Revenue (Million) Forecast, by Application 2019 & 2032
- Table 68: Rest of Asia Pacific Connected Agriculture Industry Revenue (Million) Forecast, by Application 2019 & 2032
- Table 69: Global Connected Agriculture Industry Revenue Million Forecast, by Component 2019 & 2032
- Table 70: Global Connected Agriculture Industry Revenue Million Forecast, by Application 2019 & 2032
- Table 71: Global Connected Agriculture Industry Revenue Million Forecast, by Country 2019 & 2032
- Table 72: Global Connected Agriculture Industry Revenue Million Forecast, by Component 2019 & 2032
- Table 73: Global Connected Agriculture Industry Revenue Million Forecast, by Application 2019 & 2032
- Table 74: Global Connected Agriculture Industry Revenue Million Forecast, by Country 2019 & 2032
Frequently Asked Questions
1. What is the projected Compound Annual Growth Rate (CAGR) of the Connected Agriculture Industry?
The projected CAGR is approximately 11.10%.
2. Which companies are prominent players in the Connected Agriculture Industry?
Key companies in the market include Accenture PLC, Trimble Navigation Ltd, IBM Corporation, SWIIM System, Link Labs LLC, Cisco Systems Inc, Microsoft Corporation, Orange Business Services, SAP SE, Vodafone Group PLC.
3. What are the main segments of the Connected Agriculture Industry?
The market segments include Component, Application.
4. Can you provide details about the market size?
The market size is estimated to be USD 5.78 Million as of 2022.
5. What are some drivers contributing to market growth?
Emergence of BYOD (Bring Your Own Drone) in Connected Agriculture; Upsurge in Demand for Smart Water Management Systems.
6. What are the notable trends driving market growth?
By Application. Smart Irrigation is Analyzed to Witness Substantial Growth.
7. Are there any restraints impacting market growth?
Steep Learning Curve Regarding Connected Agriculture.
8. Can you provide examples of recent developments in the market?
November 2023 - AGCO acquired digital assets from FarmFacts GmbH, a Farm Management Information Software (FMIS) firm in Pfarrkirchen, Germany, and BayWa AG group subsidiary. FarmFacts specializes in software for farmers and service providers to generate field action plans from prescription maps to guidance line creation. The acquisition increases AGCO’s FMIS offering and software development capabilities to serve farmers’ data management needs.
9. What pricing options are available for accessing the report?
Pricing options include single-user, multi-user, and enterprise licenses priced at USD 4750, USD 5250, and USD 8750 respectively.
10. Is the market size provided in terms of value or volume?
The market size is provided in terms of value, measured in Million.
11. Are there any specific market keywords associated with the report?
Yes, the market keyword associated with the report is "Connected Agriculture Industry," which aids in identifying and referencing the specific market segment covered.
12. How do I determine which pricing option suits my needs best?
The pricing options vary based on user requirements and access needs. Individual users may opt for single-user licenses, while businesses requiring broader access may choose multi-user or enterprise licenses for cost-effective access to the report.
13. Are there any additional resources or data provided in the Connected Agriculture Industry report?
While the report offers comprehensive insights, it's advisable to review the specific contents or supplementary materials provided to ascertain if additional resources or data are available.
14. How can I stay updated on further developments or reports in the Connected Agriculture Industry?
To stay informed about further developments, trends, and reports in the Connected Agriculture Industry, consider subscribing to industry newsletters, following relevant companies and organizations, or regularly checking reputable industry news sources and publications.
Methodology
Step 1 - Identification of Relevant Samples Size from Population Database


Step 2 - Approaches for Defining Global Market Size (Value, Volume* & Price*)

Note*: In applicable scenarios
Step 3 - Data Sources
Primary Research
- Web Analytics
- Survey Reports
- Research Institute
- Latest Research Reports
- Opinion Leaders
Secondary Research
- Annual Reports
- White Paper
- Latest Press Release
- Industry Association
- Paid Database
- Investor Presentations

Step 4 - Data Triangulation
Involves using different sources of information in order to increase the validity of a study
These sources are likely to be stakeholders in a program - participants, other researchers, program staff, other community members, and so on.
Then we put all data in single framework & apply various statistical tools to find out the dynamic on the market.
During the analysis stage, feedback from the stakeholder groups would be compared to determine areas of agreement as well as areas of divergence


