
Key Insights
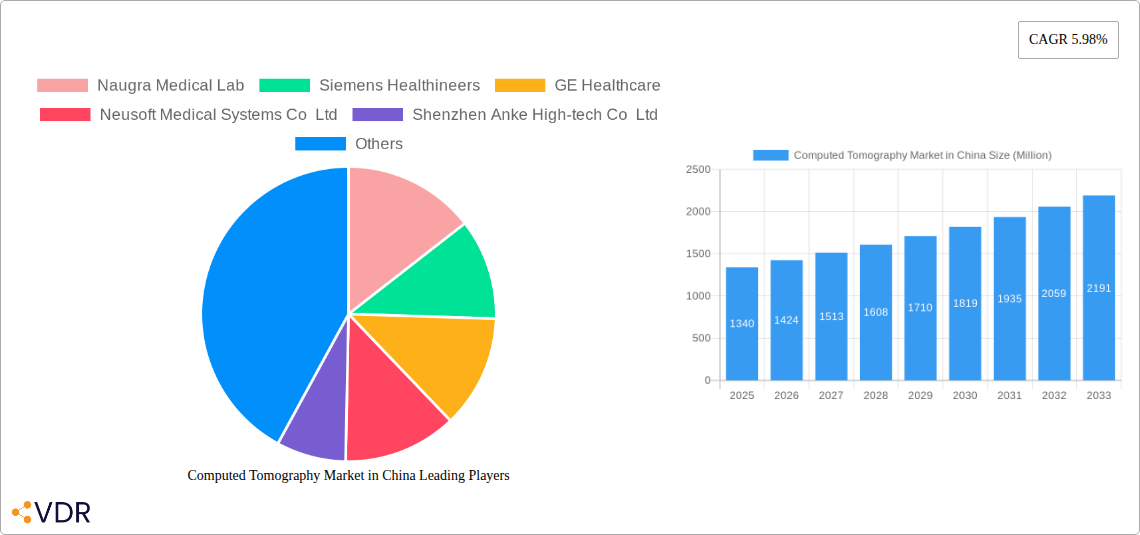
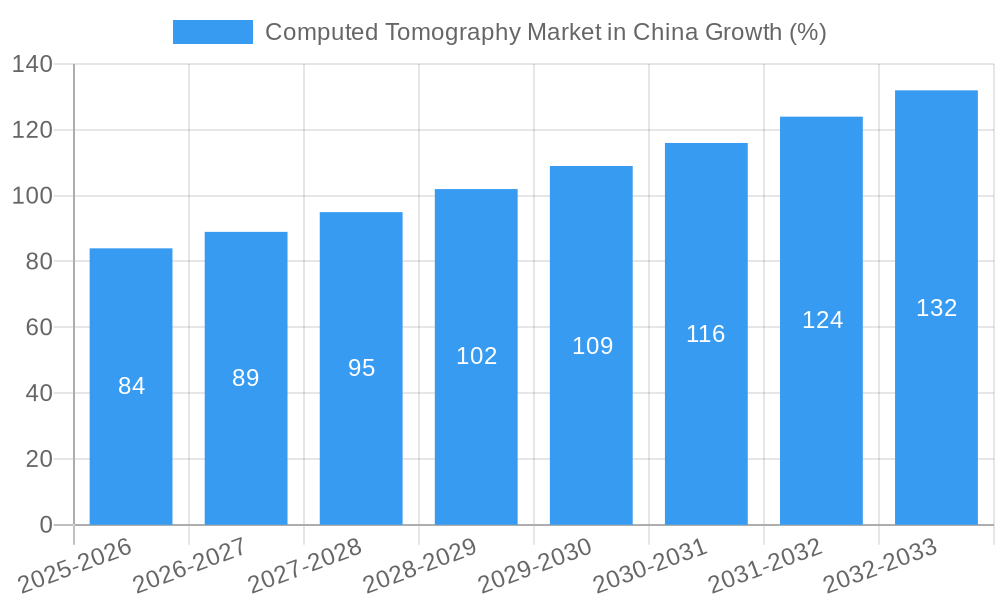
The Chinese Computed Tomography (CT) market, valued at $1.34 billion in 2025, is projected to experience robust growth, exhibiting a Compound Annual Growth Rate (CAGR) of 5.98% from 2025 to 2033. This expansion is driven by several key factors. Firstly, rising healthcare expenditure and government initiatives aimed at improving healthcare infrastructure are significantly boosting the adoption of advanced medical imaging technologies like CT scans. Secondly, the increasing prevalence of chronic diseases, such as cardiovascular diseases, cancer, and neurological disorders, necessitates frequent CT scans for diagnosis and treatment monitoring, fueling market demand. Technological advancements, including the development of multi-slice CT scanners with improved image quality and reduced radiation exposure, are further propelling market growth. The market is segmented by end-user (hospitals, diagnostic centers, others), type (low, medium, and high slice CT scanners), and application (oncology, neurology, cardiovascular, musculoskeletal, and others). Hospitals currently dominate the end-user segment, owing to their higher diagnostic capabilities and patient volumes. High-slice CT scanners are witnessing higher adoption rates due to their superior image resolution and faster scan times. Oncology and cardiology applications are currently leading the application segment due to the high prevalence of related diseases in China. Competitive landscape includes both domestic and international players like Siemens Healthineers, GE Healthcare, and Neusoft Medical Systems, fostering innovation and driving down costs.
While the market presents significant opportunities, certain restraints need consideration. These include the high cost of CT scanners and maintenance, which can limit access in some regions. Furthermore, the need for skilled technicians to operate and interpret CT scans presents a potential bottleneck. However, the continuous expansion of medical training programs and government initiatives to improve healthcare accessibility are expected to mitigate these challenges. The continued focus on technological advancement, coupled with the increasing prevalence of chronic diseases, positions the Chinese CT market for sustained growth throughout the forecast period, particularly in areas such as multi-slice CT and advanced image processing capabilities. Growth will be particularly strong in tier-one and tier-two cities, driven by rising disposable incomes and healthcare awareness.
Computed Tomography Market in China: A Comprehensive Report (2019-2033)
This in-depth report provides a comprehensive analysis of the Computed Tomography (CT) market in China, encompassing market dynamics, growth trends, regional dominance, product landscape, key players, and future outlook. The report covers the period from 2019 to 2033, with a base year of 2025 and a forecast period of 2025-2033. The study segments the market by end-user (Hospitals, Diagnostic Centers, Other End-Users), type (Low Slice, Medium Slice, High Slice), and application (Oncology, Neurology, Cardiovascular, Musculoskeletal, Other Applications). This report is crucial for industry professionals seeking to understand the opportunities and challenges within this rapidly evolving market.
Computed Tomography Market in China Market Dynamics & Structure
The Chinese CT market is characterized by a dynamic interplay of factors influencing its structure and growth. Market concentration is moderate, with several multinational and domestic players competing for market share. Technological innovation, particularly in areas like multi-slice CT and AI-powered image analysis, is a key driver. Stringent regulatory frameworks and evolving reimbursement policies significantly impact market access and pricing. The availability of advanced MRI and other imaging modalities presents competitive substitutes. The end-user demographic is shifting towards a more balanced distribution across urban and rural areas, driven by increased healthcare infrastructure development. M&A activity in the market has been moderate, with a focus on strategic partnerships and technology acquisitions.
- Market Concentration: Moderately concentrated, with top 5 players holding approximately xx% market share in 2024.
- Technological Innovation: Rapid advancements in multi-slice technology, AI-driven image analysis, and improved radiation dose reduction are key drivers.
- Regulatory Framework: Stringent regulatory approvals and reimbursement policies influence market access and pricing.
- Competitive Substitutes: MRI and Ultrasound imaging pose competitive challenges.
- M&A Trends: Moderate activity focused on strategic partnerships and technological acquisitions; xx deals recorded between 2019 and 2024.
- End-User Demographics: Shifting towards a more even distribution across urban and rural areas.
Computed Tomography Market in China Growth Trends & Insights
The Chinese CT market exhibited robust growth during the historical period (2019-2024), driven by factors including rising healthcare expenditure, increasing prevalence of chronic diseases, and government initiatives to improve healthcare infrastructure. The market size reached xx million units in 2024, exhibiting a CAGR of xx% during this period. Adoption rates are particularly high in urban areas with advanced healthcare infrastructure. Technological disruptions, such as the introduction of AI-powered diagnostic tools and improved image quality, are accelerating market growth. Consumer behavior is shifting towards a preference for faster, more accurate, and less invasive diagnostic procedures. The forecast period (2025-2033) anticipates continued growth, driven by expanding healthcare access and technological advancements, with an estimated market size of xx million units by 2033 and a projected CAGR of xx%.
Dominant Regions, Countries, or Segments in Computed Tomography Market in China
The Eastern region of China demonstrates the strongest growth within the CT market, driven by high healthcare expenditure and a concentration of advanced medical facilities. Tier-1 cities like Beijing and Shanghai lead in market share due to advanced infrastructure and high disease prevalence. Within the segmentation, Hospitals account for the largest share of the market, followed by Diagnostic Centers. High-slice CT scanners dominate the type segment, attributed to their superior image quality and diagnostic capabilities. Oncology applications constitute the largest application segment, driven by the rising incidence of cancer in China.
- Key Drivers: Government investments in healthcare infrastructure, rising prevalence of chronic diseases, increasing healthcare expenditure.
- Dominant Regions: Eastern China, particularly Tier-1 cities (Beijing, Shanghai, Guangzhou).
- Dominant End-User: Hospitals hold the largest market share.
- Dominant Type: High-slice CT scanners.
- Dominant Application: Oncology applications.
Computed Tomography Market in China Product Landscape
The CT market in China offers a wide range of products varying in slice count, image quality, and advanced features. Innovations focus on improved image clarity, reduced radiation dose, faster scan times, and AI-powered diagnostic tools. Manufacturers are increasingly integrating advanced functionalities, including iterative reconstruction techniques and spectral imaging capabilities. These advancements enhance diagnostic accuracy and patient throughput, contributing to increased market adoption.
Key Drivers, Barriers & Challenges in Computed Tomography Market in China
Key Drivers:
- Rising prevalence of chronic diseases requiring CT scans.
- Increasing healthcare expenditure and government investments.
- Technological advancements leading to improved image quality and reduced radiation dose.
- Growing awareness among the population about the importance of preventive healthcare.
Challenges:
- High cost of advanced CT scanners limiting accessibility in rural areas.
- Stringent regulatory approvals slowing down market entry for new products.
- Intense competition from both domestic and international players.
- Limited skilled radiologists in some regions impacting the efficient use of CT technology.
Emerging Opportunities in Computed Tomography Market in China
Emerging opportunities include the expansion of CT services in lower-tier cities through public-private partnerships. The increasing integration of AI and machine learning in image analysis offers significant opportunities for enhanced diagnostic capabilities. Demand for mobile CT scanners and point-of-care solutions is also rising, addressing accessibility challenges in remote areas.
Growth Accelerators in the Computed Tomography Market in China Industry
Long-term growth will be accelerated by technological advancements in areas such as dual-energy CT and spectral CT. Strategic collaborations between manufacturers and healthcare providers will enhance market access and affordability. Continued government support for healthcare infrastructure development will further stimulate market expansion.
Key Players Shaping the Computed Tomography Market in China Market
- Naugra Medical Lab
- Siemens Healthineers
- GE Healthcare
- Neusoft Medical Systems Co Ltd
- Shenzhen Anke High-tech Co Ltd
- Koninklijke Philips NV
- Canon Medical Systems Corporation
- MinFound Medical Systems Co Ltd
- Planmed Oy
- Fujifilm Holdings Corporation
Notable Milestones in Computed Tomography Market in China Sector
- March 2023: Elekta launched a cooperative venture with China National Pharmaceutical Group Co., Ltd. (Sinopharm) to expand radiation therapy access in lower-tier cities. This significantly impacts market expansion beyond major urban centers.
- February 2022: Siemens Healthineers and Universal Medical Imaging partnered to promote 5G remote imaging diagnosis, improving access to specialized care in remote areas. This accelerates adoption and improves diagnostic capabilities in underserved regions.
In-Depth Computed Tomography Market in China Market Outlook
The future of the Chinese CT market is promising, driven by continuous technological innovations, expanding healthcare infrastructure, and rising healthcare expenditure. Strategic partnerships, focused on improving affordability and accessibility, will be critical in realizing the full market potential. The market is poised for substantial growth in the coming years, presenting significant opportunities for both established players and new entrants.
Computed Tomography Market in China Segmentation
-
1. Type
- 1.1. Low Slice
- 1.2. Medium Slice
- 1.3. High Slice
-
2. Application
- 2.1. Oncology
- 2.2. Neurology
- 2.3. Cardiovascular
- 2.4. Musculoskeletal
- 2.5. Other Applications
-
3. End User
- 3.1. Hospitals
- 3.2. Diagnostic Centers
- 3.3. Other End Users
Computed Tomography Market in China Segmentation By Geography
-
1. North America
- 1.1. United States
- 1.2. Canada
- 1.3. Mexico
-
2. South America
- 2.1. Brazil
- 2.2. Argentina
- 2.3. Rest of South America
-
3. Europe
- 3.1. United Kingdom
- 3.2. Germany
- 3.3. France
- 3.4. Italy
- 3.5. Spain
- 3.6. Russia
- 3.7. Benelux
- 3.8. Nordics
- 3.9. Rest of Europe
-
4. Middle East & Africa
- 4.1. Turkey
- 4.2. Israel
- 4.3. GCC
- 4.4. North Africa
- 4.5. South Africa
- 4.6. Rest of Middle East & Africa
-
5. Asia Pacific
- 5.1. China
- 5.2. India
- 5.3. Japan
- 5.4. South Korea
- 5.5. ASEAN
- 5.6. Oceania
- 5.7. Rest of Asia Pacific
Computed Tomography Market in China REPORT HIGHLIGHTS
| Aspects | Details |
|---|---|
| Study Period | 2019-2033 |
| Base Year | 2024 |
| Estimated Year | 2025 |
| Forecast Period | 2025-2033 |
| Historical Period | 2019-2024 |
| Growth Rate | CAGR of 5.98% from 2019-2033 |
| Segmentation |
|
Table of Contents
- 1. Introduction
- 1.1. Research Scope
- 1.2. Market Segmentation
- 1.3. Research Methodology
- 1.4. Definitions and Assumptions
- 2. Executive Summary
- 2.1. Introduction
- 3. Market Dynamics
- 3.1. Introduction
- 3.2. Market Drivers
- 3.2.1. Increasing Geriatric Population and Chronic Disease Burden; Technological Advancements in Computed Tomography
- 3.3. Market Restrains
- 3.3.1. High Cost Associated With CT Scan Procedure and Equipment
- 3.4. Market Trends
- 3.4.1. Diagnostic Centers to Hold Significant Share in End-User Segment Over the Forecast Period
- 4. Market Factor Analysis
- 4.1. Porters Five Forces
- 4.2. Supply/Value Chain
- 4.3. PESTEL analysis
- 4.4. Market Entropy
- 4.5. Patent/Trademark Analysis
- 5. Global Computed Tomography Market in China Analysis, Insights and Forecast, 2019-2031
- 5.1. Market Analysis, Insights and Forecast - by Type
- 5.1.1. Low Slice
- 5.1.2. Medium Slice
- 5.1.3. High Slice
- 5.2. Market Analysis, Insights and Forecast - by Application
- 5.2.1. Oncology
- 5.2.2. Neurology
- 5.2.3. Cardiovascular
- 5.2.4. Musculoskeletal
- 5.2.5. Other Applications
- 5.3. Market Analysis, Insights and Forecast - by End User
- 5.3.1. Hospitals
- 5.3.2. Diagnostic Centers
- 5.3.3. Other End Users
- 5.4. Market Analysis, Insights and Forecast - by Region
- 5.4.1. North America
- 5.4.2. South America
- 5.4.3. Europe
- 5.4.4. Middle East & Africa
- 5.4.5. Asia Pacific
- 5.1. Market Analysis, Insights and Forecast - by Type
- 6. North America Computed Tomography Market in China Analysis, Insights and Forecast, 2019-2031
- 6.1. Market Analysis, Insights and Forecast - by Type
- 6.1.1. Low Slice
- 6.1.2. Medium Slice
- 6.1.3. High Slice
- 6.2. Market Analysis, Insights and Forecast - by Application
- 6.2.1. Oncology
- 6.2.2. Neurology
- 6.2.3. Cardiovascular
- 6.2.4. Musculoskeletal
- 6.2.5. Other Applications
- 6.3. Market Analysis, Insights and Forecast - by End User
- 6.3.1. Hospitals
- 6.3.2. Diagnostic Centers
- 6.3.3. Other End Users
- 6.1. Market Analysis, Insights and Forecast - by Type
- 7. South America Computed Tomography Market in China Analysis, Insights and Forecast, 2019-2031
- 7.1. Market Analysis, Insights and Forecast - by Type
- 7.1.1. Low Slice
- 7.1.2. Medium Slice
- 7.1.3. High Slice
- 7.2. Market Analysis, Insights and Forecast - by Application
- 7.2.1. Oncology
- 7.2.2. Neurology
- 7.2.3. Cardiovascular
- 7.2.4. Musculoskeletal
- 7.2.5. Other Applications
- 7.3. Market Analysis, Insights and Forecast - by End User
- 7.3.1. Hospitals
- 7.3.2. Diagnostic Centers
- 7.3.3. Other End Users
- 7.1. Market Analysis, Insights and Forecast - by Type
- 8. Europe Computed Tomography Market in China Analysis, Insights and Forecast, 2019-2031
- 8.1. Market Analysis, Insights and Forecast - by Type
- 8.1.1. Low Slice
- 8.1.2. Medium Slice
- 8.1.3. High Slice
- 8.2. Market Analysis, Insights and Forecast - by Application
- 8.2.1. Oncology
- 8.2.2. Neurology
- 8.2.3. Cardiovascular
- 8.2.4. Musculoskeletal
- 8.2.5. Other Applications
- 8.3. Market Analysis, Insights and Forecast - by End User
- 8.3.1. Hospitals
- 8.3.2. Diagnostic Centers
- 8.3.3. Other End Users
- 8.1. Market Analysis, Insights and Forecast - by Type
- 9. Middle East & Africa Computed Tomography Market in China Analysis, Insights and Forecast, 2019-2031
- 9.1. Market Analysis, Insights and Forecast - by Type
- 9.1.1. Low Slice
- 9.1.2. Medium Slice
- 9.1.3. High Slice
- 9.2. Market Analysis, Insights and Forecast - by Application
- 9.2.1. Oncology
- 9.2.2. Neurology
- 9.2.3. Cardiovascular
- 9.2.4. Musculoskeletal
- 9.2.5. Other Applications
- 9.3. Market Analysis, Insights and Forecast - by End User
- 9.3.1. Hospitals
- 9.3.2. Diagnostic Centers
- 9.3.3. Other End Users
- 9.1. Market Analysis, Insights and Forecast - by Type
- 10. Asia Pacific Computed Tomography Market in China Analysis, Insights and Forecast, 2019-2031
- 10.1. Market Analysis, Insights and Forecast - by Type
- 10.1.1. Low Slice
- 10.1.2. Medium Slice
- 10.1.3. High Slice
- 10.2. Market Analysis, Insights and Forecast - by Application
- 10.2.1. Oncology
- 10.2.2. Neurology
- 10.2.3. Cardiovascular
- 10.2.4. Musculoskeletal
- 10.2.5. Other Applications
- 10.3. Market Analysis, Insights and Forecast - by End User
- 10.3.1. Hospitals
- 10.3.2. Diagnostic Centers
- 10.3.3. Other End Users
- 10.1. Market Analysis, Insights and Forecast - by Type
- 11. Competitive Analysis
- 11.1. Global Market Share Analysis 2024
- 11.2. Company Profiles
- 11.2.1 Naugra Medical Lab
- 11.2.1.1. Overview
- 11.2.1.2. Products
- 11.2.1.3. SWOT Analysis
- 11.2.1.4. Recent Developments
- 11.2.1.5. Financials (Based on Availability)
- 11.2.2 Siemens Healthineers
- 11.2.2.1. Overview
- 11.2.2.2. Products
- 11.2.2.3. SWOT Analysis
- 11.2.2.4. Recent Developments
- 11.2.2.5. Financials (Based on Availability)
- 11.2.3 GE Healthcare
- 11.2.3.1. Overview
- 11.2.3.2. Products
- 11.2.3.3. SWOT Analysis
- 11.2.3.4. Recent Developments
- 11.2.3.5. Financials (Based on Availability)
- 11.2.4 Neusoft Medical Systems Co Ltd
- 11.2.4.1. Overview
- 11.2.4.2. Products
- 11.2.4.3. SWOT Analysis
- 11.2.4.4. Recent Developments
- 11.2.4.5. Financials (Based on Availability)
- 11.2.5 Shenzhen Anke High-tech Co Ltd
- 11.2.5.1. Overview
- 11.2.5.2. Products
- 11.2.5.3. SWOT Analysis
- 11.2.5.4. Recent Developments
- 11.2.5.5. Financials (Based on Availability)
- 11.2.6 Koninklijke Philips NV
- 11.2.6.1. Overview
- 11.2.6.2. Products
- 11.2.6.3. SWOT Analysis
- 11.2.6.4. Recent Developments
- 11.2.6.5. Financials (Based on Availability)
- 11.2.7 Canon Medical Systems Corporation
- 11.2.7.1. Overview
- 11.2.7.2. Products
- 11.2.7.3. SWOT Analysis
- 11.2.7.4. Recent Developments
- 11.2.7.5. Financials (Based on Availability)
- 11.2.8 MinFound Medical Systems Co Ltd
- 11.2.8.1. Overview
- 11.2.8.2. Products
- 11.2.8.3. SWOT Analysis
- 11.2.8.4. Recent Developments
- 11.2.8.5. Financials (Based on Availability)
- 11.2.9 Planmed Oy
- 11.2.9.1. Overview
- 11.2.9.2. Products
- 11.2.9.3. SWOT Analysis
- 11.2.9.4. Recent Developments
- 11.2.9.5. Financials (Based on Availability)
- 11.2.10 Fujifilm Holdings Corporation
- 11.2.10.1. Overview
- 11.2.10.2. Products
- 11.2.10.3. SWOT Analysis
- 11.2.10.4. Recent Developments
- 11.2.10.5. Financials (Based on Availability)
- 11.2.1 Naugra Medical Lab
List of Figures
- Figure 1: Global Computed Tomography Market in China Revenue Breakdown (Million, %) by Region 2024 & 2032
- Figure 2: China Computed Tomography Market in China Revenue (Million), by Country 2024 & 2032
- Figure 3: China Computed Tomography Market in China Revenue Share (%), by Country 2024 & 2032
- Figure 4: North America Computed Tomography Market in China Revenue (Million), by Type 2024 & 2032
- Figure 5: North America Computed Tomography Market in China Revenue Share (%), by Type 2024 & 2032
- Figure 6: North America Computed Tomography Market in China Revenue (Million), by Application 2024 & 2032
- Figure 7: North America Computed Tomography Market in China Revenue Share (%), by Application 2024 & 2032
- Figure 8: North America Computed Tomography Market in China Revenue (Million), by End User 2024 & 2032
- Figure 9: North America Computed Tomography Market in China Revenue Share (%), by End User 2024 & 2032
- Figure 10: North America Computed Tomography Market in China Revenue (Million), by Country 2024 & 2032
- Figure 11: North America Computed Tomography Market in China Revenue Share (%), by Country 2024 & 2032
- Figure 12: South America Computed Tomography Market in China Revenue (Million), by Type 2024 & 2032
- Figure 13: South America Computed Tomography Market in China Revenue Share (%), by Type 2024 & 2032
- Figure 14: South America Computed Tomography Market in China Revenue (Million), by Application 2024 & 2032
- Figure 15: South America Computed Tomography Market in China Revenue Share (%), by Application 2024 & 2032
- Figure 16: South America Computed Tomography Market in China Revenue (Million), by End User 2024 & 2032
- Figure 17: South America Computed Tomography Market in China Revenue Share (%), by End User 2024 & 2032
- Figure 18: South America Computed Tomography Market in China Revenue (Million), by Country 2024 & 2032
- Figure 19: South America Computed Tomography Market in China Revenue Share (%), by Country 2024 & 2032
- Figure 20: Europe Computed Tomography Market in China Revenue (Million), by Type 2024 & 2032
- Figure 21: Europe Computed Tomography Market in China Revenue Share (%), by Type 2024 & 2032
- Figure 22: Europe Computed Tomography Market in China Revenue (Million), by Application 2024 & 2032
- Figure 23: Europe Computed Tomography Market in China Revenue Share (%), by Application 2024 & 2032
- Figure 24: Europe Computed Tomography Market in China Revenue (Million), by End User 2024 & 2032
- Figure 25: Europe Computed Tomography Market in China Revenue Share (%), by End User 2024 & 2032
- Figure 26: Europe Computed Tomography Market in China Revenue (Million), by Country 2024 & 2032
- Figure 27: Europe Computed Tomography Market in China Revenue Share (%), by Country 2024 & 2032
- Figure 28: Middle East & Africa Computed Tomography Market in China Revenue (Million), by Type 2024 & 2032
- Figure 29: Middle East & Africa Computed Tomography Market in China Revenue Share (%), by Type 2024 & 2032
- Figure 30: Middle East & Africa Computed Tomography Market in China Revenue (Million), by Application 2024 & 2032
- Figure 31: Middle East & Africa Computed Tomography Market in China Revenue Share (%), by Application 2024 & 2032
- Figure 32: Middle East & Africa Computed Tomography Market in China Revenue (Million), by End User 2024 & 2032
- Figure 33: Middle East & Africa Computed Tomography Market in China Revenue Share (%), by End User 2024 & 2032
- Figure 34: Middle East & Africa Computed Tomography Market in China Revenue (Million), by Country 2024 & 2032
- Figure 35: Middle East & Africa Computed Tomography Market in China Revenue Share (%), by Country 2024 & 2032
- Figure 36: Asia Pacific Computed Tomography Market in China Revenue (Million), by Type 2024 & 2032
- Figure 37: Asia Pacific Computed Tomography Market in China Revenue Share (%), by Type 2024 & 2032
- Figure 38: Asia Pacific Computed Tomography Market in China Revenue (Million), by Application 2024 & 2032
- Figure 39: Asia Pacific Computed Tomography Market in China Revenue Share (%), by Application 2024 & 2032
- Figure 40: Asia Pacific Computed Tomography Market in China Revenue (Million), by End User 2024 & 2032
- Figure 41: Asia Pacific Computed Tomography Market in China Revenue Share (%), by End User 2024 & 2032
- Figure 42: Asia Pacific Computed Tomography Market in China Revenue (Million), by Country 2024 & 2032
- Figure 43: Asia Pacific Computed Tomography Market in China Revenue Share (%), by Country 2024 & 2032
List of Tables
- Table 1: Global Computed Tomography Market in China Revenue Million Forecast, by Region 2019 & 2032
- Table 2: Global Computed Tomography Market in China Revenue Million Forecast, by Type 2019 & 2032
- Table 3: Global Computed Tomography Market in China Revenue Million Forecast, by Application 2019 & 2032
- Table 4: Global Computed Tomography Market in China Revenue Million Forecast, by End User 2019 & 2032
- Table 5: Global Computed Tomography Market in China Revenue Million Forecast, by Region 2019 & 2032
- Table 6: Global Computed Tomography Market in China Revenue Million Forecast, by Country 2019 & 2032
- Table 7: Global Computed Tomography Market in China Revenue Million Forecast, by Type 2019 & 2032
- Table 8: Global Computed Tomography Market in China Revenue Million Forecast, by Application 2019 & 2032
- Table 9: Global Computed Tomography Market in China Revenue Million Forecast, by End User 2019 & 2032
- Table 10: Global Computed Tomography Market in China Revenue Million Forecast, by Country 2019 & 2032
- Table 11: United States Computed Tomography Market in China Revenue (Million) Forecast, by Application 2019 & 2032
- Table 12: Canada Computed Tomography Market in China Revenue (Million) Forecast, by Application 2019 & 2032
- Table 13: Mexico Computed Tomography Market in China Revenue (Million) Forecast, by Application 2019 & 2032
- Table 14: Global Computed Tomography Market in China Revenue Million Forecast, by Type 2019 & 2032
- Table 15: Global Computed Tomography Market in China Revenue Million Forecast, by Application 2019 & 2032
- Table 16: Global Computed Tomography Market in China Revenue Million Forecast, by End User 2019 & 2032
- Table 17: Global Computed Tomography Market in China Revenue Million Forecast, by Country 2019 & 2032
- Table 18: Brazil Computed Tomography Market in China Revenue (Million) Forecast, by Application 2019 & 2032
- Table 19: Argentina Computed Tomography Market in China Revenue (Million) Forecast, by Application 2019 & 2032
- Table 20: Rest of South America Computed Tomography Market in China Revenue (Million) Forecast, by Application 2019 & 2032
- Table 21: Global Computed Tomography Market in China Revenue Million Forecast, by Type 2019 & 2032
- Table 22: Global Computed Tomography Market in China Revenue Million Forecast, by Application 2019 & 2032
- Table 23: Global Computed Tomography Market in China Revenue Million Forecast, by End User 2019 & 2032
- Table 24: Global Computed Tomography Market in China Revenue Million Forecast, by Country 2019 & 2032
- Table 25: United Kingdom Computed Tomography Market in China Revenue (Million) Forecast, by Application 2019 & 2032
- Table 26: Germany Computed Tomography Market in China Revenue (Million) Forecast, by Application 2019 & 2032
- Table 27: France Computed Tomography Market in China Revenue (Million) Forecast, by Application 2019 & 2032
- Table 28: Italy Computed Tomography Market in China Revenue (Million) Forecast, by Application 2019 & 2032
- Table 29: Spain Computed Tomography Market in China Revenue (Million) Forecast, by Application 2019 & 2032
- Table 30: Russia Computed Tomography Market in China Revenue (Million) Forecast, by Application 2019 & 2032
- Table 31: Benelux Computed Tomography Market in China Revenue (Million) Forecast, by Application 2019 & 2032
- Table 32: Nordics Computed Tomography Market in China Revenue (Million) Forecast, by Application 2019 & 2032
- Table 33: Rest of Europe Computed Tomography Market in China Revenue (Million) Forecast, by Application 2019 & 2032
- Table 34: Global Computed Tomography Market in China Revenue Million Forecast, by Type 2019 & 2032
- Table 35: Global Computed Tomography Market in China Revenue Million Forecast, by Application 2019 & 2032
- Table 36: Global Computed Tomography Market in China Revenue Million Forecast, by End User 2019 & 2032
- Table 37: Global Computed Tomography Market in China Revenue Million Forecast, by Country 2019 & 2032
- Table 38: Turkey Computed Tomography Market in China Revenue (Million) Forecast, by Application 2019 & 2032
- Table 39: Israel Computed Tomography Market in China Revenue (Million) Forecast, by Application 2019 & 2032
- Table 40: GCC Computed Tomography Market in China Revenue (Million) Forecast, by Application 2019 & 2032
- Table 41: North Africa Computed Tomography Market in China Revenue (Million) Forecast, by Application 2019 & 2032
- Table 42: South Africa Computed Tomography Market in China Revenue (Million) Forecast, by Application 2019 & 2032
- Table 43: Rest of Middle East & Africa Computed Tomography Market in China Revenue (Million) Forecast, by Application 2019 & 2032
- Table 44: Global Computed Tomography Market in China Revenue Million Forecast, by Type 2019 & 2032
- Table 45: Global Computed Tomography Market in China Revenue Million Forecast, by Application 2019 & 2032
- Table 46: Global Computed Tomography Market in China Revenue Million Forecast, by End User 2019 & 2032
- Table 47: Global Computed Tomography Market in China Revenue Million Forecast, by Country 2019 & 2032
- Table 48: China Computed Tomography Market in China Revenue (Million) Forecast, by Application 2019 & 2032
- Table 49: India Computed Tomography Market in China Revenue (Million) Forecast, by Application 2019 & 2032
- Table 50: Japan Computed Tomography Market in China Revenue (Million) Forecast, by Application 2019 & 2032
- Table 51: South Korea Computed Tomography Market in China Revenue (Million) Forecast, by Application 2019 & 2032
- Table 52: ASEAN Computed Tomography Market in China Revenue (Million) Forecast, by Application 2019 & 2032
- Table 53: Oceania Computed Tomography Market in China Revenue (Million) Forecast, by Application 2019 & 2032
- Table 54: Rest of Asia Pacific Computed Tomography Market in China Revenue (Million) Forecast, by Application 2019 & 2032
Frequently Asked Questions
1. What is the projected Compound Annual Growth Rate (CAGR) of the Computed Tomography Market in China?
The projected CAGR is approximately 5.98%.
2. Which companies are prominent players in the Computed Tomography Market in China?
Key companies in the market include Naugra Medical Lab, Siemens Healthineers, GE Healthcare, Neusoft Medical Systems Co Ltd, Shenzhen Anke High-tech Co Ltd, Koninklijke Philips NV, Canon Medical Systems Corporation, MinFound Medical Systems Co Ltd, Planmed Oy, Fujifilm Holdings Corporation.
3. What are the main segments of the Computed Tomography Market in China?
The market segments include Type, Application, End User.
4. Can you provide details about the market size?
The market size is estimated to be USD 1.34 Million as of 2022.
5. What are some drivers contributing to market growth?
Increasing Geriatric Population and Chronic Disease Burden; Technological Advancements in Computed Tomography.
6. What are the notable trends driving market growth?
Diagnostic Centers to Hold Significant Share in End-User Segment Over the Forecast Period.
7. Are there any restraints impacting market growth?
High Cost Associated With CT Scan Procedure and Equipment.
8. Can you provide examples of recent developments in the market?
March 2023: Elekta launched a cooperative venture with China National Pharmaceutical Group Co., Ltd. (Sinopharm) to expand the use of radiation therapy in so-called lower-tier cities, where around 70% of the population lives.
9. What pricing options are available for accessing the report?
Pricing options include single-user, multi-user, and enterprise licenses priced at USD 3800, USD 4500, and USD 5800 respectively.
10. Is the market size provided in terms of value or volume?
The market size is provided in terms of value, measured in Million.
11. Are there any specific market keywords associated with the report?
Yes, the market keyword associated with the report is "Computed Tomography Market in China," which aids in identifying and referencing the specific market segment covered.
12. How do I determine which pricing option suits my needs best?
The pricing options vary based on user requirements and access needs. Individual users may opt for single-user licenses, while businesses requiring broader access may choose multi-user or enterprise licenses for cost-effective access to the report.
13. Are there any additional resources or data provided in the Computed Tomography Market in China report?
While the report offers comprehensive insights, it's advisable to review the specific contents or supplementary materials provided to ascertain if additional resources or data are available.
14. How can I stay updated on further developments or reports in the Computed Tomography Market in China?
To stay informed about further developments, trends, and reports in the Computed Tomography Market in China, consider subscribing to industry newsletters, following relevant companies and organizations, or regularly checking reputable industry news sources and publications.
Methodology
Step 1 - Identification of Relevant Samples Size from Population Database


Step 2 - Approaches for Defining Global Market Size (Value, Volume* & Price*)

Note*: In applicable scenarios
Step 3 - Data Sources
Primary Research
- Web Analytics
- Survey Reports
- Research Institute
- Latest Research Reports
- Opinion Leaders
Secondary Research
- Annual Reports
- White Paper
- Latest Press Release
- Industry Association
- Paid Database
- Investor Presentations

Step 4 - Data Triangulation
Involves using different sources of information in order to increase the validity of a study
These sources are likely to be stakeholders in a program - participants, other researchers, program staff, other community members, and so on.
Then we put all data in single framework & apply various statistical tools to find out the dynamic on the market.
During the analysis stage, feedback from the stakeholder groups would be compared to determine areas of agreement as well as areas of divergence


