
Key Insights
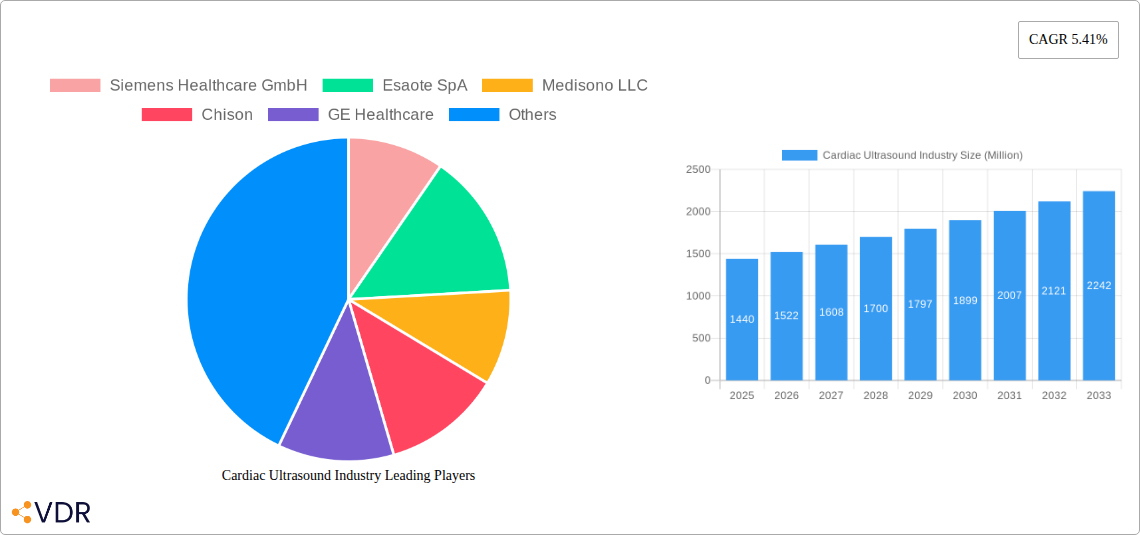
The global cardiac ultrasound market, valued at $1.44 billion in 2025, is projected to experience robust growth, driven by a compound annual growth rate (CAGR) of 5.41% from 2025 to 2033. This expansion is fueled by several key factors. The rising prevalence of cardiovascular diseases globally necessitates increased diagnostic testing, boosting demand for echocardiograms. Technological advancements, such as the introduction of 3D and 4D ultrasound systems offering improved image quality and diagnostic capabilities, are driving market growth. Furthermore, the increasing adoption of portable and handheld ultrasound systems in ambulatory care settings enhances accessibility and convenience, contributing to market expansion. The aging global population, a significant risk factor for cardiovascular diseases, further fuels this demand. Hospitals remain the largest end-user segment, followed by ambulatory care centers. Transthoracic echocardiograms constitute the largest share of test types due to their widespread use and relatively lower cost compared to transesophageal echocardiograms. Color display systems are dominant in the device display segment, although the adoption of advanced display technologies continues to increase. Key players, including Siemens Healthcare, GE Healthcare, and Philips, are actively engaged in product innovation and strategic partnerships to maintain their competitive edge.
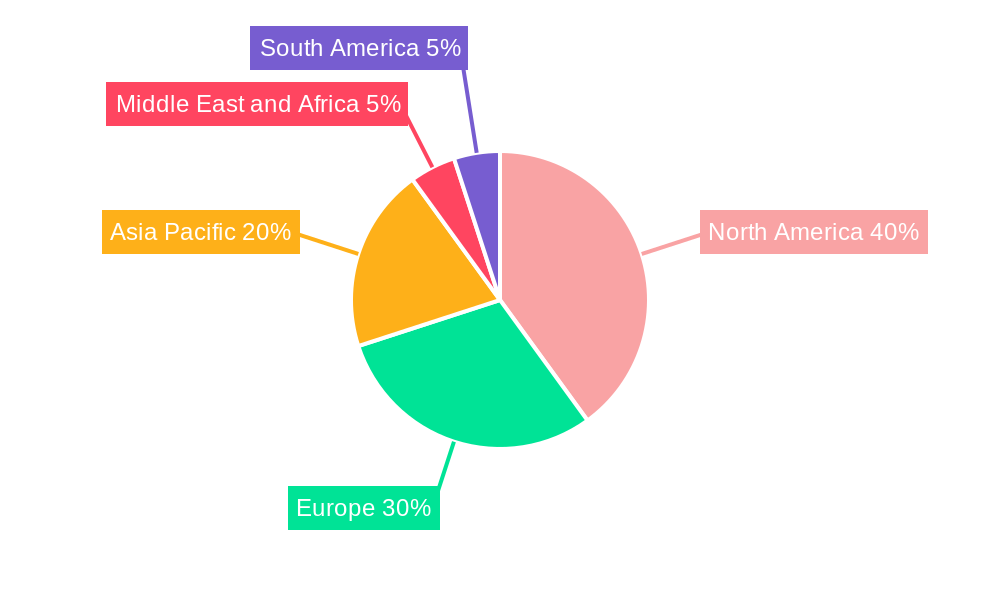
The market's geographic distribution shows a significant concentration in North America and Europe, driven by advanced healthcare infrastructure and high adoption rates of advanced technologies. However, rapidly developing economies in Asia-Pacific and the Middle East & Africa regions are emerging as significant growth opportunities, with increasing healthcare spending and rising awareness of cardiovascular health. While regulatory hurdles and high equipment costs pose challenges, the overall market outlook remains positive, with significant growth potential driven by technological innovation, expanding healthcare infrastructure, and the increasing prevalence of cardiovascular diseases across the globe. Competition is fierce amongst established players, who are constantly innovating and expanding their product portfolios to cater to the evolving needs of the healthcare sector.
Cardiac Ultrasound Industry Market Report: 2019-2033
This comprehensive report provides a detailed analysis of the Cardiac Ultrasound Industry, encompassing market dynamics, growth trends, regional performance, competitive landscape, and future outlook. The report covers the period 2019-2033, with a focus on the base year 2025 and forecast period 2025-2033. The market is segmented by end-user (Hospitals, Ambulatory Centers, Other End Users), test type (Transthoracic Echocardiogram, Transesophageal Echocardiogram, Stress Echocardiogram, Other Test Types), technology (2D, 3D and 4D, Doppler Imaging), and device display (Color Display, Black and White (B/W) Display). The report values are presented in million units.
Cardiac Ultrasound Industry Market Dynamics & Structure
The Cardiac Ultrasound market is characterized by a moderately concentrated landscape with key players vying for market share. Technological innovation, particularly in image processing and AI-driven diagnostics, is a significant driver. Stringent regulatory frameworks governing medical device approvals influence market entry and product development. The market also faces competition from alternative diagnostic techniques. End-user demographics, especially the aging population and rising prevalence of cardiovascular diseases, are key growth factors. M&A activity has been moderate, with a focus on strategic partnerships and acquisitions of smaller players by larger corporations. The overall market size in 2025 is estimated at xx million units.
- Market Concentration: Moderately concentrated, with the top 5 players holding an estimated xx% market share in 2025.
- Technological Innovation: AI integration, 3D/4D imaging advancements, and improved portability are driving innovation.
- Regulatory Framework: Stringent FDA and CE mark approvals influence market entry and product lifecycles.
- Competitive Substitutes: Other cardiovascular diagnostic techniques pose competitive pressure.
- M&A Trends: Moderate activity, primarily focused on strategic acquisitions and partnerships for technology enhancement. xx M&A deals were recorded between 2019-2024.
Cardiac Ultrasound Industry Growth Trends & Insights
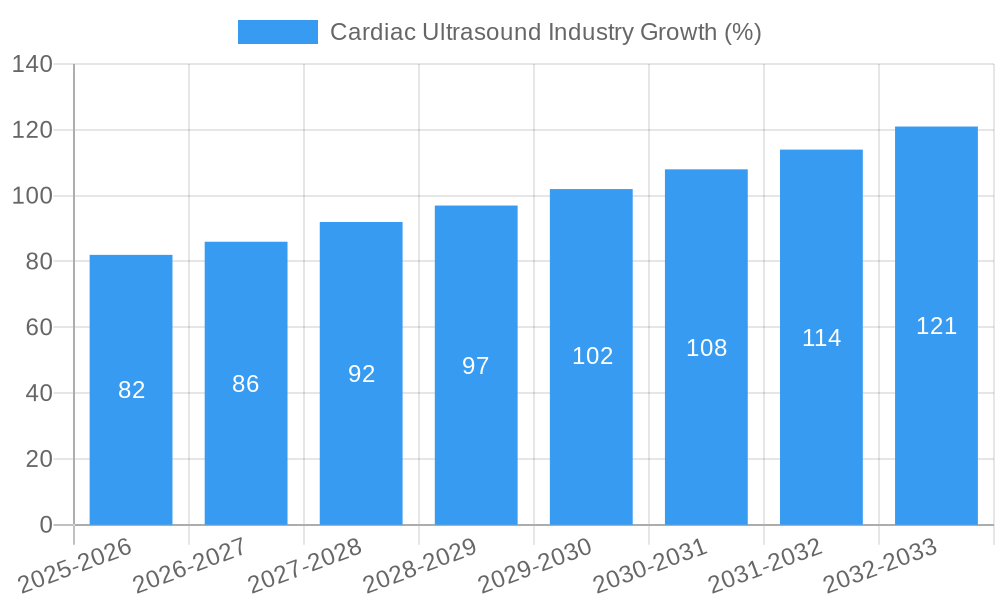
The Cardiac Ultrasound market experienced substantial growth during the historical period (2019-2024), driven by factors such as increasing prevalence of cardiovascular diseases, technological advancements, and rising healthcare expenditure. The market is expected to maintain a healthy CAGR of xx% during the forecast period (2025-2033), reaching an estimated xx million units by 2033. This growth is fueled by the adoption of advanced imaging technologies, expanding applications in various healthcare settings, and the rising demand for point-of-care diagnostics. Market penetration is expected to increase significantly, especially in emerging economies. Consumer behavior shifts towards preventative healthcare and personalized medicine further contribute to market expansion.
Dominant Regions, Countries, or Segments in Cardiac Ultrasound Industry
North America currently holds the largest market share, driven by high healthcare expenditure, advanced infrastructure, and early adoption of new technologies. However, Asia-Pacific is poised for rapid growth due to increasing healthcare investments, rising prevalence of cardiovascular diseases, and expanding healthcare infrastructure. Within the segments, the Transthoracic Echocardiogram test type commands the largest market share, due to its wide applicability and relatively lower cost. Hospitals constitute the major end-user segment, with high demand driven by diagnostic needs. The use of color display systems is significantly higher than the B/W display systems.
- Key Growth Drivers (North America): High healthcare expenditure, advanced medical infrastructure, and early adoption of new technologies.
- Key Growth Drivers (Asia-Pacific): Rising healthcare expenditure, increasing prevalence of cardiovascular diseases, and expanding healthcare infrastructure.
- Dominant Segment: Transthoracic Echocardiogram (test type), Hospitals (end-user), Color Display (device display).
Cardiac Ultrasound Industry Product Landscape
The cardiac ultrasound product landscape is marked by continuous innovation, with advancements in image quality, portability, and software features. Products range from basic 2D systems to advanced 3D/4D and Doppler imaging systems. Key features include improved image resolution, enhanced workflow efficiency, and integrated analysis software. Unique selling propositions often center on ease of use, advanced imaging capabilities, and robust data management systems. Recent advancements in AI-powered image analysis are transforming the sector.
Key Drivers, Barriers & Challenges in Cardiac Ultrasound Industry
Key Drivers: Rising prevalence of cardiovascular diseases, technological advancements (AI integration, 3D/4D imaging), and increasing healthcare expenditure. Government initiatives promoting preventative healthcare also stimulate market growth.
Key Challenges: High initial investment costs for advanced systems, stringent regulatory approvals, and competition from alternative diagnostic methods. Supply chain disruptions due to global events can also impact market growth. The competitive landscape further presents challenges, with established companies constantly innovating.
Emerging Opportunities in Cardiac Ultrasound Industry
Emerging opportunities lie in the adoption of AI-powered image analysis, expansion into point-of-care diagnostics, integration with telehealth platforms, and the development of portable and cost-effective systems for use in underserved regions. There is also potential for growth in specialized applications such as stress echocardiography and fetal echocardiography.
Growth Accelerators in the Cardiac Ultrasound Industry
Technological advancements, strategic partnerships and collaborations, and expansion into emerging markets are major growth catalysts. The development of cost-effective and portable devices will further accelerate market penetration in underserved regions. Stronger government regulations promoting cardiovascular health will also boost growth.
Key Players Shaping the Cardiac Ultrasound Industry Market
- Siemens Healthcare GmbH
- Esaote SpA
- Medisono LLC
- Chison
- GE Healthcare
- Whale Imaging
- FUJIFILM Holdings Corporation
- Clarius Mobile Health
- Koninklijke Philips NV
- Canon Medical Systems
- Samsung Healthcare
Notable Milestones in Cardiac Ultrasound Industry Sector
- May 2022: Philips launched EchoNavigator 4.0, enhancing image-guided therapy for structural heart disease.
- May 2022: FUJIFILM VisualSonics launched the Vevo F2 imaging platform for preclinical ultrasound.
In-Depth Cardiac Ultrasound Industry Market Outlook
The Cardiac Ultrasound market is poised for continued growth, driven by technological innovations, expanding applications, and increasing healthcare investments. Strategic partnerships, market expansion in emerging economies, and the development of cost-effective and portable devices will further fuel market expansion. The market presents significant opportunities for established players and new entrants alike, offering substantial potential for long-term growth.
Cardiac Ultrasound Industry Segmentation
-
1. Test Type
- 1.1. Transthoracic Echocardiogram
- 1.2. Transesophageal Echocardiogram
- 1.3. Stress Echocardiogram
- 1.4. Other Test Types
-
2. Technology
- 2.1. 2D
- 2.2. 3D and 4D
- 2.3. Doppler Imaging
-
3. Device Display
- 3.1. Color Display
- 3.2. Black and White (B/W) Display
-
4. End User
- 4.1. Hospitals
- 4.2. Ambulatory Centers
- 4.3. Other End Users
Cardiac Ultrasound Industry Segmentation By Geography
-
1. North America
- 1.1. United States
- 1.2. Canada
- 1.3. Mexico
-
2. Europe
- 2.1. Germany
- 2.2. United Kingdom
- 2.3. France
- 2.4. Italy
- 2.5. Spain
- 2.6. Rest of Europe
-
3. Asia Pacific
- 3.1. China
- 3.2. Japan
- 3.3. India
- 3.4. Australia
- 3.5. South Korea
- 3.6. Rest of Asia Pacific
-
4. Middle East and Africa
- 4.1. GCC
- 4.2. South Africa
- 4.3. Rest of Middle East and Africa
-
5. South America
- 5.1. Brazil
- 5.2. Argentina
- 5.3. Rest of South America
Cardiac Ultrasound Industry REPORT HIGHLIGHTS
| Aspects | Details |
|---|---|
| Study Period | 2019-2033 |
| Base Year | 2024 |
| Estimated Year | 2025 |
| Forecast Period | 2025-2033 |
| Historical Period | 2019-2024 |
| Growth Rate | CAGR of 5.41% from 2019-2033 |
| Segmentation |
|
Table of Contents
- 1. Introduction
- 1.1. Research Scope
- 1.2. Market Segmentation
- 1.3. Research Methodology
- 1.4. Definitions and Assumptions
- 2. Executive Summary
- 2.1. Introduction
- 3. Market Dynamics
- 3.1. Introduction
- 3.2. Market Drivers
- 3.2.1. Increasing Incidence of Cardiovascular Diseases (CVDs); Rise in Technological Advancements; Advantages of Echocardiography over Invasive Cardiac Diagnostic Procedures
- 3.3. Market Restrains
- 3.3.1. Unfavorable Reimbursement Scenario; Economic Impact of Adopting New Technologies
- 3.4. Market Trends
- 3.4.1. The 2D Ultrasound Imaging Segment is Expected to be Fastest Growing Segment Over the Forecast Period
- 4. Market Factor Analysis
- 4.1. Porters Five Forces
- 4.2. Supply/Value Chain
- 4.3. PESTEL analysis
- 4.4. Market Entropy
- 4.5. Patent/Trademark Analysis
- 5. Global Cardiac Ultrasound Industry Analysis, Insights and Forecast, 2019-2031
- 5.1. Market Analysis, Insights and Forecast - by Test Type
- 5.1.1. Transthoracic Echocardiogram
- 5.1.2. Transesophageal Echocardiogram
- 5.1.3. Stress Echocardiogram
- 5.1.4. Other Test Types
- 5.2. Market Analysis, Insights and Forecast - by Technology
- 5.2.1. 2D
- 5.2.2. 3D and 4D
- 5.2.3. Doppler Imaging
- 5.3. Market Analysis, Insights and Forecast - by Device Display
- 5.3.1. Color Display
- 5.3.2. Black and White (B/W) Display
- 5.4. Market Analysis, Insights and Forecast - by End User
- 5.4.1. Hospitals
- 5.4.2. Ambulatory Centers
- 5.4.3. Other End Users
- 5.5. Market Analysis, Insights and Forecast - by Region
- 5.5.1. North America
- 5.5.2. Europe
- 5.5.3. Asia Pacific
- 5.5.4. Middle East and Africa
- 5.5.5. South America
- 5.1. Market Analysis, Insights and Forecast - by Test Type
- 6. North America Cardiac Ultrasound Industry Analysis, Insights and Forecast, 2019-2031
- 6.1. Market Analysis, Insights and Forecast - by Test Type
- 6.1.1. Transthoracic Echocardiogram
- 6.1.2. Transesophageal Echocardiogram
- 6.1.3. Stress Echocardiogram
- 6.1.4. Other Test Types
- 6.2. Market Analysis, Insights and Forecast - by Technology
- 6.2.1. 2D
- 6.2.2. 3D and 4D
- 6.2.3. Doppler Imaging
- 6.3. Market Analysis, Insights and Forecast - by Device Display
- 6.3.1. Color Display
- 6.3.2. Black and White (B/W) Display
- 6.4. Market Analysis, Insights and Forecast - by End User
- 6.4.1. Hospitals
- 6.4.2. Ambulatory Centers
- 6.4.3. Other End Users
- 6.1. Market Analysis, Insights and Forecast - by Test Type
- 7. Europe Cardiac Ultrasound Industry Analysis, Insights and Forecast, 2019-2031
- 7.1. Market Analysis, Insights and Forecast - by Test Type
- 7.1.1. Transthoracic Echocardiogram
- 7.1.2. Transesophageal Echocardiogram
- 7.1.3. Stress Echocardiogram
- 7.1.4. Other Test Types
- 7.2. Market Analysis, Insights and Forecast - by Technology
- 7.2.1. 2D
- 7.2.2. 3D and 4D
- 7.2.3. Doppler Imaging
- 7.3. Market Analysis, Insights and Forecast - by Device Display
- 7.3.1. Color Display
- 7.3.2. Black and White (B/W) Display
- 7.4. Market Analysis, Insights and Forecast - by End User
- 7.4.1. Hospitals
- 7.4.2. Ambulatory Centers
- 7.4.3. Other End Users
- 7.1. Market Analysis, Insights and Forecast - by Test Type
- 8. Asia Pacific Cardiac Ultrasound Industry Analysis, Insights and Forecast, 2019-2031
- 8.1. Market Analysis, Insights and Forecast - by Test Type
- 8.1.1. Transthoracic Echocardiogram
- 8.1.2. Transesophageal Echocardiogram
- 8.1.3. Stress Echocardiogram
- 8.1.4. Other Test Types
- 8.2. Market Analysis, Insights and Forecast - by Technology
- 8.2.1. 2D
- 8.2.2. 3D and 4D
- 8.2.3. Doppler Imaging
- 8.3. Market Analysis, Insights and Forecast - by Device Display
- 8.3.1. Color Display
- 8.3.2. Black and White (B/W) Display
- 8.4. Market Analysis, Insights and Forecast - by End User
- 8.4.1. Hospitals
- 8.4.2. Ambulatory Centers
- 8.4.3. Other End Users
- 8.1. Market Analysis, Insights and Forecast - by Test Type
- 9. Middle East and Africa Cardiac Ultrasound Industry Analysis, Insights and Forecast, 2019-2031
- 9.1. Market Analysis, Insights and Forecast - by Test Type
- 9.1.1. Transthoracic Echocardiogram
- 9.1.2. Transesophageal Echocardiogram
- 9.1.3. Stress Echocardiogram
- 9.1.4. Other Test Types
- 9.2. Market Analysis, Insights and Forecast - by Technology
- 9.2.1. 2D
- 9.2.2. 3D and 4D
- 9.2.3. Doppler Imaging
- 9.3. Market Analysis, Insights and Forecast - by Device Display
- 9.3.1. Color Display
- 9.3.2. Black and White (B/W) Display
- 9.4. Market Analysis, Insights and Forecast - by End User
- 9.4.1. Hospitals
- 9.4.2. Ambulatory Centers
- 9.4.3. Other End Users
- 9.1. Market Analysis, Insights and Forecast - by Test Type
- 10. South America Cardiac Ultrasound Industry Analysis, Insights and Forecast, 2019-2031
- 10.1. Market Analysis, Insights and Forecast - by Test Type
- 10.1.1. Transthoracic Echocardiogram
- 10.1.2. Transesophageal Echocardiogram
- 10.1.3. Stress Echocardiogram
- 10.1.4. Other Test Types
- 10.2. Market Analysis, Insights and Forecast - by Technology
- 10.2.1. 2D
- 10.2.2. 3D and 4D
- 10.2.3. Doppler Imaging
- 10.3. Market Analysis, Insights and Forecast - by Device Display
- 10.3.1. Color Display
- 10.3.2. Black and White (B/W) Display
- 10.4. Market Analysis, Insights and Forecast - by End User
- 10.4.1. Hospitals
- 10.4.2. Ambulatory Centers
- 10.4.3. Other End Users
- 10.1. Market Analysis, Insights and Forecast - by Test Type
- 11. North America Cardiac Ultrasound Industry Analysis, Insights and Forecast, 2019-2031
- 11.1. Market Analysis, Insights and Forecast - By Country/Sub-region
- 11.1.1 United States
- 11.1.2 Canada
- 11.1.3 Mexico
- 12. Europe Cardiac Ultrasound Industry Analysis, Insights and Forecast, 2019-2031
- 12.1. Market Analysis, Insights and Forecast - By Country/Sub-region
- 12.1.1 Germany
- 12.1.2 United Kingdom
- 12.1.3 France
- 12.1.4 Italy
- 12.1.5 Spain
- 12.1.6 Rest of Europe
- 13. Asia Pacific Cardiac Ultrasound Industry Analysis, Insights and Forecast, 2019-2031
- 13.1. Market Analysis, Insights and Forecast - By Country/Sub-region
- 13.1.1 China
- 13.1.2 Japan
- 13.1.3 India
- 13.1.4 Australia
- 13.1.5 South Korea
- 13.1.6 Rest of Asia Pacific
- 14. Middle East and Africa Cardiac Ultrasound Industry Analysis, Insights and Forecast, 2019-2031
- 14.1. Market Analysis, Insights and Forecast - By Country/Sub-region
- 14.1.1 GCC
- 14.1.2 South Africa
- 14.1.3 Rest of Middle East and Africa
- 15. South America Cardiac Ultrasound Industry Analysis, Insights and Forecast, 2019-2031
- 15.1. Market Analysis, Insights and Forecast - By Country/Sub-region
- 15.1.1 Brazil
- 15.1.2 Argentina
- 15.1.3 Rest of South America
- 16. Competitive Analysis
- 16.1. Global Market Share Analysis 2024
- 16.2. Company Profiles
- 16.2.1 Siemens Healthcare GmbH
- 16.2.1.1. Overview
- 16.2.1.2. Products
- 16.2.1.3. SWOT Analysis
- 16.2.1.4. Recent Developments
- 16.2.1.5. Financials (Based on Availability)
- 16.2.2 Esaote SpA
- 16.2.2.1. Overview
- 16.2.2.2. Products
- 16.2.2.3. SWOT Analysis
- 16.2.2.4. Recent Developments
- 16.2.2.5. Financials (Based on Availability)
- 16.2.3 Medisono LLC
- 16.2.3.1. Overview
- 16.2.3.2. Products
- 16.2.3.3. SWOT Analysis
- 16.2.3.4. Recent Developments
- 16.2.3.5. Financials (Based on Availability)
- 16.2.4 Chison
- 16.2.4.1. Overview
- 16.2.4.2. Products
- 16.2.4.3. SWOT Analysis
- 16.2.4.4. Recent Developments
- 16.2.4.5. Financials (Based on Availability)
- 16.2.5 GE Healthcare
- 16.2.5.1. Overview
- 16.2.5.2. Products
- 16.2.5.3. SWOT Analysis
- 16.2.5.4. Recent Developments
- 16.2.5.5. Financials (Based on Availability)
- 16.2.6 Whale Imaging
- 16.2.6.1. Overview
- 16.2.6.2. Products
- 16.2.6.3. SWOT Analysis
- 16.2.6.4. Recent Developments
- 16.2.6.5. Financials (Based on Availability)
- 16.2.7 FUJIFILM Holdings Corporation
- 16.2.7.1. Overview
- 16.2.7.2. Products
- 16.2.7.3. SWOT Analysis
- 16.2.7.4. Recent Developments
- 16.2.7.5. Financials (Based on Availability)
- 16.2.8 Clarius Mobile Health
- 16.2.8.1. Overview
- 16.2.8.2. Products
- 16.2.8.3. SWOT Analysis
- 16.2.8.4. Recent Developments
- 16.2.8.5. Financials (Based on Availability)
- 16.2.9 Koninklijke Philips NV
- 16.2.9.1. Overview
- 16.2.9.2. Products
- 16.2.9.3. SWOT Analysis
- 16.2.9.4. Recent Developments
- 16.2.9.5. Financials (Based on Availability)
- 16.2.10 Canon Medical Systems
- 16.2.10.1. Overview
- 16.2.10.2. Products
- 16.2.10.3. SWOT Analysis
- 16.2.10.4. Recent Developments
- 16.2.10.5. Financials (Based on Availability)
- 16.2.11 Samsung Healthcare
- 16.2.11.1. Overview
- 16.2.11.2. Products
- 16.2.11.3. SWOT Analysis
- 16.2.11.4. Recent Developments
- 16.2.11.5. Financials (Based on Availability)
- 16.2.1 Siemens Healthcare GmbH
List of Figures
- Figure 1: Global Cardiac Ultrasound Industry Revenue Breakdown (Million, %) by Region 2024 & 2032
- Figure 2: North America Cardiac Ultrasound Industry Revenue (Million), by Country 2024 & 2032
- Figure 3: North America Cardiac Ultrasound Industry Revenue Share (%), by Country 2024 & 2032
- Figure 4: Europe Cardiac Ultrasound Industry Revenue (Million), by Country 2024 & 2032
- Figure 5: Europe Cardiac Ultrasound Industry Revenue Share (%), by Country 2024 & 2032
- Figure 6: Asia Pacific Cardiac Ultrasound Industry Revenue (Million), by Country 2024 & 2032
- Figure 7: Asia Pacific Cardiac Ultrasound Industry Revenue Share (%), by Country 2024 & 2032
- Figure 8: Middle East and Africa Cardiac Ultrasound Industry Revenue (Million), by Country 2024 & 2032
- Figure 9: Middle East and Africa Cardiac Ultrasound Industry Revenue Share (%), by Country 2024 & 2032
- Figure 10: South America Cardiac Ultrasound Industry Revenue (Million), by Country 2024 & 2032
- Figure 11: South America Cardiac Ultrasound Industry Revenue Share (%), by Country 2024 & 2032
- Figure 12: North America Cardiac Ultrasound Industry Revenue (Million), by Test Type 2024 & 2032
- Figure 13: North America Cardiac Ultrasound Industry Revenue Share (%), by Test Type 2024 & 2032
- Figure 14: North America Cardiac Ultrasound Industry Revenue (Million), by Technology 2024 & 2032
- Figure 15: North America Cardiac Ultrasound Industry Revenue Share (%), by Technology 2024 & 2032
- Figure 16: North America Cardiac Ultrasound Industry Revenue (Million), by Device Display 2024 & 2032
- Figure 17: North America Cardiac Ultrasound Industry Revenue Share (%), by Device Display 2024 & 2032
- Figure 18: North America Cardiac Ultrasound Industry Revenue (Million), by End User 2024 & 2032
- Figure 19: North America Cardiac Ultrasound Industry Revenue Share (%), by End User 2024 & 2032
- Figure 20: North America Cardiac Ultrasound Industry Revenue (Million), by Country 2024 & 2032
- Figure 21: North America Cardiac Ultrasound Industry Revenue Share (%), by Country 2024 & 2032
- Figure 22: Europe Cardiac Ultrasound Industry Revenue (Million), by Test Type 2024 & 2032
- Figure 23: Europe Cardiac Ultrasound Industry Revenue Share (%), by Test Type 2024 & 2032
- Figure 24: Europe Cardiac Ultrasound Industry Revenue (Million), by Technology 2024 & 2032
- Figure 25: Europe Cardiac Ultrasound Industry Revenue Share (%), by Technology 2024 & 2032
- Figure 26: Europe Cardiac Ultrasound Industry Revenue (Million), by Device Display 2024 & 2032
- Figure 27: Europe Cardiac Ultrasound Industry Revenue Share (%), by Device Display 2024 & 2032
- Figure 28: Europe Cardiac Ultrasound Industry Revenue (Million), by End User 2024 & 2032
- Figure 29: Europe Cardiac Ultrasound Industry Revenue Share (%), by End User 2024 & 2032
- Figure 30: Europe Cardiac Ultrasound Industry Revenue (Million), by Country 2024 & 2032
- Figure 31: Europe Cardiac Ultrasound Industry Revenue Share (%), by Country 2024 & 2032
- Figure 32: Asia Pacific Cardiac Ultrasound Industry Revenue (Million), by Test Type 2024 & 2032
- Figure 33: Asia Pacific Cardiac Ultrasound Industry Revenue Share (%), by Test Type 2024 & 2032
- Figure 34: Asia Pacific Cardiac Ultrasound Industry Revenue (Million), by Technology 2024 & 2032
- Figure 35: Asia Pacific Cardiac Ultrasound Industry Revenue Share (%), by Technology 2024 & 2032
- Figure 36: Asia Pacific Cardiac Ultrasound Industry Revenue (Million), by Device Display 2024 & 2032
- Figure 37: Asia Pacific Cardiac Ultrasound Industry Revenue Share (%), by Device Display 2024 & 2032
- Figure 38: Asia Pacific Cardiac Ultrasound Industry Revenue (Million), by End User 2024 & 2032
- Figure 39: Asia Pacific Cardiac Ultrasound Industry Revenue Share (%), by End User 2024 & 2032
- Figure 40: Asia Pacific Cardiac Ultrasound Industry Revenue (Million), by Country 2024 & 2032
- Figure 41: Asia Pacific Cardiac Ultrasound Industry Revenue Share (%), by Country 2024 & 2032
- Figure 42: Middle East and Africa Cardiac Ultrasound Industry Revenue (Million), by Test Type 2024 & 2032
- Figure 43: Middle East and Africa Cardiac Ultrasound Industry Revenue Share (%), by Test Type 2024 & 2032
- Figure 44: Middle East and Africa Cardiac Ultrasound Industry Revenue (Million), by Technology 2024 & 2032
- Figure 45: Middle East and Africa Cardiac Ultrasound Industry Revenue Share (%), by Technology 2024 & 2032
- Figure 46: Middle East and Africa Cardiac Ultrasound Industry Revenue (Million), by Device Display 2024 & 2032
- Figure 47: Middle East and Africa Cardiac Ultrasound Industry Revenue Share (%), by Device Display 2024 & 2032
- Figure 48: Middle East and Africa Cardiac Ultrasound Industry Revenue (Million), by End User 2024 & 2032
- Figure 49: Middle East and Africa Cardiac Ultrasound Industry Revenue Share (%), by End User 2024 & 2032
- Figure 50: Middle East and Africa Cardiac Ultrasound Industry Revenue (Million), by Country 2024 & 2032
- Figure 51: Middle East and Africa Cardiac Ultrasound Industry Revenue Share (%), by Country 2024 & 2032
- Figure 52: South America Cardiac Ultrasound Industry Revenue (Million), by Test Type 2024 & 2032
- Figure 53: South America Cardiac Ultrasound Industry Revenue Share (%), by Test Type 2024 & 2032
- Figure 54: South America Cardiac Ultrasound Industry Revenue (Million), by Technology 2024 & 2032
- Figure 55: South America Cardiac Ultrasound Industry Revenue Share (%), by Technology 2024 & 2032
- Figure 56: South America Cardiac Ultrasound Industry Revenue (Million), by Device Display 2024 & 2032
- Figure 57: South America Cardiac Ultrasound Industry Revenue Share (%), by Device Display 2024 & 2032
- Figure 58: South America Cardiac Ultrasound Industry Revenue (Million), by End User 2024 & 2032
- Figure 59: South America Cardiac Ultrasound Industry Revenue Share (%), by End User 2024 & 2032
- Figure 60: South America Cardiac Ultrasound Industry Revenue (Million), by Country 2024 & 2032
- Figure 61: South America Cardiac Ultrasound Industry Revenue Share (%), by Country 2024 & 2032
List of Tables
- Table 1: Global Cardiac Ultrasound Industry Revenue Million Forecast, by Region 2019 & 2032
- Table 2: Global Cardiac Ultrasound Industry Revenue Million Forecast, by Test Type 2019 & 2032
- Table 3: Global Cardiac Ultrasound Industry Revenue Million Forecast, by Technology 2019 & 2032
- Table 4: Global Cardiac Ultrasound Industry Revenue Million Forecast, by Device Display 2019 & 2032
- Table 5: Global Cardiac Ultrasound Industry Revenue Million Forecast, by End User 2019 & 2032
- Table 6: Global Cardiac Ultrasound Industry Revenue Million Forecast, by Region 2019 & 2032
- Table 7: Global Cardiac Ultrasound Industry Revenue Million Forecast, by Country 2019 & 2032
- Table 8: United States Cardiac Ultrasound Industry Revenue (Million) Forecast, by Application 2019 & 2032
- Table 9: Canada Cardiac Ultrasound Industry Revenue (Million) Forecast, by Application 2019 & 2032
- Table 10: Mexico Cardiac Ultrasound Industry Revenue (Million) Forecast, by Application 2019 & 2032
- Table 11: Global Cardiac Ultrasound Industry Revenue Million Forecast, by Country 2019 & 2032
- Table 12: Germany Cardiac Ultrasound Industry Revenue (Million) Forecast, by Application 2019 & 2032
- Table 13: United Kingdom Cardiac Ultrasound Industry Revenue (Million) Forecast, by Application 2019 & 2032
- Table 14: France Cardiac Ultrasound Industry Revenue (Million) Forecast, by Application 2019 & 2032
- Table 15: Italy Cardiac Ultrasound Industry Revenue (Million) Forecast, by Application 2019 & 2032
- Table 16: Spain Cardiac Ultrasound Industry Revenue (Million) Forecast, by Application 2019 & 2032
- Table 17: Rest of Europe Cardiac Ultrasound Industry Revenue (Million) Forecast, by Application 2019 & 2032
- Table 18: Global Cardiac Ultrasound Industry Revenue Million Forecast, by Country 2019 & 2032
- Table 19: China Cardiac Ultrasound Industry Revenue (Million) Forecast, by Application 2019 & 2032
- Table 20: Japan Cardiac Ultrasound Industry Revenue (Million) Forecast, by Application 2019 & 2032
- Table 21: India Cardiac Ultrasound Industry Revenue (Million) Forecast, by Application 2019 & 2032
- Table 22: Australia Cardiac Ultrasound Industry Revenue (Million) Forecast, by Application 2019 & 2032
- Table 23: South Korea Cardiac Ultrasound Industry Revenue (Million) Forecast, by Application 2019 & 2032
- Table 24: Rest of Asia Pacific Cardiac Ultrasound Industry Revenue (Million) Forecast, by Application 2019 & 2032
- Table 25: Global Cardiac Ultrasound Industry Revenue Million Forecast, by Country 2019 & 2032
- Table 26: GCC Cardiac Ultrasound Industry Revenue (Million) Forecast, by Application 2019 & 2032
- Table 27: South Africa Cardiac Ultrasound Industry Revenue (Million) Forecast, by Application 2019 & 2032
- Table 28: Rest of Middle East and Africa Cardiac Ultrasound Industry Revenue (Million) Forecast, by Application 2019 & 2032
- Table 29: Global Cardiac Ultrasound Industry Revenue Million Forecast, by Country 2019 & 2032
- Table 30: Brazil Cardiac Ultrasound Industry Revenue (Million) Forecast, by Application 2019 & 2032
- Table 31: Argentina Cardiac Ultrasound Industry Revenue (Million) Forecast, by Application 2019 & 2032
- Table 32: Rest of South America Cardiac Ultrasound Industry Revenue (Million) Forecast, by Application 2019 & 2032
- Table 33: Global Cardiac Ultrasound Industry Revenue Million Forecast, by Test Type 2019 & 2032
- Table 34: Global Cardiac Ultrasound Industry Revenue Million Forecast, by Technology 2019 & 2032
- Table 35: Global Cardiac Ultrasound Industry Revenue Million Forecast, by Device Display 2019 & 2032
- Table 36: Global Cardiac Ultrasound Industry Revenue Million Forecast, by End User 2019 & 2032
- Table 37: Global Cardiac Ultrasound Industry Revenue Million Forecast, by Country 2019 & 2032
- Table 38: United States Cardiac Ultrasound Industry Revenue (Million) Forecast, by Application 2019 & 2032
- Table 39: Canada Cardiac Ultrasound Industry Revenue (Million) Forecast, by Application 2019 & 2032
- Table 40: Mexico Cardiac Ultrasound Industry Revenue (Million) Forecast, by Application 2019 & 2032
- Table 41: Global Cardiac Ultrasound Industry Revenue Million Forecast, by Test Type 2019 & 2032
- Table 42: Global Cardiac Ultrasound Industry Revenue Million Forecast, by Technology 2019 & 2032
- Table 43: Global Cardiac Ultrasound Industry Revenue Million Forecast, by Device Display 2019 & 2032
- Table 44: Global Cardiac Ultrasound Industry Revenue Million Forecast, by End User 2019 & 2032
- Table 45: Global Cardiac Ultrasound Industry Revenue Million Forecast, by Country 2019 & 2032
- Table 46: Germany Cardiac Ultrasound Industry Revenue (Million) Forecast, by Application 2019 & 2032
- Table 47: United Kingdom Cardiac Ultrasound Industry Revenue (Million) Forecast, by Application 2019 & 2032
- Table 48: France Cardiac Ultrasound Industry Revenue (Million) Forecast, by Application 2019 & 2032
- Table 49: Italy Cardiac Ultrasound Industry Revenue (Million) Forecast, by Application 2019 & 2032
- Table 50: Spain Cardiac Ultrasound Industry Revenue (Million) Forecast, by Application 2019 & 2032
- Table 51: Rest of Europe Cardiac Ultrasound Industry Revenue (Million) Forecast, by Application 2019 & 2032
- Table 52: Global Cardiac Ultrasound Industry Revenue Million Forecast, by Test Type 2019 & 2032
- Table 53: Global Cardiac Ultrasound Industry Revenue Million Forecast, by Technology 2019 & 2032
- Table 54: Global Cardiac Ultrasound Industry Revenue Million Forecast, by Device Display 2019 & 2032
- Table 55: Global Cardiac Ultrasound Industry Revenue Million Forecast, by End User 2019 & 2032
- Table 56: Global Cardiac Ultrasound Industry Revenue Million Forecast, by Country 2019 & 2032
- Table 57: China Cardiac Ultrasound Industry Revenue (Million) Forecast, by Application 2019 & 2032
- Table 58: Japan Cardiac Ultrasound Industry Revenue (Million) Forecast, by Application 2019 & 2032
- Table 59: India Cardiac Ultrasound Industry Revenue (Million) Forecast, by Application 2019 & 2032
- Table 60: Australia Cardiac Ultrasound Industry Revenue (Million) Forecast, by Application 2019 & 2032
- Table 61: South Korea Cardiac Ultrasound Industry Revenue (Million) Forecast, by Application 2019 & 2032
- Table 62: Rest of Asia Pacific Cardiac Ultrasound Industry Revenue (Million) Forecast, by Application 2019 & 2032
- Table 63: Global Cardiac Ultrasound Industry Revenue Million Forecast, by Test Type 2019 & 2032
- Table 64: Global Cardiac Ultrasound Industry Revenue Million Forecast, by Technology 2019 & 2032
- Table 65: Global Cardiac Ultrasound Industry Revenue Million Forecast, by Device Display 2019 & 2032
- Table 66: Global Cardiac Ultrasound Industry Revenue Million Forecast, by End User 2019 & 2032
- Table 67: Global Cardiac Ultrasound Industry Revenue Million Forecast, by Country 2019 & 2032
- Table 68: GCC Cardiac Ultrasound Industry Revenue (Million) Forecast, by Application 2019 & 2032
- Table 69: South Africa Cardiac Ultrasound Industry Revenue (Million) Forecast, by Application 2019 & 2032
- Table 70: Rest of Middle East and Africa Cardiac Ultrasound Industry Revenue (Million) Forecast, by Application 2019 & 2032
- Table 71: Global Cardiac Ultrasound Industry Revenue Million Forecast, by Test Type 2019 & 2032
- Table 72: Global Cardiac Ultrasound Industry Revenue Million Forecast, by Technology 2019 & 2032
- Table 73: Global Cardiac Ultrasound Industry Revenue Million Forecast, by Device Display 2019 & 2032
- Table 74: Global Cardiac Ultrasound Industry Revenue Million Forecast, by End User 2019 & 2032
- Table 75: Global Cardiac Ultrasound Industry Revenue Million Forecast, by Country 2019 & 2032
- Table 76: Brazil Cardiac Ultrasound Industry Revenue (Million) Forecast, by Application 2019 & 2032
- Table 77: Argentina Cardiac Ultrasound Industry Revenue (Million) Forecast, by Application 2019 & 2032
- Table 78: Rest of South America Cardiac Ultrasound Industry Revenue (Million) Forecast, by Application 2019 & 2032
Frequently Asked Questions
1. What is the projected Compound Annual Growth Rate (CAGR) of the Cardiac Ultrasound Industry?
The projected CAGR is approximately 5.41%.
2. Which companies are prominent players in the Cardiac Ultrasound Industry?
Key companies in the market include Siemens Healthcare GmbH, Esaote SpA, Medisono LLC, Chison, GE Healthcare, Whale Imaging, FUJIFILM Holdings Corporation, Clarius Mobile Health, Koninklijke Philips NV, Canon Medical Systems, Samsung Healthcare.
3. What are the main segments of the Cardiac Ultrasound Industry?
The market segments include Test Type, Technology, Device Display, End User.
4. Can you provide details about the market size?
The market size is estimated to be USD 1.44 Million as of 2022.
5. What are some drivers contributing to market growth?
Increasing Incidence of Cardiovascular Diseases (CVDs); Rise in Technological Advancements; Advantages of Echocardiography over Invasive Cardiac Diagnostic Procedures.
6. What are the notable trends driving market growth?
The 2D Ultrasound Imaging Segment is Expected to be Fastest Growing Segment Over the Forecast Period.
7. Are there any restraints impacting market growth?
Unfavorable Reimbursement Scenario; Economic Impact of Adopting New Technologies.
8. Can you provide examples of recent developments in the market?
In May 2022, Phillips launched EchoNavigator 4.0, the new release of its image-guided therapy solution for the treatment of structural heart disease.
9. What pricing options are available for accessing the report?
Pricing options include single-user, multi-user, and enterprise licenses priced at USD 4750, USD 5250, and USD 8750 respectively.
10. Is the market size provided in terms of value or volume?
The market size is provided in terms of value, measured in Million.
11. Are there any specific market keywords associated with the report?
Yes, the market keyword associated with the report is "Cardiac Ultrasound Industry," which aids in identifying and referencing the specific market segment covered.
12. How do I determine which pricing option suits my needs best?
The pricing options vary based on user requirements and access needs. Individual users may opt for single-user licenses, while businesses requiring broader access may choose multi-user or enterprise licenses for cost-effective access to the report.
13. Are there any additional resources or data provided in the Cardiac Ultrasound Industry report?
While the report offers comprehensive insights, it's advisable to review the specific contents or supplementary materials provided to ascertain if additional resources or data are available.
14. How can I stay updated on further developments or reports in the Cardiac Ultrasound Industry?
To stay informed about further developments, trends, and reports in the Cardiac Ultrasound Industry, consider subscribing to industry newsletters, following relevant companies and organizations, or regularly checking reputable industry news sources and publications.
Methodology
Step 1 - Identification of Relevant Samples Size from Population Database


Step 2 - Approaches for Defining Global Market Size (Value, Volume* & Price*)

Note*: In applicable scenarios
Step 3 - Data Sources
Primary Research
- Web Analytics
- Survey Reports
- Research Institute
- Latest Research Reports
- Opinion Leaders
Secondary Research
- Annual Reports
- White Paper
- Latest Press Release
- Industry Association
- Paid Database
- Investor Presentations

Step 4 - Data Triangulation
Involves using different sources of information in order to increase the validity of a study
These sources are likely to be stakeholders in a program - participants, other researchers, program staff, other community members, and so on.
Then we put all data in single framework & apply various statistical tools to find out the dynamic on the market.
During the analysis stage, feedback from the stakeholder groups would be compared to determine areas of agreement as well as areas of divergence


