
Key Insights
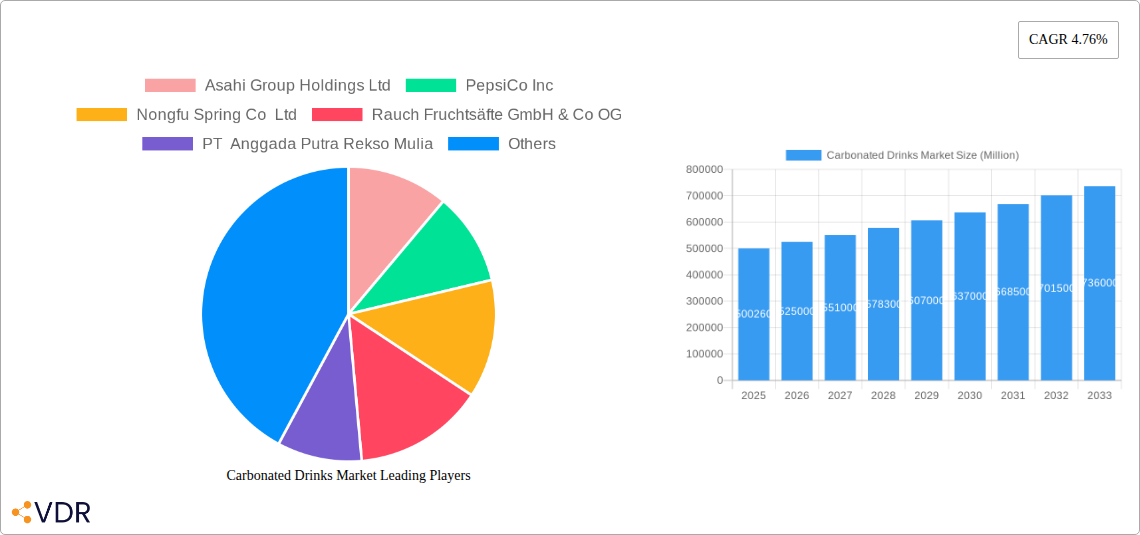
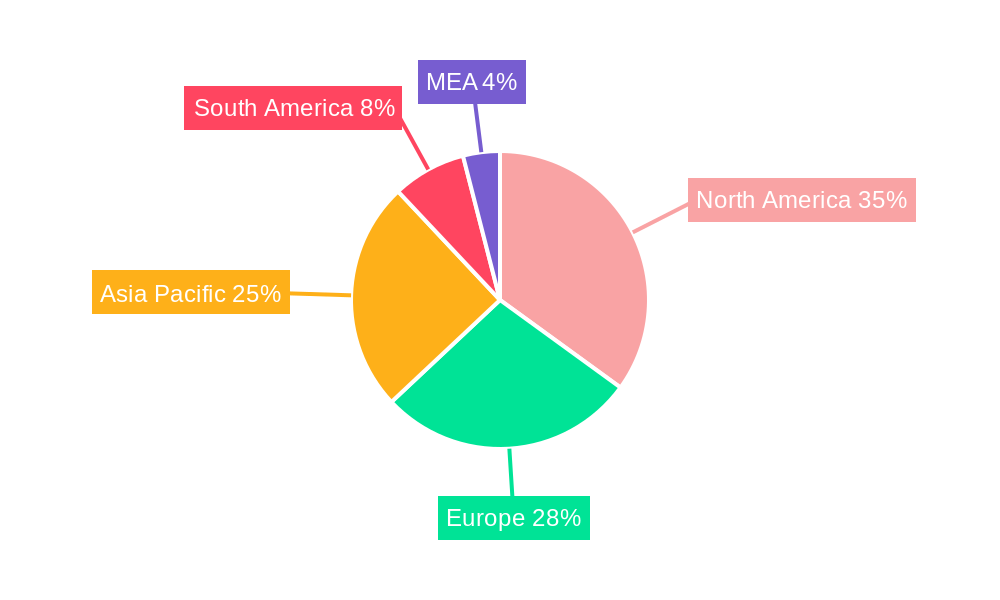
The global carbonated drinks market, valued at $500.26 billion in 2025, is projected to experience robust growth, driven by several key factors. The rising disposable incomes in developing economies, coupled with increasing urbanization and changing lifestyles, are fueling demand for convenient and refreshing beverages. Consumer preference for diverse flavors beyond traditional cola, particularly fruit-flavored carbonates and diet colas, is significantly shaping market segmentation. The packaging sector shows a strong preference for PET bottles due to their lightweight, cost-effective, and recyclability features, while the off-trade distribution channel (supermarkets, convenience stores) continues to dominate. However, growing health consciousness among consumers, concerns regarding sugar content and its link to obesity, and increasing popularity of healthier alternatives like juices and sparkling water are posing significant restraints to market expansion. Furthermore, fluctuating raw material prices and stringent government regulations on sugar content and artificial sweeteners are also impacting market growth. Competitive pressures from both established multinational corporations like Coca-Cola and PepsiCo and emerging regional players are intensifying, driving innovation and marketing strategies to capture market share. The market's regional distribution is expected to remain heavily concentrated in North America and Asia Pacific regions initially, with growth opportunities projected strongly in developing Asian markets.
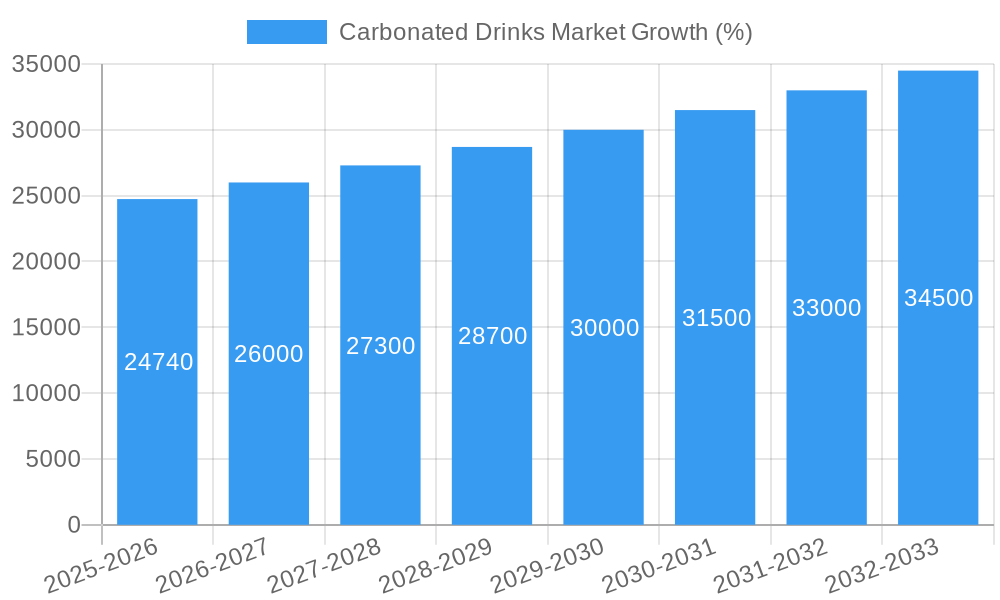
The forecast period (2025-2033) anticipates a continued, albeit moderated, expansion. The 4.76% CAGR indicates a steady increase in market value, influenced by the continuous evolution of consumer preferences and the strategic initiatives of major players. Companies are actively adapting by introducing healthier options, focusing on sustainable packaging practices, and exploring new distribution channels to counteract the challenges. Successful navigation of these challenges depends on successful innovation, marketing campaigns that successfully communicate the value proposition of carbonated drinks, and successful adaptation to changing consumer preferences across different geographic regions. Growth will be driven by continued product diversification, exploring premium segments, and leveraging e-commerce platforms for distribution.
Carbonated Drinks Market: A Comprehensive Report (2019-2033)
This comprehensive report provides an in-depth analysis of the global carbonated drinks market, encompassing historical data (2019-2024), current estimations (2025), and future projections (2025-2033). The report delves into market dynamics, growth trends, regional performance, product landscapes, key challenges, emerging opportunities, and prominent players, offering invaluable insights for industry professionals, investors, and stakeholders. The market is segmented by soft drink type (Diet Cola, Fruit Flavored Carbonates, Standard Cola, Other Types), packaging type (Disposable Cups, Glass Bottles, Metal Can, PET Bottles), and distribution channel (Off-trade, On-trade). The parent market is the beverage industry, with the child market focusing specifically on carbonated soft drinks.
Carbonated Drinks Market Dynamics & Structure
The global carbonated drinks market exhibits a moderately concentrated structure, with key players holding significant market shares. Technological innovation, particularly in flavor development, packaging, and sugar reduction, is a significant driver. Stringent regulatory frameworks concerning sugar content and labeling impact market dynamics. Competitive pressures from substitute beverages like bottled water and functional drinks influence consumer choices. End-user demographics, particularly shifting preferences towards healthier options, shape market trends. The M&A landscape has witnessed a moderate level of activity in recent years, with xx major deals recorded between 2019 and 2024.
- Market Concentration: Highly concentrated with top 10 players holding xx% market share in 2024.
- Technological Innovation: Focus on natural sweeteners, innovative flavors, sustainable packaging.
- Regulatory Framework: Varying regulations on sugar content and labeling across regions.
- Substitute Products: Increased competition from bottled water, energy drinks, and functional beverages.
- End-User Demographics: Growing health consciousness drives demand for low-sugar and healthier options.
- M&A Activity: xx major mergers and acquisitions recorded between 2019 and 2024, leading to increased market consolidation.
Carbonated Drinks Market Growth Trends & Insights
The global carbonated drinks market experienced a xx Million units CAGR between 2019 and 2024. Market size is projected to reach xx Million units in 2025, with an anticipated CAGR of xx% from 2025 to 2033. The adoption rate of new product variations, particularly sugar-free and healthier options, is steadily increasing. Technological disruptions, such as AI-driven flavor development (e.g., Coca-Cola Y3000), are reshaping the market. Consumer behavior is shifting towards more personalized and experience-driven consumption. Market penetration is high in developed regions but offers substantial growth potential in emerging economies. Changing lifestyle preferences and increasing disposable incomes are pushing the expansion of this market further. The overall growth is expected to be stable throughout the forecast period, albeit at a slower rate than before.
Dominant Regions, Countries, or Segments in Carbonated Drinks Market
The North American region dominated the carbonated drinks market in 2024, holding a xx% market share, driven by high per capita consumption and established distribution networks. Within this region, the United States held the largest market share. Strong economic growth and well-developed retail infrastructure contributed to the dominance. The PET bottles segment holds the largest share, followed by metal cans, reflecting consumer preference and logistical efficiency. The off-trade distribution channel holds the larger share owing to extensive retail availability. Within soft drink types, standard cola remains dominant, though fruit-flavored carbonates are experiencing significant growth.
- Key Drivers: High per capita consumption, established distribution networks, and robust economies in North America.
- Dominance Factors: Strong consumer preference for carbonated drinks, extensive retail networks, and marketing campaigns.
- Growth Potential: Emerging economies in Asia and Africa offer significant untapped potential.
Carbonated Drinks Market Product Landscape
The carbonated drinks market displays a diverse product landscape featuring innovations in flavor profiles, packaging materials, and functional benefits. Sugar-free and low-calorie options are gaining traction, while premium and niche segments such as flavored sparkling waters and functional sodas show robust growth. Technological advancements in flavor creation, packaging design, and carbonation techniques enhance the consumer experience. Companies are increasingly focusing on sustainable packaging options to meet environmental concerns. Unique selling propositions often include using natural ingredients, innovative flavor combinations, and eco-friendly packaging.
Key Drivers, Barriers & Challenges in Carbonated Drinks Market
Key Drivers: Rising disposable incomes, increasing urbanization, expanding retail infrastructure, and the introduction of innovative flavors and packaging solutions propel the market. Furthermore, strategic marketing and promotional campaigns by major players significantly contribute to market growth.
Key Challenges: Health concerns regarding sugar content pose a significant challenge. Increasing environmental awareness is driving demand for sustainable packaging, which is also impacting production costs. Intense competition from healthier beverage alternatives and fluctuating raw material prices create ongoing hurdles for market growth. Stringent government regulations on sugar and artificial ingredients further complicate market dynamics.
Emerging Opportunities in Carbonated Drinks Market
Emerging opportunities lie in the growing demand for healthier options like sugar-free and low-calorie carbonated drinks, functional beverages infused with vitamins and minerals, and premium, niche products catering to specific consumer preferences. Untapped markets in developing economies provide immense growth potential. Innovative packaging solutions and sustainable practices create opportunities for differentiation and market leadership. Moreover, strategic partnerships and collaborations with food and beverage brands allow for diversification and expansion into new product categories.
Growth Accelerators in the Carbonated Drinks Market Industry
Technological advancements in flavor creation, packaging, and production processes are key growth accelerators. Strategic alliances and mergers & acquisitions among industry players expand market reach and product portfolios. Marketing initiatives targeting health-conscious consumers and highlighting natural ingredients drive growth. Expansion into untapped markets, particularly in developing economies, presents significant opportunities for long-term growth.
Key Players Shaping the Carbonated Drinks Market Market
- Asahi Group Holdings Ltd
- PepsiCo Inc
- Nongfu Spring Co Ltd
- Rauch Fruchtsäfte GmbH & Co OG
- PT Anggada Putra Rekso Mulia
- Suntory Holdings Limited
- Keurig Dr Pepper Inc
- National Beverage Corp
- Refresco Group BV
- The Coca-Cola Company
- Hangzhou Wahaha Group Co Ltd
- Kirin Holdings Company Limited
- Britvic PLC
- Tingyi (Cayman Islands) Holding Corporation
- Thai Beverages PCL
Notable Milestones in Carbonated Drinks Market Sector
- January 2023: PepsiCo Inc. launched Starry, a lemon-lime flavored soda in regular and zero-sugar versions.
- October 2023: Coca-Cola launched Coca-Cola Y3000, an AI-created limited-edition flavor.
- December 2023: Kirin launched Tokusei Ginger Ale Sour and sugar-free teas in Japan, responding to health-conscious trends.
In-Depth Carbonated Drinks Market Market Outlook
The carbonated drinks market exhibits strong future potential, driven by ongoing innovation, evolving consumer preferences, and expansion into new markets. Strategic opportunities lie in developing healthier and sustainable products, leveraging technological advancements, and capitalizing on the growing demand for premium and functional beverages. The market is poised for steady growth, with significant potential for expansion in emerging economies and through strategic partnerships and acquisitions.
Carbonated Drinks Market Segmentation
-
1. Soft Drink Type
- 1.1. Diet Cola
- 1.2. Fruit Flavored Carbonates
- 1.3. Standard Cola
- 1.4. Other Types
-
2. Packaging Type
- 2.1. Disposable Cups
- 2.2. Glass Bottles
- 2.3. Metal Can
- 2.4. PET Bottles
-
3. Distribution Channel
-
3.1. Off-trade
- 3.1.1. Convenience Stores
- 3.1.2. Online Retail
- 3.1.3. Supermarket/Hypermarket
- 3.1.4. Others
- 3.2. On-trade
-
3.1. Off-trade
Carbonated Drinks Market Segmentation By Geography
-
1. North America
- 1.1. United States
- 1.2. Canada
- 1.3. Mexico
-
2. South America
- 2.1. Brazil
- 2.2. Argentina
- 2.3. Rest of South America
-
3. Europe
- 3.1. United Kingdom
- 3.2. Germany
- 3.3. France
- 3.4. Italy
- 3.5. Spain
- 3.6. Russia
- 3.7. Benelux
- 3.8. Nordics
- 3.9. Rest of Europe
-
4. Middle East & Africa
- 4.1. Turkey
- 4.2. Israel
- 4.3. GCC
- 4.4. North Africa
- 4.5. South Africa
- 4.6. Rest of Middle East & Africa
-
5. Asia Pacific
- 5.1. China
- 5.2. India
- 5.3. Japan
- 5.4. South Korea
- 5.5. ASEAN
- 5.6. Oceania
- 5.7. Rest of Asia Pacific
Carbonated Drinks Market REPORT HIGHLIGHTS
| Aspects | Details |
|---|---|
| Study Period | 2019-2033 |
| Base Year | 2024 |
| Estimated Year | 2025 |
| Forecast Period | 2025-2033 |
| Historical Period | 2019-2024 |
| Growth Rate | CAGR of 4.76% from 2019-2033 |
| Segmentation |
|
Table of Contents
- 1. Introduction
- 1.1. Research Scope
- 1.2. Market Segmentation
- 1.3. Research Methodology
- 1.4. Definitions and Assumptions
- 2. Executive Summary
- 2.1. Introduction
- 3. Market Dynamics
- 3.1. Introduction
- 3.2. Market Drivers
- 3.2.1. Growing preference for low alcoholic beer by volume (abv) or non-alcoholic beers; Rising number of breweries leading to high prominence of craft beer
- 3.3. Market Restrains
- 3.3.1. Demand for other alcoholic beverages
- 3.4. Market Trends
- 3.4.1. OTHER KEY INDUSTRY TRENDS COVERED IN THE REPORT
- 4. Market Factor Analysis
- 4.1. Porters Five Forces
- 4.2. Supply/Value Chain
- 4.3. PESTEL analysis
- 4.4. Market Entropy
- 4.5. Patent/Trademark Analysis
- 5. Global Carbonated Drinks Market Analysis, Insights and Forecast, 2019-2031
- 5.1. Market Analysis, Insights and Forecast - by Soft Drink Type
- 5.1.1. Diet Cola
- 5.1.2. Fruit Flavored Carbonates
- 5.1.3. Standard Cola
- 5.1.4. Other Types
- 5.2. Market Analysis, Insights and Forecast - by Packaging Type
- 5.2.1. Disposable Cups
- 5.2.2. Glass Bottles
- 5.2.3. Metal Can
- 5.2.4. PET Bottles
- 5.3. Market Analysis, Insights and Forecast - by Distribution Channel
- 5.3.1. Off-trade
- 5.3.1.1. Convenience Stores
- 5.3.1.2. Online Retail
- 5.3.1.3. Supermarket/Hypermarket
- 5.3.1.4. Others
- 5.3.2. On-trade
- 5.3.1. Off-trade
- 5.4. Market Analysis, Insights and Forecast - by Region
- 5.4.1. North America
- 5.4.2. South America
- 5.4.3. Europe
- 5.4.4. Middle East & Africa
- 5.4.5. Asia Pacific
- 5.1. Market Analysis, Insights and Forecast - by Soft Drink Type
- 6. North America Carbonated Drinks Market Analysis, Insights and Forecast, 2019-2031
- 6.1. Market Analysis, Insights and Forecast - by Soft Drink Type
- 6.1.1. Diet Cola
- 6.1.2. Fruit Flavored Carbonates
- 6.1.3. Standard Cola
- 6.1.4. Other Types
- 6.2. Market Analysis, Insights and Forecast - by Packaging Type
- 6.2.1. Disposable Cups
- 6.2.2. Glass Bottles
- 6.2.3. Metal Can
- 6.2.4. PET Bottles
- 6.3. Market Analysis, Insights and Forecast - by Distribution Channel
- 6.3.1. Off-trade
- 6.3.1.1. Convenience Stores
- 6.3.1.2. Online Retail
- 6.3.1.3. Supermarket/Hypermarket
- 6.3.1.4. Others
- 6.3.2. On-trade
- 6.3.1. Off-trade
- 6.1. Market Analysis, Insights and Forecast - by Soft Drink Type
- 7. South America Carbonated Drinks Market Analysis, Insights and Forecast, 2019-2031
- 7.1. Market Analysis, Insights and Forecast - by Soft Drink Type
- 7.1.1. Diet Cola
- 7.1.2. Fruit Flavored Carbonates
- 7.1.3. Standard Cola
- 7.1.4. Other Types
- 7.2. Market Analysis, Insights and Forecast - by Packaging Type
- 7.2.1. Disposable Cups
- 7.2.2. Glass Bottles
- 7.2.3. Metal Can
- 7.2.4. PET Bottles
- 7.3. Market Analysis, Insights and Forecast - by Distribution Channel
- 7.3.1. Off-trade
- 7.3.1.1. Convenience Stores
- 7.3.1.2. Online Retail
- 7.3.1.3. Supermarket/Hypermarket
- 7.3.1.4. Others
- 7.3.2. On-trade
- 7.3.1. Off-trade
- 7.1. Market Analysis, Insights and Forecast - by Soft Drink Type
- 8. Europe Carbonated Drinks Market Analysis, Insights and Forecast, 2019-2031
- 8.1. Market Analysis, Insights and Forecast - by Soft Drink Type
- 8.1.1. Diet Cola
- 8.1.2. Fruit Flavored Carbonates
- 8.1.3. Standard Cola
- 8.1.4. Other Types
- 8.2. Market Analysis, Insights and Forecast - by Packaging Type
- 8.2.1. Disposable Cups
- 8.2.2. Glass Bottles
- 8.2.3. Metal Can
- 8.2.4. PET Bottles
- 8.3. Market Analysis, Insights and Forecast - by Distribution Channel
- 8.3.1. Off-trade
- 8.3.1.1. Convenience Stores
- 8.3.1.2. Online Retail
- 8.3.1.3. Supermarket/Hypermarket
- 8.3.1.4. Others
- 8.3.2. On-trade
- 8.3.1. Off-trade
- 8.1. Market Analysis, Insights and Forecast - by Soft Drink Type
- 9. Middle East & Africa Carbonated Drinks Market Analysis, Insights and Forecast, 2019-2031
- 9.1. Market Analysis, Insights and Forecast - by Soft Drink Type
- 9.1.1. Diet Cola
- 9.1.2. Fruit Flavored Carbonates
- 9.1.3. Standard Cola
- 9.1.4. Other Types
- 9.2. Market Analysis, Insights and Forecast - by Packaging Type
- 9.2.1. Disposable Cups
- 9.2.2. Glass Bottles
- 9.2.3. Metal Can
- 9.2.4. PET Bottles
- 9.3. Market Analysis, Insights and Forecast - by Distribution Channel
- 9.3.1. Off-trade
- 9.3.1.1. Convenience Stores
- 9.3.1.2. Online Retail
- 9.3.1.3. Supermarket/Hypermarket
- 9.3.1.4. Others
- 9.3.2. On-trade
- 9.3.1. Off-trade
- 9.1. Market Analysis, Insights and Forecast - by Soft Drink Type
- 10. Asia Pacific Carbonated Drinks Market Analysis, Insights and Forecast, 2019-2031
- 10.1. Market Analysis, Insights and Forecast - by Soft Drink Type
- 10.1.1. Diet Cola
- 10.1.2. Fruit Flavored Carbonates
- 10.1.3. Standard Cola
- 10.1.4. Other Types
- 10.2. Market Analysis, Insights and Forecast - by Packaging Type
- 10.2.1. Disposable Cups
- 10.2.2. Glass Bottles
- 10.2.3. Metal Can
- 10.2.4. PET Bottles
- 10.3. Market Analysis, Insights and Forecast - by Distribution Channel
- 10.3.1. Off-trade
- 10.3.1.1. Convenience Stores
- 10.3.1.2. Online Retail
- 10.3.1.3. Supermarket/Hypermarket
- 10.3.1.4. Others
- 10.3.2. On-trade
- 10.3.1. Off-trade
- 10.1. Market Analysis, Insights and Forecast - by Soft Drink Type
- 11. North America Carbonated Drinks Market Analysis, Insights and Forecast, 2019-2031
- 11.1. Market Analysis, Insights and Forecast - By Country/Sub-region
- 11.1.1 United States
- 11.1.2 Canada
- 11.1.3 Mexico
- 11.1.4 Rest of North America
- 12. Europe Carbonated Drinks Market Analysis, Insights and Forecast, 2019-2031
- 12.1. Market Analysis, Insights and Forecast - By Country/Sub-region
- 12.1.1. Germany
- 13. Asia Pacific Carbonated Drinks Market Analysis, Insights and Forecast, 2019-2031
- 13.1. Market Analysis, Insights and Forecast - By Country/Sub-region
- 13.1.1 China
- 13.1.2 India
- 13.1.3 Japan
- 13.1.4 South Korea
- 13.1.5 Rest of Asia Pacific
- 14. South America Carbonated Drinks Market Analysis, Insights and Forecast, 2019-2031
- 14.1. Market Analysis, Insights and Forecast - By Country/Sub-region
- 14.1.1 Brazil
- 14.1.2 Argentina
- 14.1.3 Rest of South America
- 15. MEA Carbonated Drinks Market Analysis, Insights and Forecast, 2019-2031
- 15.1. Market Analysis, Insights and Forecast - By Country/Sub-region
- 15.1.1 Middle East
- 15.1.2 Africa
- 16. Competitive Analysis
- 16.1. Global Market Share Analysis 2024
- 16.2. Company Profiles
- 16.2.1 Asahi Group Holdings Ltd
- 16.2.1.1. Overview
- 16.2.1.2. Products
- 16.2.1.3. SWOT Analysis
- 16.2.1.4. Recent Developments
- 16.2.1.5. Financials (Based on Availability)
- 16.2.2 PepsiCo Inc
- 16.2.2.1. Overview
- 16.2.2.2. Products
- 16.2.2.3. SWOT Analysis
- 16.2.2.4. Recent Developments
- 16.2.2.5. Financials (Based on Availability)
- 16.2.3 Nongfu Spring Co Ltd
- 16.2.3.1. Overview
- 16.2.3.2. Products
- 16.2.3.3. SWOT Analysis
- 16.2.3.4. Recent Developments
- 16.2.3.5. Financials (Based on Availability)
- 16.2.4 Rauch Fruchtsäfte GmbH & Co OG
- 16.2.4.1. Overview
- 16.2.4.2. Products
- 16.2.4.3. SWOT Analysis
- 16.2.4.4. Recent Developments
- 16.2.4.5. Financials (Based on Availability)
- 16.2.5 PT Anggada Putra Rekso Mulia
- 16.2.5.1. Overview
- 16.2.5.2. Products
- 16.2.5.3. SWOT Analysis
- 16.2.5.4. Recent Developments
- 16.2.5.5. Financials (Based on Availability)
- 16.2.6 Suntory Holdings Limited
- 16.2.6.1. Overview
- 16.2.6.2. Products
- 16.2.6.3. SWOT Analysis
- 16.2.6.4. Recent Developments
- 16.2.6.5. Financials (Based on Availability)
- 16.2.7 Keurig Dr Pepper Inc
- 16.2.7.1. Overview
- 16.2.7.2. Products
- 16.2.7.3. SWOT Analysis
- 16.2.7.4. Recent Developments
- 16.2.7.5. Financials (Based on Availability)
- 16.2.8 National Beverage Corp
- 16.2.8.1. Overview
- 16.2.8.2. Products
- 16.2.8.3. SWOT Analysis
- 16.2.8.4. Recent Developments
- 16.2.8.5. Financials (Based on Availability)
- 16.2.9 Refresco Group BV
- 16.2.9.1. Overview
- 16.2.9.2. Products
- 16.2.9.3. SWOT Analysis
- 16.2.9.4. Recent Developments
- 16.2.9.5. Financials (Based on Availability)
- 16.2.10 The Coca-Cola Company
- 16.2.10.1. Overview
- 16.2.10.2. Products
- 16.2.10.3. SWOT Analysis
- 16.2.10.4. Recent Developments
- 16.2.10.5. Financials (Based on Availability)
- 16.2.11 Hangzhou Wahaha Group Co Ltd
- 16.2.11.1. Overview
- 16.2.11.2. Products
- 16.2.11.3. SWOT Analysis
- 16.2.11.4. Recent Developments
- 16.2.11.5. Financials (Based on Availability)
- 16.2.12 Kirin Holdings Company Limited
- 16.2.12.1. Overview
- 16.2.12.2. Products
- 16.2.12.3. SWOT Analysis
- 16.2.12.4. Recent Developments
- 16.2.12.5. Financials (Based on Availability)
- 16.2.13 Britvic PLC
- 16.2.13.1. Overview
- 16.2.13.2. Products
- 16.2.13.3. SWOT Analysis
- 16.2.13.4. Recent Developments
- 16.2.13.5. Financials (Based on Availability)
- 16.2.14 Tingyi (Cayman Islands) Holding Corporatio
- 16.2.14.1. Overview
- 16.2.14.2. Products
- 16.2.14.3. SWOT Analysis
- 16.2.14.4. Recent Developments
- 16.2.14.5. Financials (Based on Availability)
- 16.2.15 Thai Beverages PCL
- 16.2.15.1. Overview
- 16.2.15.2. Products
- 16.2.15.3. SWOT Analysis
- 16.2.15.4. Recent Developments
- 16.2.15.5. Financials (Based on Availability)
- 16.2.1 Asahi Group Holdings Ltd
List of Figures
- Figure 1: Global Carbonated Drinks Market Revenue Breakdown (Million, %) by Region 2024 & 2032
- Figure 2: Global Carbonated Drinks Market Volume Breakdown (liter , %) by Region 2024 & 2032
- Figure 3: North America Carbonated Drinks Market Revenue (Million), by Country 2024 & 2032
- Figure 4: North America Carbonated Drinks Market Volume (liter ), by Country 2024 & 2032
- Figure 5: North America Carbonated Drinks Market Revenue Share (%), by Country 2024 & 2032
- Figure 6: North America Carbonated Drinks Market Volume Share (%), by Country 2024 & 2032
- Figure 7: Europe Carbonated Drinks Market Revenue (Million), by Country 2024 & 2032
- Figure 8: Europe Carbonated Drinks Market Volume (liter ), by Country 2024 & 2032
- Figure 9: Europe Carbonated Drinks Market Revenue Share (%), by Country 2024 & 2032
- Figure 10: Europe Carbonated Drinks Market Volume Share (%), by Country 2024 & 2032
- Figure 11: Asia Pacific Carbonated Drinks Market Revenue (Million), by Country 2024 & 2032
- Figure 12: Asia Pacific Carbonated Drinks Market Volume (liter ), by Country 2024 & 2032
- Figure 13: Asia Pacific Carbonated Drinks Market Revenue Share (%), by Country 2024 & 2032
- Figure 14: Asia Pacific Carbonated Drinks Market Volume Share (%), by Country 2024 & 2032
- Figure 15: South America Carbonated Drinks Market Revenue (Million), by Country 2024 & 2032
- Figure 16: South America Carbonated Drinks Market Volume (liter ), by Country 2024 & 2032
- Figure 17: South America Carbonated Drinks Market Revenue Share (%), by Country 2024 & 2032
- Figure 18: South America Carbonated Drinks Market Volume Share (%), by Country 2024 & 2032
- Figure 19: MEA Carbonated Drinks Market Revenue (Million), by Country 2024 & 2032
- Figure 20: MEA Carbonated Drinks Market Volume (liter ), by Country 2024 & 2032
- Figure 21: MEA Carbonated Drinks Market Revenue Share (%), by Country 2024 & 2032
- Figure 22: MEA Carbonated Drinks Market Volume Share (%), by Country 2024 & 2032
- Figure 23: North America Carbonated Drinks Market Revenue (Million), by Soft Drink Type 2024 & 2032
- Figure 24: North America Carbonated Drinks Market Volume (liter ), by Soft Drink Type 2024 & 2032
- Figure 25: North America Carbonated Drinks Market Revenue Share (%), by Soft Drink Type 2024 & 2032
- Figure 26: North America Carbonated Drinks Market Volume Share (%), by Soft Drink Type 2024 & 2032
- Figure 27: North America Carbonated Drinks Market Revenue (Million), by Packaging Type 2024 & 2032
- Figure 28: North America Carbonated Drinks Market Volume (liter ), by Packaging Type 2024 & 2032
- Figure 29: North America Carbonated Drinks Market Revenue Share (%), by Packaging Type 2024 & 2032
- Figure 30: North America Carbonated Drinks Market Volume Share (%), by Packaging Type 2024 & 2032
- Figure 31: North America Carbonated Drinks Market Revenue (Million), by Distribution Channel 2024 & 2032
- Figure 32: North America Carbonated Drinks Market Volume (liter ), by Distribution Channel 2024 & 2032
- Figure 33: North America Carbonated Drinks Market Revenue Share (%), by Distribution Channel 2024 & 2032
- Figure 34: North America Carbonated Drinks Market Volume Share (%), by Distribution Channel 2024 & 2032
- Figure 35: North America Carbonated Drinks Market Revenue (Million), by Country 2024 & 2032
- Figure 36: North America Carbonated Drinks Market Volume (liter ), by Country 2024 & 2032
- Figure 37: North America Carbonated Drinks Market Revenue Share (%), by Country 2024 & 2032
- Figure 38: North America Carbonated Drinks Market Volume Share (%), by Country 2024 & 2032
- Figure 39: South America Carbonated Drinks Market Revenue (Million), by Soft Drink Type 2024 & 2032
- Figure 40: South America Carbonated Drinks Market Volume (liter ), by Soft Drink Type 2024 & 2032
- Figure 41: South America Carbonated Drinks Market Revenue Share (%), by Soft Drink Type 2024 & 2032
- Figure 42: South America Carbonated Drinks Market Volume Share (%), by Soft Drink Type 2024 & 2032
- Figure 43: South America Carbonated Drinks Market Revenue (Million), by Packaging Type 2024 & 2032
- Figure 44: South America Carbonated Drinks Market Volume (liter ), by Packaging Type 2024 & 2032
- Figure 45: South America Carbonated Drinks Market Revenue Share (%), by Packaging Type 2024 & 2032
- Figure 46: South America Carbonated Drinks Market Volume Share (%), by Packaging Type 2024 & 2032
- Figure 47: South America Carbonated Drinks Market Revenue (Million), by Distribution Channel 2024 & 2032
- Figure 48: South America Carbonated Drinks Market Volume (liter ), by Distribution Channel 2024 & 2032
- Figure 49: South America Carbonated Drinks Market Revenue Share (%), by Distribution Channel 2024 & 2032
- Figure 50: South America Carbonated Drinks Market Volume Share (%), by Distribution Channel 2024 & 2032
- Figure 51: South America Carbonated Drinks Market Revenue (Million), by Country 2024 & 2032
- Figure 52: South America Carbonated Drinks Market Volume (liter ), by Country 2024 & 2032
- Figure 53: South America Carbonated Drinks Market Revenue Share (%), by Country 2024 & 2032
- Figure 54: South America Carbonated Drinks Market Volume Share (%), by Country 2024 & 2032
- Figure 55: Europe Carbonated Drinks Market Revenue (Million), by Soft Drink Type 2024 & 2032
- Figure 56: Europe Carbonated Drinks Market Volume (liter ), by Soft Drink Type 2024 & 2032
- Figure 57: Europe Carbonated Drinks Market Revenue Share (%), by Soft Drink Type 2024 & 2032
- Figure 58: Europe Carbonated Drinks Market Volume Share (%), by Soft Drink Type 2024 & 2032
- Figure 59: Europe Carbonated Drinks Market Revenue (Million), by Packaging Type 2024 & 2032
- Figure 60: Europe Carbonated Drinks Market Volume (liter ), by Packaging Type 2024 & 2032
- Figure 61: Europe Carbonated Drinks Market Revenue Share (%), by Packaging Type 2024 & 2032
- Figure 62: Europe Carbonated Drinks Market Volume Share (%), by Packaging Type 2024 & 2032
- Figure 63: Europe Carbonated Drinks Market Revenue (Million), by Distribution Channel 2024 & 2032
- Figure 64: Europe Carbonated Drinks Market Volume (liter ), by Distribution Channel 2024 & 2032
- Figure 65: Europe Carbonated Drinks Market Revenue Share (%), by Distribution Channel 2024 & 2032
- Figure 66: Europe Carbonated Drinks Market Volume Share (%), by Distribution Channel 2024 & 2032
- Figure 67: Europe Carbonated Drinks Market Revenue (Million), by Country 2024 & 2032
- Figure 68: Europe Carbonated Drinks Market Volume (liter ), by Country 2024 & 2032
- Figure 69: Europe Carbonated Drinks Market Revenue Share (%), by Country 2024 & 2032
- Figure 70: Europe Carbonated Drinks Market Volume Share (%), by Country 2024 & 2032
- Figure 71: Middle East & Africa Carbonated Drinks Market Revenue (Million), by Soft Drink Type 2024 & 2032
- Figure 72: Middle East & Africa Carbonated Drinks Market Volume (liter ), by Soft Drink Type 2024 & 2032
- Figure 73: Middle East & Africa Carbonated Drinks Market Revenue Share (%), by Soft Drink Type 2024 & 2032
- Figure 74: Middle East & Africa Carbonated Drinks Market Volume Share (%), by Soft Drink Type 2024 & 2032
- Figure 75: Middle East & Africa Carbonated Drinks Market Revenue (Million), by Packaging Type 2024 & 2032
- Figure 76: Middle East & Africa Carbonated Drinks Market Volume (liter ), by Packaging Type 2024 & 2032
- Figure 77: Middle East & Africa Carbonated Drinks Market Revenue Share (%), by Packaging Type 2024 & 2032
- Figure 78: Middle East & Africa Carbonated Drinks Market Volume Share (%), by Packaging Type 2024 & 2032
- Figure 79: Middle East & Africa Carbonated Drinks Market Revenue (Million), by Distribution Channel 2024 & 2032
- Figure 80: Middle East & Africa Carbonated Drinks Market Volume (liter ), by Distribution Channel 2024 & 2032
- Figure 81: Middle East & Africa Carbonated Drinks Market Revenue Share (%), by Distribution Channel 2024 & 2032
- Figure 82: Middle East & Africa Carbonated Drinks Market Volume Share (%), by Distribution Channel 2024 & 2032
- Figure 83: Middle East & Africa Carbonated Drinks Market Revenue (Million), by Country 2024 & 2032
- Figure 84: Middle East & Africa Carbonated Drinks Market Volume (liter ), by Country 2024 & 2032
- Figure 85: Middle East & Africa Carbonated Drinks Market Revenue Share (%), by Country 2024 & 2032
- Figure 86: Middle East & Africa Carbonated Drinks Market Volume Share (%), by Country 2024 & 2032
- Figure 87: Asia Pacific Carbonated Drinks Market Revenue (Million), by Soft Drink Type 2024 & 2032
- Figure 88: Asia Pacific Carbonated Drinks Market Volume (liter ), by Soft Drink Type 2024 & 2032
- Figure 89: Asia Pacific Carbonated Drinks Market Revenue Share (%), by Soft Drink Type 2024 & 2032
- Figure 90: Asia Pacific Carbonated Drinks Market Volume Share (%), by Soft Drink Type 2024 & 2032
- Figure 91: Asia Pacific Carbonated Drinks Market Revenue (Million), by Packaging Type 2024 & 2032
- Figure 92: Asia Pacific Carbonated Drinks Market Volume (liter ), by Packaging Type 2024 & 2032
- Figure 93: Asia Pacific Carbonated Drinks Market Revenue Share (%), by Packaging Type 2024 & 2032
- Figure 94: Asia Pacific Carbonated Drinks Market Volume Share (%), by Packaging Type 2024 & 2032
- Figure 95: Asia Pacific Carbonated Drinks Market Revenue (Million), by Distribution Channel 2024 & 2032
- Figure 96: Asia Pacific Carbonated Drinks Market Volume (liter ), by Distribution Channel 2024 & 2032
- Figure 97: Asia Pacific Carbonated Drinks Market Revenue Share (%), by Distribution Channel 2024 & 2032
- Figure 98: Asia Pacific Carbonated Drinks Market Volume Share (%), by Distribution Channel 2024 & 2032
- Figure 99: Asia Pacific Carbonated Drinks Market Revenue (Million), by Country 2024 & 2032
- Figure 100: Asia Pacific Carbonated Drinks Market Volume (liter ), by Country 2024 & 2032
- Figure 101: Asia Pacific Carbonated Drinks Market Revenue Share (%), by Country 2024 & 2032
- Figure 102: Asia Pacific Carbonated Drinks Market Volume Share (%), by Country 2024 & 2032
List of Tables
- Table 1: Global Carbonated Drinks Market Revenue Million Forecast, by Region 2019 & 2032
- Table 2: Global Carbonated Drinks Market Volume liter Forecast, by Region 2019 & 2032
- Table 3: Global Carbonated Drinks Market Revenue Million Forecast, by Soft Drink Type 2019 & 2032
- Table 4: Global Carbonated Drinks Market Volume liter Forecast, by Soft Drink Type 2019 & 2032
- Table 5: Global Carbonated Drinks Market Revenue Million Forecast, by Packaging Type 2019 & 2032
- Table 6: Global Carbonated Drinks Market Volume liter Forecast, by Packaging Type 2019 & 2032
- Table 7: Global Carbonated Drinks Market Revenue Million Forecast, by Distribution Channel 2019 & 2032
- Table 8: Global Carbonated Drinks Market Volume liter Forecast, by Distribution Channel 2019 & 2032
- Table 9: Global Carbonated Drinks Market Revenue Million Forecast, by Region 2019 & 2032
- Table 10: Global Carbonated Drinks Market Volume liter Forecast, by Region 2019 & 2032
- Table 11: Global Carbonated Drinks Market Revenue Million Forecast, by Country 2019 & 2032
- Table 12: Global Carbonated Drinks Market Volume liter Forecast, by Country 2019 & 2032
- Table 13: United States Carbonated Drinks Market Revenue (Million) Forecast, by Application 2019 & 2032
- Table 14: United States Carbonated Drinks Market Volume (liter ) Forecast, by Application 2019 & 2032
- Table 15: Canada Carbonated Drinks Market Revenue (Million) Forecast, by Application 2019 & 2032
- Table 16: Canada Carbonated Drinks Market Volume (liter ) Forecast, by Application 2019 & 2032
- Table 17: Mexico Carbonated Drinks Market Revenue (Million) Forecast, by Application 2019 & 2032
- Table 18: Mexico Carbonated Drinks Market Volume (liter ) Forecast, by Application 2019 & 2032
- Table 19: Rest of North America Carbonated Drinks Market Revenue (Million) Forecast, by Application 2019 & 2032
- Table 20: Rest of North America Carbonated Drinks Market Volume (liter ) Forecast, by Application 2019 & 2032
- Table 21: Global Carbonated Drinks Market Revenue Million Forecast, by Country 2019 & 2032
- Table 22: Global Carbonated Drinks Market Volume liter Forecast, by Country 2019 & 2032
- Table 23: Germany Carbonated Drinks Market Revenue (Million) Forecast, by Application 2019 & 2032
- Table 24: Germany Carbonated Drinks Market Volume (liter ) Forecast, by Application 2019 & 2032
- Table 25: Global Carbonated Drinks Market Revenue Million Forecast, by Country 2019 & 2032
- Table 26: Global Carbonated Drinks Market Volume liter Forecast, by Country 2019 & 2032
- Table 27: China Carbonated Drinks Market Revenue (Million) Forecast, by Application 2019 & 2032
- Table 28: China Carbonated Drinks Market Volume (liter ) Forecast, by Application 2019 & 2032
- Table 29: India Carbonated Drinks Market Revenue (Million) Forecast, by Application 2019 & 2032
- Table 30: India Carbonated Drinks Market Volume (liter ) Forecast, by Application 2019 & 2032
- Table 31: Japan Carbonated Drinks Market Revenue (Million) Forecast, by Application 2019 & 2032
- Table 32: Japan Carbonated Drinks Market Volume (liter ) Forecast, by Application 2019 & 2032
- Table 33: South Korea Carbonated Drinks Market Revenue (Million) Forecast, by Application 2019 & 2032
- Table 34: South Korea Carbonated Drinks Market Volume (liter ) Forecast, by Application 2019 & 2032
- Table 35: Rest of Asia Pacific Carbonated Drinks Market Revenue (Million) Forecast, by Application 2019 & 2032
- Table 36: Rest of Asia Pacific Carbonated Drinks Market Volume (liter ) Forecast, by Application 2019 & 2032
- Table 37: Global Carbonated Drinks Market Revenue Million Forecast, by Country 2019 & 2032
- Table 38: Global Carbonated Drinks Market Volume liter Forecast, by Country 2019 & 2032
- Table 39: Brazil Carbonated Drinks Market Revenue (Million) Forecast, by Application 2019 & 2032
- Table 40: Brazil Carbonated Drinks Market Volume (liter ) Forecast, by Application 2019 & 2032
- Table 41: Argentina Carbonated Drinks Market Revenue (Million) Forecast, by Application 2019 & 2032
- Table 42: Argentina Carbonated Drinks Market Volume (liter ) Forecast, by Application 2019 & 2032
- Table 43: Rest of South America Carbonated Drinks Market Revenue (Million) Forecast, by Application 2019 & 2032
- Table 44: Rest of South America Carbonated Drinks Market Volume (liter ) Forecast, by Application 2019 & 2032
- Table 45: Global Carbonated Drinks Market Revenue Million Forecast, by Country 2019 & 2032
- Table 46: Global Carbonated Drinks Market Volume liter Forecast, by Country 2019 & 2032
- Table 47: Middle East Carbonated Drinks Market Revenue (Million) Forecast, by Application 2019 & 2032
- Table 48: Middle East Carbonated Drinks Market Volume (liter ) Forecast, by Application 2019 & 2032
- Table 49: Africa Carbonated Drinks Market Revenue (Million) Forecast, by Application 2019 & 2032
- Table 50: Africa Carbonated Drinks Market Volume (liter ) Forecast, by Application 2019 & 2032
- Table 51: Global Carbonated Drinks Market Revenue Million Forecast, by Soft Drink Type 2019 & 2032
- Table 52: Global Carbonated Drinks Market Volume liter Forecast, by Soft Drink Type 2019 & 2032
- Table 53: Global Carbonated Drinks Market Revenue Million Forecast, by Packaging Type 2019 & 2032
- Table 54: Global Carbonated Drinks Market Volume liter Forecast, by Packaging Type 2019 & 2032
- Table 55: Global Carbonated Drinks Market Revenue Million Forecast, by Distribution Channel 2019 & 2032
- Table 56: Global Carbonated Drinks Market Volume liter Forecast, by Distribution Channel 2019 & 2032
- Table 57: Global Carbonated Drinks Market Revenue Million Forecast, by Country 2019 & 2032
- Table 58: Global Carbonated Drinks Market Volume liter Forecast, by Country 2019 & 2032
- Table 59: United States Carbonated Drinks Market Revenue (Million) Forecast, by Application 2019 & 2032
- Table 60: United States Carbonated Drinks Market Volume (liter ) Forecast, by Application 2019 & 2032
- Table 61: Canada Carbonated Drinks Market Revenue (Million) Forecast, by Application 2019 & 2032
- Table 62: Canada Carbonated Drinks Market Volume (liter ) Forecast, by Application 2019 & 2032
- Table 63: Mexico Carbonated Drinks Market Revenue (Million) Forecast, by Application 2019 & 2032
- Table 64: Mexico Carbonated Drinks Market Volume (liter ) Forecast, by Application 2019 & 2032
- Table 65: Global Carbonated Drinks Market Revenue Million Forecast, by Soft Drink Type 2019 & 2032
- Table 66: Global Carbonated Drinks Market Volume liter Forecast, by Soft Drink Type 2019 & 2032
- Table 67: Global Carbonated Drinks Market Revenue Million Forecast, by Packaging Type 2019 & 2032
- Table 68: Global Carbonated Drinks Market Volume liter Forecast, by Packaging Type 2019 & 2032
- Table 69: Global Carbonated Drinks Market Revenue Million Forecast, by Distribution Channel 2019 & 2032
- Table 70: Global Carbonated Drinks Market Volume liter Forecast, by Distribution Channel 2019 & 2032
- Table 71: Global Carbonated Drinks Market Revenue Million Forecast, by Country 2019 & 2032
- Table 72: Global Carbonated Drinks Market Volume liter Forecast, by Country 2019 & 2032
- Table 73: Brazil Carbonated Drinks Market Revenue (Million) Forecast, by Application 2019 & 2032
- Table 74: Brazil Carbonated Drinks Market Volume (liter ) Forecast, by Application 2019 & 2032
- Table 75: Argentina Carbonated Drinks Market Revenue (Million) Forecast, by Application 2019 & 2032
- Table 76: Argentina Carbonated Drinks Market Volume (liter ) Forecast, by Application 2019 & 2032
- Table 77: Rest of South America Carbonated Drinks Market Revenue (Million) Forecast, by Application 2019 & 2032
- Table 78: Rest of South America Carbonated Drinks Market Volume (liter ) Forecast, by Application 2019 & 2032
- Table 79: Global Carbonated Drinks Market Revenue Million Forecast, by Soft Drink Type 2019 & 2032
- Table 80: Global Carbonated Drinks Market Volume liter Forecast, by Soft Drink Type 2019 & 2032
- Table 81: Global Carbonated Drinks Market Revenue Million Forecast, by Packaging Type 2019 & 2032
- Table 82: Global Carbonated Drinks Market Volume liter Forecast, by Packaging Type 2019 & 2032
- Table 83: Global Carbonated Drinks Market Revenue Million Forecast, by Distribution Channel 2019 & 2032
- Table 84: Global Carbonated Drinks Market Volume liter Forecast, by Distribution Channel 2019 & 2032
- Table 85: Global Carbonated Drinks Market Revenue Million Forecast, by Country 2019 & 2032
- Table 86: Global Carbonated Drinks Market Volume liter Forecast, by Country 2019 & 2032
- Table 87: United Kingdom Carbonated Drinks Market Revenue (Million) Forecast, by Application 2019 & 2032
- Table 88: United Kingdom Carbonated Drinks Market Volume (liter ) Forecast, by Application 2019 & 2032
- Table 89: Germany Carbonated Drinks Market Revenue (Million) Forecast, by Application 2019 & 2032
- Table 90: Germany Carbonated Drinks Market Volume (liter ) Forecast, by Application 2019 & 2032
- Table 91: France Carbonated Drinks Market Revenue (Million) Forecast, by Application 2019 & 2032
- Table 92: France Carbonated Drinks Market Volume (liter ) Forecast, by Application 2019 & 2032
- Table 93: Italy Carbonated Drinks Market Revenue (Million) Forecast, by Application 2019 & 2032
- Table 94: Italy Carbonated Drinks Market Volume (liter ) Forecast, by Application 2019 & 2032
- Table 95: Spain Carbonated Drinks Market Revenue (Million) Forecast, by Application 2019 & 2032
- Table 96: Spain Carbonated Drinks Market Volume (liter ) Forecast, by Application 2019 & 2032
- Table 97: Russia Carbonated Drinks Market Revenue (Million) Forecast, by Application 2019 & 2032
- Table 98: Russia Carbonated Drinks Market Volume (liter ) Forecast, by Application 2019 & 2032
- Table 99: Benelux Carbonated Drinks Market Revenue (Million) Forecast, by Application 2019 & 2032
- Table 100: Benelux Carbonated Drinks Market Volume (liter ) Forecast, by Application 2019 & 2032
- Table 101: Nordics Carbonated Drinks Market Revenue (Million) Forecast, by Application 2019 & 2032
- Table 102: Nordics Carbonated Drinks Market Volume (liter ) Forecast, by Application 2019 & 2032
- Table 103: Rest of Europe Carbonated Drinks Market Revenue (Million) Forecast, by Application 2019 & 2032
- Table 104: Rest of Europe Carbonated Drinks Market Volume (liter ) Forecast, by Application 2019 & 2032
- Table 105: Global Carbonated Drinks Market Revenue Million Forecast, by Soft Drink Type 2019 & 2032
- Table 106: Global Carbonated Drinks Market Volume liter Forecast, by Soft Drink Type 2019 & 2032
- Table 107: Global Carbonated Drinks Market Revenue Million Forecast, by Packaging Type 2019 & 2032
- Table 108: Global Carbonated Drinks Market Volume liter Forecast, by Packaging Type 2019 & 2032
- Table 109: Global Carbonated Drinks Market Revenue Million Forecast, by Distribution Channel 2019 & 2032
- Table 110: Global Carbonated Drinks Market Volume liter Forecast, by Distribution Channel 2019 & 2032
- Table 111: Global Carbonated Drinks Market Revenue Million Forecast, by Country 2019 & 2032
- Table 112: Global Carbonated Drinks Market Volume liter Forecast, by Country 2019 & 2032
- Table 113: Turkey Carbonated Drinks Market Revenue (Million) Forecast, by Application 2019 & 2032
- Table 114: Turkey Carbonated Drinks Market Volume (liter ) Forecast, by Application 2019 & 2032
- Table 115: Israel Carbonated Drinks Market Revenue (Million) Forecast, by Application 2019 & 2032
- Table 116: Israel Carbonated Drinks Market Volume (liter ) Forecast, by Application 2019 & 2032
- Table 117: GCC Carbonated Drinks Market Revenue (Million) Forecast, by Application 2019 & 2032
- Table 118: GCC Carbonated Drinks Market Volume (liter ) Forecast, by Application 2019 & 2032
- Table 119: North Africa Carbonated Drinks Market Revenue (Million) Forecast, by Application 2019 & 2032
- Table 120: North Africa Carbonated Drinks Market Volume (liter ) Forecast, by Application 2019 & 2032
- Table 121: South Africa Carbonated Drinks Market Revenue (Million) Forecast, by Application 2019 & 2032
- Table 122: South Africa Carbonated Drinks Market Volume (liter ) Forecast, by Application 2019 & 2032
- Table 123: Rest of Middle East & Africa Carbonated Drinks Market Revenue (Million) Forecast, by Application 2019 & 2032
- Table 124: Rest of Middle East & Africa Carbonated Drinks Market Volume (liter ) Forecast, by Application 2019 & 2032
- Table 125: Global Carbonated Drinks Market Revenue Million Forecast, by Soft Drink Type 2019 & 2032
- Table 126: Global Carbonated Drinks Market Volume liter Forecast, by Soft Drink Type 2019 & 2032
- Table 127: Global Carbonated Drinks Market Revenue Million Forecast, by Packaging Type 2019 & 2032
- Table 128: Global Carbonated Drinks Market Volume liter Forecast, by Packaging Type 2019 & 2032
- Table 129: Global Carbonated Drinks Market Revenue Million Forecast, by Distribution Channel 2019 & 2032
- Table 130: Global Carbonated Drinks Market Volume liter Forecast, by Distribution Channel 2019 & 2032
- Table 131: Global Carbonated Drinks Market Revenue Million Forecast, by Country 2019 & 2032
- Table 132: Global Carbonated Drinks Market Volume liter Forecast, by Country 2019 & 2032
- Table 133: China Carbonated Drinks Market Revenue (Million) Forecast, by Application 2019 & 2032
- Table 134: China Carbonated Drinks Market Volume (liter ) Forecast, by Application 2019 & 2032
- Table 135: India Carbonated Drinks Market Revenue (Million) Forecast, by Application 2019 & 2032
- Table 136: India Carbonated Drinks Market Volume (liter ) Forecast, by Application 2019 & 2032
- Table 137: Japan Carbonated Drinks Market Revenue (Million) Forecast, by Application 2019 & 2032
- Table 138: Japan Carbonated Drinks Market Volume (liter ) Forecast, by Application 2019 & 2032
- Table 139: South Korea Carbonated Drinks Market Revenue (Million) Forecast, by Application 2019 & 2032
- Table 140: South Korea Carbonated Drinks Market Volume (liter ) Forecast, by Application 2019 & 2032
- Table 141: ASEAN Carbonated Drinks Market Revenue (Million) Forecast, by Application 2019 & 2032
- Table 142: ASEAN Carbonated Drinks Market Volume (liter ) Forecast, by Application 2019 & 2032
- Table 143: Oceania Carbonated Drinks Market Revenue (Million) Forecast, by Application 2019 & 2032
- Table 144: Oceania Carbonated Drinks Market Volume (liter ) Forecast, by Application 2019 & 2032
- Table 145: Rest of Asia Pacific Carbonated Drinks Market Revenue (Million) Forecast, by Application 2019 & 2032
- Table 146: Rest of Asia Pacific Carbonated Drinks Market Volume (liter ) Forecast, by Application 2019 & 2032
Frequently Asked Questions
1. What is the projected Compound Annual Growth Rate (CAGR) of the Carbonated Drinks Market?
The projected CAGR is approximately 4.76%.
2. Which companies are prominent players in the Carbonated Drinks Market?
Key companies in the market include Asahi Group Holdings Ltd, PepsiCo Inc, Nongfu Spring Co Ltd, Rauch Fruchtsäfte GmbH & Co OG, PT Anggada Putra Rekso Mulia, Suntory Holdings Limited, Keurig Dr Pepper Inc, National Beverage Corp, Refresco Group BV, The Coca-Cola Company, Hangzhou Wahaha Group Co Ltd, Kirin Holdings Company Limited, Britvic PLC, Tingyi (Cayman Islands) Holding Corporatio, Thai Beverages PCL.
3. What are the main segments of the Carbonated Drinks Market?
The market segments include Soft Drink Type, Packaging Type, Distribution Channel.
4. Can you provide details about the market size?
The market size is estimated to be USD 500260 Million as of 2022.
5. What are some drivers contributing to market growth?
Growing preference for low alcoholic beer by volume (abv) or non-alcoholic beers; Rising number of breweries leading to high prominence of craft beer.
6. What are the notable trends driving market growth?
OTHER KEY INDUSTRY TRENDS COVERED IN THE REPORT.
7. Are there any restraints impacting market growth?
Demand for other alcoholic beverages.
8. Can you provide examples of recent developments in the market?
December 2023: Kirin launched its Tokusei Ginger Ale Sour and sugar-free tea products, including black tea and Hojicha, in response to the growing demand for sugar-free beverages due to heightened health awareness in Japan. Kirin limited the availability of the Kirin Tokusei Ginger Ale Sour and sugar-free tea products to the local Japanese market as of 2023.October 2023: Coca-Cola launched Coca-Cola Y3000, the beverage is created with the help of artificial intelligence. Coca-Cola Y3000 is the latest limited-edition flavor to launch under its Coca-Cola Creations platform.January 2023: PepsiCo Inc. launched Starry, a tasting soda with a Lemon-Lime flavor. This drink is available in regular and zero-sugar versions.
9. What pricing options are available for accessing the report?
Pricing options include single-user, multi-user, and enterprise licenses priced at USD 3800, USD 4500, and USD 5800 respectively.
10. Is the market size provided in terms of value or volume?
The market size is provided in terms of value, measured in Million and volume, measured in liter .
11. Are there any specific market keywords associated with the report?
Yes, the market keyword associated with the report is "Carbonated Drinks Market," which aids in identifying and referencing the specific market segment covered.
12. How do I determine which pricing option suits my needs best?
The pricing options vary based on user requirements and access needs. Individual users may opt for single-user licenses, while businesses requiring broader access may choose multi-user or enterprise licenses for cost-effective access to the report.
13. Are there any additional resources or data provided in the Carbonated Drinks Market report?
While the report offers comprehensive insights, it's advisable to review the specific contents or supplementary materials provided to ascertain if additional resources or data are available.
14. How can I stay updated on further developments or reports in the Carbonated Drinks Market?
To stay informed about further developments, trends, and reports in the Carbonated Drinks Market, consider subscribing to industry newsletters, following relevant companies and organizations, or regularly checking reputable industry news sources and publications.
Methodology
Step 1 - Identification of Relevant Samples Size from Population Database


Step 2 - Approaches for Defining Global Market Size (Value, Volume* & Price*)

Note*: In applicable scenarios
Step 3 - Data Sources
Primary Research
- Web Analytics
- Survey Reports
- Research Institute
- Latest Research Reports
- Opinion Leaders
Secondary Research
- Annual Reports
- White Paper
- Latest Press Release
- Industry Association
- Paid Database
- Investor Presentations

Step 4 - Data Triangulation
Involves using different sources of information in order to increase the validity of a study
These sources are likely to be stakeholders in a program - participants, other researchers, program staff, other community members, and so on.
Then we put all data in single framework & apply various statistical tools to find out the dynamic on the market.
During the analysis stage, feedback from the stakeholder groups would be compared to determine areas of agreement as well as areas of divergence


