
Key Insights
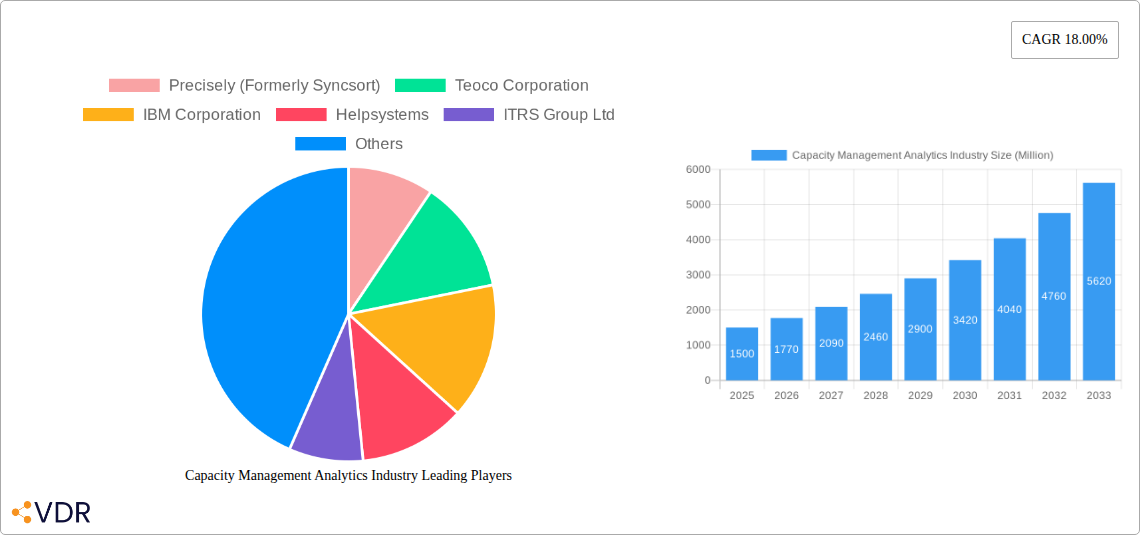
The Capacity Management Analytics market is experiencing robust growth, projected to reach a substantial size within the next decade. The 18% Compound Annual Growth Rate (CAGR) from 2019 to 2024 indicates a significant upward trajectory, driven by several key factors. The increasing complexity of IT infrastructures, the proliferation of cloud computing, and the growing need for optimized resource utilization are major catalysts. Businesses across diverse sectors, including IT & Telecom, Healthcare, Manufacturing, BFSI, and Government, are increasingly adopting capacity management analytics to enhance operational efficiency, reduce costs, and improve service delivery. The shift towards cloud-based deployment models further fuels market expansion, offering scalability and flexibility. While challenges exist, such as the need for skilled professionals to implement and manage these solutions and potential integration complexities, the overall market outlook remains overwhelmingly positive.
The market segmentation reveals significant opportunities across various end-user industries. The IT & Telecom sector is expected to maintain a leading position, driven by the need for robust infrastructure management and performance optimization. Healthcare, with its increasing reliance on data-driven insights and the need for efficient resource allocation, is also a key growth segment. The geographic distribution shows strong growth across North America and Europe, reflecting early adoption and technological advancement. However, Asia-Pacific presents a significant growth opportunity due to expanding digitalization and increasing IT spending in developing economies. The competitive landscape is characterized by a mix of established players like IBM, Hewlett Packard Enterprise, and Broadcom, and innovative startups offering specialized solutions. This competitive intensity is likely to further drive innovation and adoption of advanced analytics capabilities within capacity management.
Capacity Management Analytics Market Report: 2019-2033
This comprehensive report provides a detailed analysis of the Capacity Management Analytics market, encompassing market dynamics, growth trends, regional dominance, product landscape, key players, and future outlook. The study period covers 2019-2033, with a base year of 2025 and a forecast period of 2025-2033. The report segments the market by end-user industry (IT & Telecom, Healthcare, Manufacturing, BFSI, Government, Other) and deployment (On-premise, Cloud). The market size is valued in Million units.
Capacity Management Analytics Industry Market Dynamics & Structure
The Capacity Management Analytics market exhibits a moderately concentrated structure, with key players like Precisely (Formerly Syncsort), Teoco Corporation, IBM Corporation, and VMware Inc. holding significant market share. The market is driven by technological innovations such as AI-powered predictive analytics and automation, improving operational efficiency and reducing costs. Regulatory frameworks, particularly those related to data privacy and security, significantly impact market dynamics. Competitive pressures stem from the emergence of cloud-based solutions and open-source alternatives. M&A activity has been moderate, with xx deals recorded in the historical period (2019-2024).
- Market Concentration: Moderately concentrated, with top 5 players holding xx% market share in 2025.
- Technological Innovation: AI-powered predictive analytics, automation, cloud-based solutions are key drivers.
- Regulatory Frameworks: GDPR, CCPA, and other data privacy regulations influence market adoption.
- Competitive Landscape: Intense competition from established players and emerging cloud providers.
- M&A Activity: xx deals recorded between 2019 and 2024, indicating moderate consolidation.
- End-User Demographics: Growing adoption across IT & Telecom, BFSI, and Healthcare sectors.
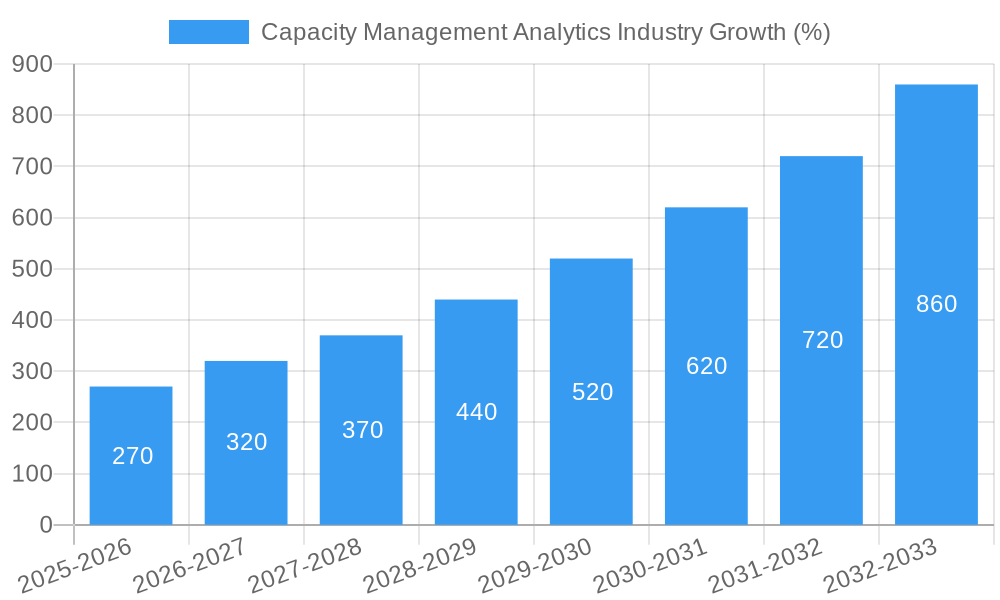
Capacity Management Analytics Industry Growth Trends & Insights
The Capacity Management Analytics market experienced significant growth during the historical period (2019-2024), driven by increasing data volumes, the adoption of cloud computing, and the need for optimized IT infrastructure. The market size reached xx Million units in 2024, growing at a CAGR of xx% during this period. Technological disruptions, such as the rise of serverless computing and edge computing, are reshaping the market landscape. Consumer behavior shifts towards digital transformation and the adoption of agile methodologies further fuel market expansion. The forecast period (2025-2033) anticipates continued growth, driven by factors such as increasing digitalization across various industries and the growing need for efficient resource management. Market penetration is expected to reach xx% by 2033.
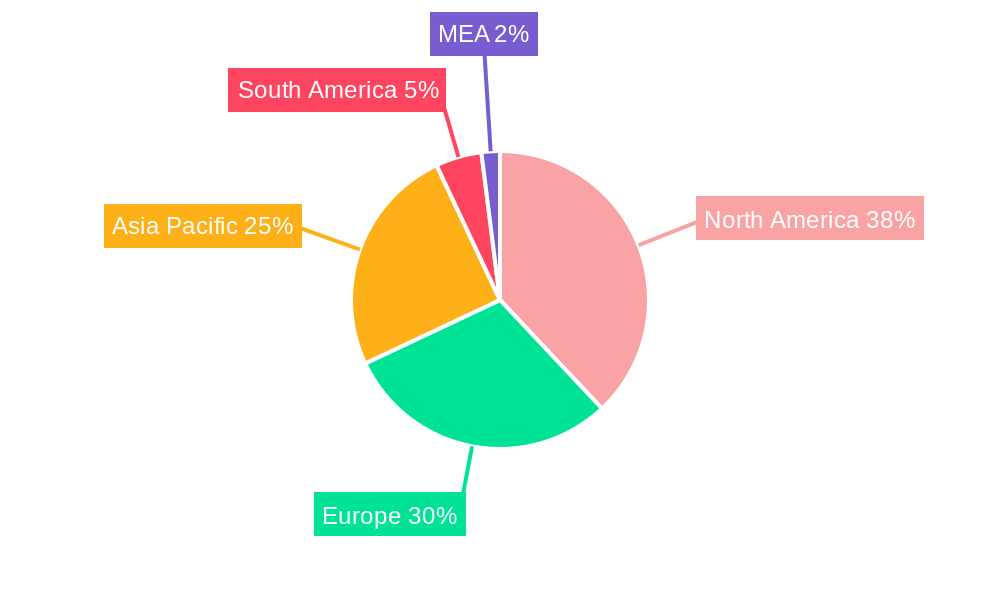
Dominant Regions, Countries, or Segments in Capacity Management Analytics Industry
North America currently holds the largest market share in the Capacity Management Analytics industry, driven by early adoption of advanced technologies and a well-established IT infrastructure. The IT & Telecom and BFSI sectors are significant contributors to this regional dominance. Europe follows closely, showing strong growth potential, while Asia-Pacific is expected to exhibit the fastest CAGR due to increasing investments in digital infrastructure and rapid technological advancements. The Cloud deployment model is gaining significant traction globally, surpassing on-premise deployments.
- North America: Largest market share driven by early adoption and advanced IT infrastructure.
- Europe: Strong growth potential driven by increasing digitalization and regulatory compliance needs.
- Asia-Pacific: Fastest-growing region due to investments in digital infrastructure and rapid technological advancements.
- By End-user Industry: IT & Telecom, BFSI, and Healthcare are the leading segments.
- By Deployment: Cloud deployment is rapidly gaining market share.
Capacity Management Analytics Industry Product Landscape
The Capacity Management Analytics product landscape is characterized by a diverse range of solutions, including on-premise and cloud-based platforms, offering features like predictive analytics, automated capacity planning, and performance monitoring. Key innovations include AI-driven optimization algorithms and integration with other IT management tools. These solutions offer unique selling propositions, focusing on improved efficiency, reduced costs, and enhanced operational visibility. Technological advancements are consistently improving accuracy, scalability, and ease of use.
Key Drivers, Barriers & Challenges in Capacity Management Analytics Industry
Key Drivers: The increasing volume and complexity of data, coupled with the need for optimized IT infrastructure and reduced operational costs, significantly drives the market. Technological advancements, such as AI and machine learning, further propel growth. Government initiatives promoting digital transformation also contribute.
Key Challenges: High initial investment costs, integration complexities, and the need for skilled professionals can hinder market adoption. Data security and privacy concerns represent another significant challenge. Competitive pressures from open-source solutions and cloud-based alternatives also restrict market growth.
Emerging Opportunities in Capacity Management Analytics Industry
The integration of Capacity Management Analytics with emerging technologies like IoT and blockchain presents significant opportunities. Untapped markets in developing economies offer substantial growth potential. The increasing focus on sustainability and energy efficiency creates opportunities for specialized solutions. New applications in areas such as hybrid cloud management and edge computing are emerging.
Growth Accelerators in the Capacity Management Analytics Industry
Strategic partnerships between Capacity Management Analytics vendors and cloud providers accelerate market growth. Technological breakthroughs, particularly in AI and machine learning, continuously improve the capabilities of these solutions. Expanding into new markets and developing specialized solutions for specific industries further drives market expansion.
Key Players Shaping the Capacity Management Analytics Industry Market
- Precisely (Formerly Syncsort)
- Teoco Corporation
- IBM Corporation
- Helpsystems
- ITRS Group Ltd
- Hewlett Packard Enterprise Company
- Broadcom Inc
- BMC Software Inc
- Riverbed Technology Inc
- NetApp Inc
- CPT Global Limited
- VMware Inc
Notable Milestones in Capacity Management Analytics Industry Sector
- 2020: IBM launched its enhanced capacity management solution with AI capabilities.
- 2021: VMware integrated its capacity management tools with its cloud platform.
- 2022: Several mergers and acquisitions occurred, consolidating the market.
- 2023: Significant advancements in AI-driven predictive analytics were introduced.
- 2024: Increased focus on sustainability and energy efficiency in capacity management solutions.
In-Depth Capacity Management Analytics Industry Market Outlook
The Capacity Management Analytics market is poised for continued growth, driven by the increasing adoption of cloud computing, the growing demand for optimized IT infrastructure, and technological advancements in AI and machine learning. Strategic partnerships and investments in research and development will further shape market dynamics. The market presents significant opportunities for vendors offering innovative solutions, specializing in specific industries, and focusing on improved scalability and ease of use. The long-term outlook is positive, with significant growth potential across various regions and segments.
Capacity Management Analytics Industry Segmentation
-
1. Deployment
- 1.1. On-premise
- 1.2. Cloud
-
2. End-user Industry
- 2.1. IT & Telecom
- 2.2. Healthcare
- 2.3. Manufacturing
- 2.4. BFSI
- 2.5. Government
- 2.6. Other End-user Industries
Capacity Management Analytics Industry Segmentation By Geography
- 1. North America
- 2. Europe
- 3. Asia Pacific
- 4. Latin America
- 5. Middle East and Africa
Capacity Management Analytics Industry REPORT HIGHLIGHTS
| Aspects | Details |
|---|---|
| Study Period | 2019-2033 |
| Base Year | 2024 |
| Estimated Year | 2025 |
| Forecast Period | 2025-2033 |
| Historical Period | 2019-2024 |
| Growth Rate | CAGR of 18.00% from 2019-2033 |
| Segmentation |
|
Table of Contents
- 1. Introduction
- 1.1. Research Scope
- 1.2. Market Segmentation
- 1.3. Research Methodology
- 1.4. Definitions and Assumptions
- 2. Executive Summary
- 2.1. Introduction
- 3. Market Dynamics
- 3.1. Introduction
- 3.2. Market Drivers
- 3.2.1. ; Increasing Need for Optimization and Effective Utilization of IT Infrastructures; Increasing Complexities in IT Infrastructures
- 3.3. Market Restrains
- 3.3.1. ; Lower Adoption Among the SMEs
- 3.4. Market Trends
- 3.4.1. Manufacturing Segment is Expected to Witness Significant Growth
- 4. Market Factor Analysis
- 4.1. Porters Five Forces
- 4.2. Supply/Value Chain
- 4.3. PESTEL analysis
- 4.4. Market Entropy
- 4.5. Patent/Trademark Analysis
- 5. Global Capacity Management Analytics Industry Analysis, Insights and Forecast, 2019-2031
- 5.1. Market Analysis, Insights and Forecast - by Deployment
- 5.1.1. On-premise
- 5.1.2. Cloud
- 5.2. Market Analysis, Insights and Forecast - by End-user Industry
- 5.2.1. IT & Telecom
- 5.2.2. Healthcare
- 5.2.3. Manufacturing
- 5.2.4. BFSI
- 5.2.5. Government
- 5.2.6. Other End-user Industries
- 5.3. Market Analysis, Insights and Forecast - by Region
- 5.3.1. North America
- 5.3.2. Europe
- 5.3.3. Asia Pacific
- 5.3.4. Latin America
- 5.3.5. Middle East and Africa
- 5.1. Market Analysis, Insights and Forecast - by Deployment
- 6. North America Capacity Management Analytics Industry Analysis, Insights and Forecast, 2019-2031
- 6.1. Market Analysis, Insights and Forecast - by Deployment
- 6.1.1. On-premise
- 6.1.2. Cloud
- 6.2. Market Analysis, Insights and Forecast - by End-user Industry
- 6.2.1. IT & Telecom
- 6.2.2. Healthcare
- 6.2.3. Manufacturing
- 6.2.4. BFSI
- 6.2.5. Government
- 6.2.6. Other End-user Industries
- 6.1. Market Analysis, Insights and Forecast - by Deployment
- 7. Europe Capacity Management Analytics Industry Analysis, Insights and Forecast, 2019-2031
- 7.1. Market Analysis, Insights and Forecast - by Deployment
- 7.1.1. On-premise
- 7.1.2. Cloud
- 7.2. Market Analysis, Insights and Forecast - by End-user Industry
- 7.2.1. IT & Telecom
- 7.2.2. Healthcare
- 7.2.3. Manufacturing
- 7.2.4. BFSI
- 7.2.5. Government
- 7.2.6. Other End-user Industries
- 7.1. Market Analysis, Insights and Forecast - by Deployment
- 8. Asia Pacific Capacity Management Analytics Industry Analysis, Insights and Forecast, 2019-2031
- 8.1. Market Analysis, Insights and Forecast - by Deployment
- 8.1.1. On-premise
- 8.1.2. Cloud
- 8.2. Market Analysis, Insights and Forecast - by End-user Industry
- 8.2.1. IT & Telecom
- 8.2.2. Healthcare
- 8.2.3. Manufacturing
- 8.2.4. BFSI
- 8.2.5. Government
- 8.2.6. Other End-user Industries
- 8.1. Market Analysis, Insights and Forecast - by Deployment
- 9. Latin America Capacity Management Analytics Industry Analysis, Insights and Forecast, 2019-2031
- 9.1. Market Analysis, Insights and Forecast - by Deployment
- 9.1.1. On-premise
- 9.1.2. Cloud
- 9.2. Market Analysis, Insights and Forecast - by End-user Industry
- 9.2.1. IT & Telecom
- 9.2.2. Healthcare
- 9.2.3. Manufacturing
- 9.2.4. BFSI
- 9.2.5. Government
- 9.2.6. Other End-user Industries
- 9.1. Market Analysis, Insights and Forecast - by Deployment
- 10. Middle East and Africa Capacity Management Analytics Industry Analysis, Insights and Forecast, 2019-2031
- 10.1. Market Analysis, Insights and Forecast - by Deployment
- 10.1.1. On-premise
- 10.1.2. Cloud
- 10.2. Market Analysis, Insights and Forecast - by End-user Industry
- 10.2.1. IT & Telecom
- 10.2.2. Healthcare
- 10.2.3. Manufacturing
- 10.2.4. BFSI
- 10.2.5. Government
- 10.2.6. Other End-user Industries
- 10.1. Market Analysis, Insights and Forecast - by Deployment
- 11. North America Capacity Management Analytics Industry Analysis, Insights and Forecast, 2019-2031
- 11.1. Market Analysis, Insights and Forecast - By Country/Sub-region
- 11.1.1 United States
- 11.1.2 Canada
- 11.1.3 Mexico
- 12. Europe Capacity Management Analytics Industry Analysis, Insights and Forecast, 2019-2031
- 12.1. Market Analysis, Insights and Forecast - By Country/Sub-region
- 12.1.1 Germany
- 12.1.2 United Kingdom
- 12.1.3 France
- 12.1.4 Spain
- 12.1.5 Italy
- 12.1.6 Spain
- 12.1.7 Belgium
- 12.1.8 Netherland
- 12.1.9 Nordics
- 12.1.10 Rest of Europe
- 13. Asia Pacific Capacity Management Analytics Industry Analysis, Insights and Forecast, 2019-2031
- 13.1. Market Analysis, Insights and Forecast - By Country/Sub-region
- 13.1.1 China
- 13.1.2 Japan
- 13.1.3 India
- 13.1.4 South Korea
- 13.1.5 Southeast Asia
- 13.1.6 Australia
- 13.1.7 Indonesia
- 13.1.8 Phillipes
- 13.1.9 Singapore
- 13.1.10 Thailandc
- 13.1.11 Rest of Asia Pacific
- 14. South America Capacity Management Analytics Industry Analysis, Insights and Forecast, 2019-2031
- 14.1. Market Analysis, Insights and Forecast - By Country/Sub-region
- 14.1.1 Brazil
- 14.1.2 Argentina
- 14.1.3 Peru
- 14.1.4 Chile
- 14.1.5 Colombia
- 14.1.6 Ecuador
- 14.1.7 Venezuela
- 14.1.8 Rest of South America
- 15. North America Capacity Management Analytics Industry Analysis, Insights and Forecast, 2019-2031
- 15.1. Market Analysis, Insights and Forecast - By Country/Sub-region
- 15.1.1 United States
- 15.1.2 Canada
- 15.1.3 Mexico
- 16. MEA Capacity Management Analytics Industry Analysis, Insights and Forecast, 2019-2031
- 16.1. Market Analysis, Insights and Forecast - By Country/Sub-region
- 16.1.1 United Arab Emirates
- 16.1.2 Saudi Arabia
- 16.1.3 South Africa
- 16.1.4 Rest of Middle East and Africa
- 17. Competitive Analysis
- 17.1. Global Market Share Analysis 2024
- 17.2. Company Profiles
- 17.2.1 Precisely (Formerly Syncsort)
- 17.2.1.1. Overview
- 17.2.1.2. Products
- 17.2.1.3. SWOT Analysis
- 17.2.1.4. Recent Developments
- 17.2.1.5. Financials (Based on Availability)
- 17.2.2 Teoco Corporation
- 17.2.2.1. Overview
- 17.2.2.2. Products
- 17.2.2.3. SWOT Analysis
- 17.2.2.4. Recent Developments
- 17.2.2.5. Financials (Based on Availability)
- 17.2.3 IBM Corporation
- 17.2.3.1. Overview
- 17.2.3.2. Products
- 17.2.3.3. SWOT Analysis
- 17.2.3.4. Recent Developments
- 17.2.3.5. Financials (Based on Availability)
- 17.2.4 Helpsystems
- 17.2.4.1. Overview
- 17.2.4.2. Products
- 17.2.4.3. SWOT Analysis
- 17.2.4.4. Recent Developments
- 17.2.4.5. Financials (Based on Availability)
- 17.2.5 ITRS Group Ltd
- 17.2.5.1. Overview
- 17.2.5.2. Products
- 17.2.5.3. SWOT Analysis
- 17.2.5.4. Recent Developments
- 17.2.5.5. Financials (Based on Availability)
- 17.2.6 Hewlett Packard Enterprise Company
- 17.2.6.1. Overview
- 17.2.6.2. Products
- 17.2.6.3. SWOT Analysis
- 17.2.6.4. Recent Developments
- 17.2.6.5. Financials (Based on Availability)
- 17.2.7 Broadcom Inc
- 17.2.7.1. Overview
- 17.2.7.2. Products
- 17.2.7.3. SWOT Analysis
- 17.2.7.4. Recent Developments
- 17.2.7.5. Financials (Based on Availability)
- 17.2.8 BMC Software Inc
- 17.2.8.1. Overview
- 17.2.8.2. Products
- 17.2.8.3. SWOT Analysis
- 17.2.8.4. Recent Developments
- 17.2.8.5. Financials (Based on Availability)
- 17.2.9 Riverbed Technology Inc
- 17.2.9.1. Overview
- 17.2.9.2. Products
- 17.2.9.3. SWOT Analysis
- 17.2.9.4. Recent Developments
- 17.2.9.5. Financials (Based on Availability)
- 17.2.10 NetApp Inc
- 17.2.10.1. Overview
- 17.2.10.2. Products
- 17.2.10.3. SWOT Analysis
- 17.2.10.4. Recent Developments
- 17.2.10.5. Financials (Based on Availability)
- 17.2.11 CPT Global Limited*List Not Exhaustive
- 17.2.11.1. Overview
- 17.2.11.2. Products
- 17.2.11.3. SWOT Analysis
- 17.2.11.4. Recent Developments
- 17.2.11.5. Financials (Based on Availability)
- 17.2.12 VMware Inc
- 17.2.12.1. Overview
- 17.2.12.2. Products
- 17.2.12.3. SWOT Analysis
- 17.2.12.4. Recent Developments
- 17.2.12.5. Financials (Based on Availability)
- 17.2.1 Precisely (Formerly Syncsort)
List of Figures
- Figure 1: Global Capacity Management Analytics Industry Revenue Breakdown (Million, %) by Region 2024 & 2032
- Figure 2: North America Capacity Management Analytics Industry Revenue (Million), by Country 2024 & 2032
- Figure 3: North America Capacity Management Analytics Industry Revenue Share (%), by Country 2024 & 2032
- Figure 4: Europe Capacity Management Analytics Industry Revenue (Million), by Country 2024 & 2032
- Figure 5: Europe Capacity Management Analytics Industry Revenue Share (%), by Country 2024 & 2032
- Figure 6: Asia Pacific Capacity Management Analytics Industry Revenue (Million), by Country 2024 & 2032
- Figure 7: Asia Pacific Capacity Management Analytics Industry Revenue Share (%), by Country 2024 & 2032
- Figure 8: South America Capacity Management Analytics Industry Revenue (Million), by Country 2024 & 2032
- Figure 9: South America Capacity Management Analytics Industry Revenue Share (%), by Country 2024 & 2032
- Figure 10: North America Capacity Management Analytics Industry Revenue (Million), by Country 2024 & 2032
- Figure 11: North America Capacity Management Analytics Industry Revenue Share (%), by Country 2024 & 2032
- Figure 12: MEA Capacity Management Analytics Industry Revenue (Million), by Country 2024 & 2032
- Figure 13: MEA Capacity Management Analytics Industry Revenue Share (%), by Country 2024 & 2032
- Figure 14: North America Capacity Management Analytics Industry Revenue (Million), by Deployment 2024 & 2032
- Figure 15: North America Capacity Management Analytics Industry Revenue Share (%), by Deployment 2024 & 2032
- Figure 16: North America Capacity Management Analytics Industry Revenue (Million), by End-user Industry 2024 & 2032
- Figure 17: North America Capacity Management Analytics Industry Revenue Share (%), by End-user Industry 2024 & 2032
- Figure 18: North America Capacity Management Analytics Industry Revenue (Million), by Country 2024 & 2032
- Figure 19: North America Capacity Management Analytics Industry Revenue Share (%), by Country 2024 & 2032
- Figure 20: Europe Capacity Management Analytics Industry Revenue (Million), by Deployment 2024 & 2032
- Figure 21: Europe Capacity Management Analytics Industry Revenue Share (%), by Deployment 2024 & 2032
- Figure 22: Europe Capacity Management Analytics Industry Revenue (Million), by End-user Industry 2024 & 2032
- Figure 23: Europe Capacity Management Analytics Industry Revenue Share (%), by End-user Industry 2024 & 2032
- Figure 24: Europe Capacity Management Analytics Industry Revenue (Million), by Country 2024 & 2032
- Figure 25: Europe Capacity Management Analytics Industry Revenue Share (%), by Country 2024 & 2032
- Figure 26: Asia Pacific Capacity Management Analytics Industry Revenue (Million), by Deployment 2024 & 2032
- Figure 27: Asia Pacific Capacity Management Analytics Industry Revenue Share (%), by Deployment 2024 & 2032
- Figure 28: Asia Pacific Capacity Management Analytics Industry Revenue (Million), by End-user Industry 2024 & 2032
- Figure 29: Asia Pacific Capacity Management Analytics Industry Revenue Share (%), by End-user Industry 2024 & 2032
- Figure 30: Asia Pacific Capacity Management Analytics Industry Revenue (Million), by Country 2024 & 2032
- Figure 31: Asia Pacific Capacity Management Analytics Industry Revenue Share (%), by Country 2024 & 2032
- Figure 32: Latin America Capacity Management Analytics Industry Revenue (Million), by Deployment 2024 & 2032
- Figure 33: Latin America Capacity Management Analytics Industry Revenue Share (%), by Deployment 2024 & 2032
- Figure 34: Latin America Capacity Management Analytics Industry Revenue (Million), by End-user Industry 2024 & 2032
- Figure 35: Latin America Capacity Management Analytics Industry Revenue Share (%), by End-user Industry 2024 & 2032
- Figure 36: Latin America Capacity Management Analytics Industry Revenue (Million), by Country 2024 & 2032
- Figure 37: Latin America Capacity Management Analytics Industry Revenue Share (%), by Country 2024 & 2032
- Figure 38: Middle East and Africa Capacity Management Analytics Industry Revenue (Million), by Deployment 2024 & 2032
- Figure 39: Middle East and Africa Capacity Management Analytics Industry Revenue Share (%), by Deployment 2024 & 2032
- Figure 40: Middle East and Africa Capacity Management Analytics Industry Revenue (Million), by End-user Industry 2024 & 2032
- Figure 41: Middle East and Africa Capacity Management Analytics Industry Revenue Share (%), by End-user Industry 2024 & 2032
- Figure 42: Middle East and Africa Capacity Management Analytics Industry Revenue (Million), by Country 2024 & 2032
- Figure 43: Middle East and Africa Capacity Management Analytics Industry Revenue Share (%), by Country 2024 & 2032
List of Tables
- Table 1: Global Capacity Management Analytics Industry Revenue Million Forecast, by Region 2019 & 2032
- Table 2: Global Capacity Management Analytics Industry Revenue Million Forecast, by Deployment 2019 & 2032
- Table 3: Global Capacity Management Analytics Industry Revenue Million Forecast, by End-user Industry 2019 & 2032
- Table 4: Global Capacity Management Analytics Industry Revenue Million Forecast, by Region 2019 & 2032
- Table 5: Global Capacity Management Analytics Industry Revenue Million Forecast, by Country 2019 & 2032
- Table 6: United States Capacity Management Analytics Industry Revenue (Million) Forecast, by Application 2019 & 2032
- Table 7: Canada Capacity Management Analytics Industry Revenue (Million) Forecast, by Application 2019 & 2032
- Table 8: Mexico Capacity Management Analytics Industry Revenue (Million) Forecast, by Application 2019 & 2032
- Table 9: Global Capacity Management Analytics Industry Revenue Million Forecast, by Country 2019 & 2032
- Table 10: Germany Capacity Management Analytics Industry Revenue (Million) Forecast, by Application 2019 & 2032
- Table 11: United Kingdom Capacity Management Analytics Industry Revenue (Million) Forecast, by Application 2019 & 2032
- Table 12: France Capacity Management Analytics Industry Revenue (Million) Forecast, by Application 2019 & 2032
- Table 13: Spain Capacity Management Analytics Industry Revenue (Million) Forecast, by Application 2019 & 2032
- Table 14: Italy Capacity Management Analytics Industry Revenue (Million) Forecast, by Application 2019 & 2032
- Table 15: Spain Capacity Management Analytics Industry Revenue (Million) Forecast, by Application 2019 & 2032
- Table 16: Belgium Capacity Management Analytics Industry Revenue (Million) Forecast, by Application 2019 & 2032
- Table 17: Netherland Capacity Management Analytics Industry Revenue (Million) Forecast, by Application 2019 & 2032
- Table 18: Nordics Capacity Management Analytics Industry Revenue (Million) Forecast, by Application 2019 & 2032
- Table 19: Rest of Europe Capacity Management Analytics Industry Revenue (Million) Forecast, by Application 2019 & 2032
- Table 20: Global Capacity Management Analytics Industry Revenue Million Forecast, by Country 2019 & 2032
- Table 21: China Capacity Management Analytics Industry Revenue (Million) Forecast, by Application 2019 & 2032
- Table 22: Japan Capacity Management Analytics Industry Revenue (Million) Forecast, by Application 2019 & 2032
- Table 23: India Capacity Management Analytics Industry Revenue (Million) Forecast, by Application 2019 & 2032
- Table 24: South Korea Capacity Management Analytics Industry Revenue (Million) Forecast, by Application 2019 & 2032
- Table 25: Southeast Asia Capacity Management Analytics Industry Revenue (Million) Forecast, by Application 2019 & 2032
- Table 26: Australia Capacity Management Analytics Industry Revenue (Million) Forecast, by Application 2019 & 2032
- Table 27: Indonesia Capacity Management Analytics Industry Revenue (Million) Forecast, by Application 2019 & 2032
- Table 28: Phillipes Capacity Management Analytics Industry Revenue (Million) Forecast, by Application 2019 & 2032
- Table 29: Singapore Capacity Management Analytics Industry Revenue (Million) Forecast, by Application 2019 & 2032
- Table 30: Thailandc Capacity Management Analytics Industry Revenue (Million) Forecast, by Application 2019 & 2032
- Table 31: Rest of Asia Pacific Capacity Management Analytics Industry Revenue (Million) Forecast, by Application 2019 & 2032
- Table 32: Global Capacity Management Analytics Industry Revenue Million Forecast, by Country 2019 & 2032
- Table 33: Brazil Capacity Management Analytics Industry Revenue (Million) Forecast, by Application 2019 & 2032
- Table 34: Argentina Capacity Management Analytics Industry Revenue (Million) Forecast, by Application 2019 & 2032
- Table 35: Peru Capacity Management Analytics Industry Revenue (Million) Forecast, by Application 2019 & 2032
- Table 36: Chile Capacity Management Analytics Industry Revenue (Million) Forecast, by Application 2019 & 2032
- Table 37: Colombia Capacity Management Analytics Industry Revenue (Million) Forecast, by Application 2019 & 2032
- Table 38: Ecuador Capacity Management Analytics Industry Revenue (Million) Forecast, by Application 2019 & 2032
- Table 39: Venezuela Capacity Management Analytics Industry Revenue (Million) Forecast, by Application 2019 & 2032
- Table 40: Rest of South America Capacity Management Analytics Industry Revenue (Million) Forecast, by Application 2019 & 2032
- Table 41: Global Capacity Management Analytics Industry Revenue Million Forecast, by Country 2019 & 2032
- Table 42: United States Capacity Management Analytics Industry Revenue (Million) Forecast, by Application 2019 & 2032
- Table 43: Canada Capacity Management Analytics Industry Revenue (Million) Forecast, by Application 2019 & 2032
- Table 44: Mexico Capacity Management Analytics Industry Revenue (Million) Forecast, by Application 2019 & 2032
- Table 45: Global Capacity Management Analytics Industry Revenue Million Forecast, by Country 2019 & 2032
- Table 46: United Arab Emirates Capacity Management Analytics Industry Revenue (Million) Forecast, by Application 2019 & 2032
- Table 47: Saudi Arabia Capacity Management Analytics Industry Revenue (Million) Forecast, by Application 2019 & 2032
- Table 48: South Africa Capacity Management Analytics Industry Revenue (Million) Forecast, by Application 2019 & 2032
- Table 49: Rest of Middle East and Africa Capacity Management Analytics Industry Revenue (Million) Forecast, by Application 2019 & 2032
- Table 50: Global Capacity Management Analytics Industry Revenue Million Forecast, by Deployment 2019 & 2032
- Table 51: Global Capacity Management Analytics Industry Revenue Million Forecast, by End-user Industry 2019 & 2032
- Table 52: Global Capacity Management Analytics Industry Revenue Million Forecast, by Country 2019 & 2032
- Table 53: Global Capacity Management Analytics Industry Revenue Million Forecast, by Deployment 2019 & 2032
- Table 54: Global Capacity Management Analytics Industry Revenue Million Forecast, by End-user Industry 2019 & 2032
- Table 55: Global Capacity Management Analytics Industry Revenue Million Forecast, by Country 2019 & 2032
- Table 56: Global Capacity Management Analytics Industry Revenue Million Forecast, by Deployment 2019 & 2032
- Table 57: Global Capacity Management Analytics Industry Revenue Million Forecast, by End-user Industry 2019 & 2032
- Table 58: Global Capacity Management Analytics Industry Revenue Million Forecast, by Country 2019 & 2032
- Table 59: Global Capacity Management Analytics Industry Revenue Million Forecast, by Deployment 2019 & 2032
- Table 60: Global Capacity Management Analytics Industry Revenue Million Forecast, by End-user Industry 2019 & 2032
- Table 61: Global Capacity Management Analytics Industry Revenue Million Forecast, by Country 2019 & 2032
- Table 62: Global Capacity Management Analytics Industry Revenue Million Forecast, by Deployment 2019 & 2032
- Table 63: Global Capacity Management Analytics Industry Revenue Million Forecast, by End-user Industry 2019 & 2032
- Table 64: Global Capacity Management Analytics Industry Revenue Million Forecast, by Country 2019 & 2032
Frequently Asked Questions
1. What is the projected Compound Annual Growth Rate (CAGR) of the Capacity Management Analytics Industry?
The projected CAGR is approximately 18.00%.
2. Which companies are prominent players in the Capacity Management Analytics Industry?
Key companies in the market include Precisely (Formerly Syncsort), Teoco Corporation, IBM Corporation, Helpsystems, ITRS Group Ltd, Hewlett Packard Enterprise Company, Broadcom Inc, BMC Software Inc, Riverbed Technology Inc, NetApp Inc, CPT Global Limited*List Not Exhaustive, VMware Inc.
3. What are the main segments of the Capacity Management Analytics Industry?
The market segments include Deployment , End-user Industry.
4. Can you provide details about the market size?
The market size is estimated to be USD XX Million as of 2022.
5. What are some drivers contributing to market growth?
; Increasing Need for Optimization and Effective Utilization of IT Infrastructures; Increasing Complexities in IT Infrastructures.
6. What are the notable trends driving market growth?
Manufacturing Segment is Expected to Witness Significant Growth.
7. Are there any restraints impacting market growth?
; Lower Adoption Among the SMEs.
8. Can you provide examples of recent developments in the market?
N/A
9. What pricing options are available for accessing the report?
Pricing options include single-user, multi-user, and enterprise licenses priced at USD 4750, USD 5250, and USD 8750 respectively.
10. Is the market size provided in terms of value or volume?
The market size is provided in terms of value, measured in Million.
11. Are there any specific market keywords associated with the report?
Yes, the market keyword associated with the report is "Capacity Management Analytics Industry," which aids in identifying and referencing the specific market segment covered.
12. How do I determine which pricing option suits my needs best?
The pricing options vary based on user requirements and access needs. Individual users may opt for single-user licenses, while businesses requiring broader access may choose multi-user or enterprise licenses for cost-effective access to the report.
13. Are there any additional resources or data provided in the Capacity Management Analytics Industry report?
While the report offers comprehensive insights, it's advisable to review the specific contents or supplementary materials provided to ascertain if additional resources or data are available.
14. How can I stay updated on further developments or reports in the Capacity Management Analytics Industry?
To stay informed about further developments, trends, and reports in the Capacity Management Analytics Industry, consider subscribing to industry newsletters, following relevant companies and organizations, or regularly checking reputable industry news sources and publications.
Methodology
Step 1 - Identification of Relevant Samples Size from Population Database


Step 2 - Approaches for Defining Global Market Size (Value, Volume* & Price*)

Note*: In applicable scenarios
Step 3 - Data Sources
Primary Research
- Web Analytics
- Survey Reports
- Research Institute
- Latest Research Reports
- Opinion Leaders
Secondary Research
- Annual Reports
- White Paper
- Latest Press Release
- Industry Association
- Paid Database
- Investor Presentations

Step 4 - Data Triangulation
Involves using different sources of information in order to increase the validity of a study
These sources are likely to be stakeholders in a program - participants, other researchers, program staff, other community members, and so on.
Then we put all data in single framework & apply various statistical tools to find out the dynamic on the market.
During the analysis stage, feedback from the stakeholder groups would be compared to determine areas of agreement as well as areas of divergence


