
Key Insights
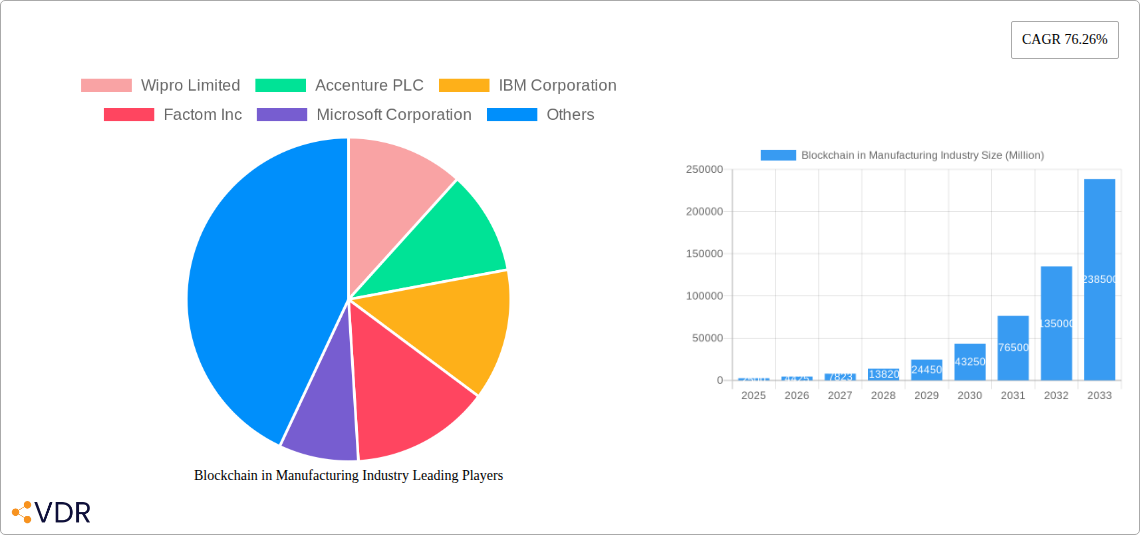
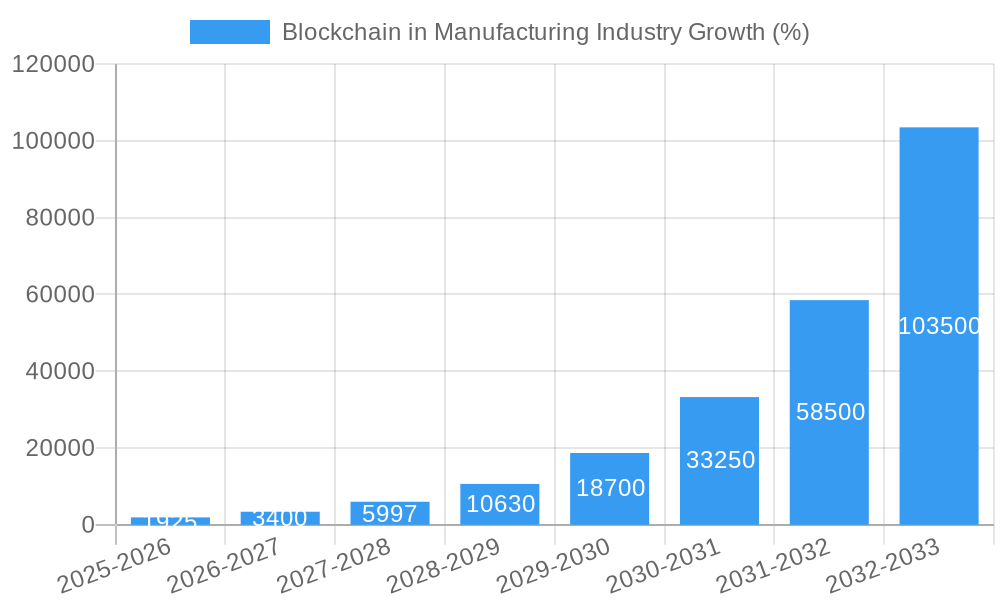
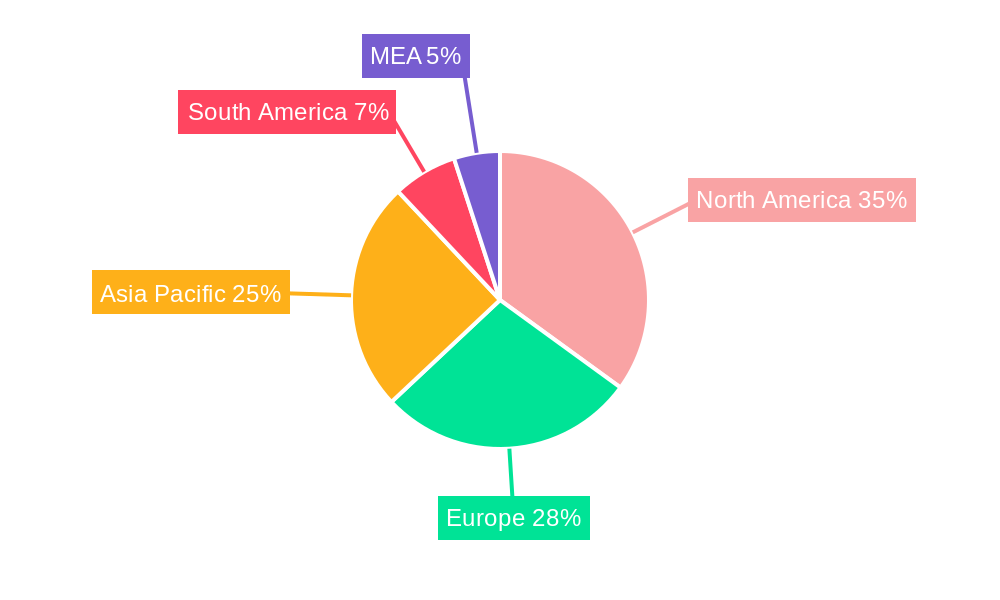
The Blockchain in Manufacturing market is experiencing explosive growth, projected to reach a substantial value by 2033. A 76.26% CAGR indicates significant market expansion driven by several key factors. Increased demand for enhanced supply chain transparency and traceability is a major driver, particularly within industries like automotive, aerospace & defense, and pharmaceuticals, where counterfeit products pose significant risks. Blockchain's ability to secure data, automate processes, and improve efficiency across the entire manufacturing lifecycle, from raw material sourcing to product delivery, is attracting substantial investment. Furthermore, growing regulatory pressures demanding greater accountability and compliance are pushing manufacturers to adopt blockchain solutions for quality control and regulatory reporting. The market is segmented by application (Logistics & Supply Chain Management, Counterfeit Management, Quality Control & Compliance, Other) and end-user vertical (Automotive, Aerospace & Defense, Pharmaceutical, Consumer Electronics, Other). Leading technology companies like IBM, Microsoft, and SAP, along with specialized blockchain firms, are actively developing and deploying solutions, fostering a highly competitive landscape. Geographic expansion is another key trend, with North America and Asia-Pacific currently leading the market, followed by Europe. However, emerging economies in other regions are poised for rapid growth as awareness and adoption increase.
Despite the rapid growth, challenges remain. High implementation costs and a lack of standardized protocols can hinder widespread adoption, especially for smaller manufacturers. Moreover, integrating blockchain technology into existing legacy systems requires significant investment in infrastructure and workforce training. Addressing these challenges through collaborative industry initiatives and government support will be crucial for unlocking the full potential of blockchain technology within the manufacturing sector. The continued refinement of blockchain solutions and a growing awareness of the technology's benefits suggest that the market will continue its robust growth trajectory over the forecast period. Competition amongst established technology giants and innovative startups ensures a dynamic and innovative market.
Blockchain in Manufacturing Industry: A Comprehensive Market Report (2019-2033)
This in-depth report provides a comprehensive analysis of the Blockchain in Manufacturing Industry market, encompassing market dynamics, growth trends, regional dominance, product landscape, key drivers and challenges, emerging opportunities, growth accelerators, key players, notable milestones, and future outlook. The study period covers 2019-2033, with 2025 as the base and estimated year. The forecast period spans 2025-2033, and the historical period encompasses 2019-2024. This report is crucial for industry professionals, investors, and strategists seeking to understand and capitalize on the transformative potential of blockchain technology within the manufacturing sector. The market is projected to reach xx Million by 2033.
Blockchain in Manufacturing Industry Market Dynamics & Structure
This section analyzes the market concentration, technological innovation, regulatory landscape, competitive substitutes, end-user demographics, and mergers & acquisitions (M&A) activity within the Blockchain in Manufacturing Industry. The market is characterized by a moderately concentrated landscape with several key players vying for market share. Technological innovation, driven by advancements in distributed ledger technology (DLT) and increased computing power, is a major driver.
- Market Concentration: Moderate, with key players holding xx% market share (2024).
- Technological Innovation: Rapid advancements in DLT, smart contracts, and improved scalability are accelerating adoption.
- Regulatory Frameworks: Evolving regulatory landscapes across different geographies present both opportunities and challenges. Harmonization of regulations is crucial for wider adoption.
- Competitive Product Substitutes: Traditional centralized systems pose a primary competitive threat, but the benefits of enhanced security and transparency offered by blockchain are driving market shift.
- End-User Demographics: Large enterprises are leading adoption, followed by SMEs. Adoption varies across end-user verticals.
- M&A Trends: A moderate number of M&A deals (xx deals in 2024) indicates consolidation and strategic expansion within the industry. Larger players are acquiring smaller firms to enhance their technological capabilities and market reach. Innovation barriers include the high initial investment cost and complexity in implementing blockchain solutions.
Blockchain in Manufacturing Industry Growth Trends & Insights
The Blockchain in Manufacturing Industry market exhibits substantial growth potential, driven by the increasing need for enhanced supply chain transparency, counterfeit product management, and improved quality control. The market size is projected to experience robust growth during the forecast period. Adoption rates are increasing across various segments, although challenges remain in terms of scalability and interoperability. Technological disruptions, particularly advancements in DLT and increased computational power, are key drivers of growth. The CAGR is projected to be xx% from 2025 to 2033, with market penetration reaching xx% by 2033.
Dominant Regions, Countries, or Segments in Blockchain in Manufacturing Industry
North America currently holds the largest market share, followed by Europe and Asia Pacific. Within applications, Logistics and Supply Chain Management segment leads due to its significant impact on efficiency and traceability. The Automotive and Pharmaceutical end-user verticals demonstrate significant adoption rates. This dominance is fueled by factors including supportive government regulations, strong technological infrastructure, and a high concentration of manufacturing businesses.
Leading Region: North America
Key Drivers:
- Strong technological infrastructure
- Supportive regulatory environments
- High concentration of manufacturing businesses
- Early adoption of advanced technologies
Leading Application Segment: Logistics and Supply Chain Management
Key Drivers: Increased demand for traceability, transparency, and efficiency in supply chain operations.
Leading End-user Vertical: Automotive
Key Drivers: Demand for enhanced quality control, supply chain optimization and product authentication.
Blockchain in Manufacturing Industry Product Landscape
The Blockchain in Manufacturing Industry offers diverse product solutions, including specialized software platforms, hardware solutions, and consulting services. These solutions cater to specific application requirements within various end-user verticals. Key features include enhanced security, data immutability, and improved interoperability, contributing to significant performance improvements across the manufacturing supply chain. Unique selling propositions focus on cost reduction, risk mitigation, and increased efficiency.
Key Drivers, Barriers & Challenges in Blockchain in Manufacturing Industry
Key Drivers: Increased demand for supply chain transparency, growing concerns about counterfeit products, and stringent quality control regulations are key drivers of market growth. Advancements in blockchain technology and supportive government initiatives further accelerate adoption.
Key Challenges: High implementation costs, lack of standardization, and scalability issues pose significant barriers to broader adoption. Data privacy concerns and regulatory uncertainties also affect market growth. The industry faces challenges due to complex integration procedures, resistance to change, and a potential lack of skilled workforce hindering market penetration. These factors could impact market growth by xx% by 2030.
Emerging Opportunities in Blockchain in Manufacturing Industry
Untapped markets exist in developing economies, where blockchain can improve supply chain visibility and reduce counterfeiting. Innovative applications, such as decentralized autonomous organizations (DAOs) for collaborative manufacturing, and evolving consumer preferences toward sustainable and ethically sourced products present significant opportunities. Integration of IoT and AI with blockchain promises even greater efficiency and transparency.
Growth Accelerators in the Blockchain in Manufacturing Industry Industry
Technological breakthroughs in scalability and interoperability will be crucial in driving long-term growth. Strategic partnerships between technology providers and manufacturers can facilitate wider adoption. Expansion into new geographic markets, particularly in developing economies, will unlock significant growth potential. Furthermore, growing awareness among consumers regarding the benefits of blockchain-based solutions will boost market demand.
Key Players Shaping the Blockchain in Manufacturing Industry Market
- Wipro Limited
- Accenture PLC
- IBM Corporation
- Factom Inc
- Microsoft Corporation
- Advanced Micro Devices Inc
- Amazon Web Services Inc
- Oracle Corporation
- Infosys Ltd
- SAP SE
- Intel Corporation
Notable Milestones in Blockchain in Manufacturing Industry Sector
- June 2022: Shell, Accenture, and American Express Global Business Travel launched Avelia, a blockchain-based sustainable aviation fuel (SAF) book-and-claim service. This highlights the growing use of blockchain for environmental sustainability initiatives within the manufacturing sector.
- April 2022: Intel Corporation launched the Intel Blockscale ASIC, an energy-efficient application-specific integrated circuit designed to enhance scalability and sustainability in blockchain applications, impacting the mining industry and its potential application in the future of manufacturing.
In-Depth Blockchain in Manufacturing Industry Market Outlook
The Blockchain in Manufacturing Industry is poised for significant growth driven by technological advancements, increasing regulatory support, and growing consumer demand for transparency and sustainability. Strategic partnerships and expansion into new markets will further fuel market expansion. The focus on enhanced security, scalability, and interoperability will shape future market developments, creating lucrative opportunities for businesses across the value chain.
Blockchain in Manufacturing Industry Segmentation
-
1. Application
- 1.1. Logistics and Supply Chain Management
- 1.2. Counterfeit Management
- 1.3. Quality Control and Compliance
- 1.4. Other Applications
-
2. End-user Vertical
- 2.1. Automotive
- 2.2. Aerospace and Defense
- 2.3. Pharmaceutical
- 2.4. Consumer Electronics
- 2.5. Other End-user Verticals
Blockchain in Manufacturing Industry Segmentation By Geography
- 1. North America
- 2. Europe
- 3. Asia Pacific
- 4. Rest of the World
Blockchain in Manufacturing Industry REPORT HIGHLIGHTS
| Aspects | Details |
|---|---|
| Study Period | 2019-2033 |
| Base Year | 2024 |
| Estimated Year | 2025 |
| Forecast Period | 2025-2033 |
| Historical Period | 2019-2024 |
| Growth Rate | CAGR of 76.26% from 2019-2033 |
| Segmentation |
|
Table of Contents
- 1. Introduction
- 1.1. Research Scope
- 1.2. Market Segmentation
- 1.3. Research Methodology
- 1.4. Definitions and Assumptions
- 2. Executive Summary
- 2.1. Introduction
- 3. Market Dynamics
- 3.1. Introduction
- 3.2. Market Drivers
- 3.2.1. Blockchain-as-a-Service Solutions for Enterprises; Simplifies Business Processes and Reduces Cost of Production
- 3.3. Market Restrains
- 3.3.1. Absence of Common Set of Standards and Regulatory Bodies
- 3.4. Market Trends
- 3.4.1. Automotive Vertical is to Witness the Significant Growth
- 4. Market Factor Analysis
- 4.1. Porters Five Forces
- 4.2. Supply/Value Chain
- 4.3. PESTEL analysis
- 4.4. Market Entropy
- 4.5. Patent/Trademark Analysis
- 5. Global Blockchain in Manufacturing Industry Analysis, Insights and Forecast, 2019-2031
- 5.1. Market Analysis, Insights and Forecast - by Application
- 5.1.1. Logistics and Supply Chain Management
- 5.1.2. Counterfeit Management
- 5.1.3. Quality Control and Compliance
- 5.1.4. Other Applications
- 5.2. Market Analysis, Insights and Forecast - by End-user Vertical
- 5.2.1. Automotive
- 5.2.2. Aerospace and Defense
- 5.2.3. Pharmaceutical
- 5.2.4. Consumer Electronics
- 5.2.5. Other End-user Verticals
- 5.3. Market Analysis, Insights and Forecast - by Region
- 5.3.1. North America
- 5.3.2. Europe
- 5.3.3. Asia Pacific
- 5.3.4. Rest of the World
- 5.1. Market Analysis, Insights and Forecast - by Application
- 6. North America Blockchain in Manufacturing Industry Analysis, Insights and Forecast, 2019-2031
- 6.1. Market Analysis, Insights and Forecast - by Application
- 6.1.1. Logistics and Supply Chain Management
- 6.1.2. Counterfeit Management
- 6.1.3. Quality Control and Compliance
- 6.1.4. Other Applications
- 6.2. Market Analysis, Insights and Forecast - by End-user Vertical
- 6.2.1. Automotive
- 6.2.2. Aerospace and Defense
- 6.2.3. Pharmaceutical
- 6.2.4. Consumer Electronics
- 6.2.5. Other End-user Verticals
- 6.1. Market Analysis, Insights and Forecast - by Application
- 7. Europe Blockchain in Manufacturing Industry Analysis, Insights and Forecast, 2019-2031
- 7.1. Market Analysis, Insights and Forecast - by Application
- 7.1.1. Logistics and Supply Chain Management
- 7.1.2. Counterfeit Management
- 7.1.3. Quality Control and Compliance
- 7.1.4. Other Applications
- 7.2. Market Analysis, Insights and Forecast - by End-user Vertical
- 7.2.1. Automotive
- 7.2.2. Aerospace and Defense
- 7.2.3. Pharmaceutical
- 7.2.4. Consumer Electronics
- 7.2.5. Other End-user Verticals
- 7.1. Market Analysis, Insights and Forecast - by Application
- 8. Asia Pacific Blockchain in Manufacturing Industry Analysis, Insights and Forecast, 2019-2031
- 8.1. Market Analysis, Insights and Forecast - by Application
- 8.1.1. Logistics and Supply Chain Management
- 8.1.2. Counterfeit Management
- 8.1.3. Quality Control and Compliance
- 8.1.4. Other Applications
- 8.2. Market Analysis, Insights and Forecast - by End-user Vertical
- 8.2.1. Automotive
- 8.2.2. Aerospace and Defense
- 8.2.3. Pharmaceutical
- 8.2.4. Consumer Electronics
- 8.2.5. Other End-user Verticals
- 8.1. Market Analysis, Insights and Forecast - by Application
- 9. Rest of the World Blockchain in Manufacturing Industry Analysis, Insights and Forecast, 2019-2031
- 9.1. Market Analysis, Insights and Forecast - by Application
- 9.1.1. Logistics and Supply Chain Management
- 9.1.2. Counterfeit Management
- 9.1.3. Quality Control and Compliance
- 9.1.4. Other Applications
- 9.2. Market Analysis, Insights and Forecast - by End-user Vertical
- 9.2.1. Automotive
- 9.2.2. Aerospace and Defense
- 9.2.3. Pharmaceutical
- 9.2.4. Consumer Electronics
- 9.2.5. Other End-user Verticals
- 9.1. Market Analysis, Insights and Forecast - by Application
- 10. North America Blockchain in Manufacturing Industry Analysis, Insights and Forecast, 2019-2031
- 10.1. Market Analysis, Insights and Forecast - By Country/Sub-region
- 10.1.1 United States
- 10.1.2 Canada
- 10.1.3 Mexico
- 11. Europe Blockchain in Manufacturing Industry Analysis, Insights and Forecast, 2019-2031
- 11.1. Market Analysis, Insights and Forecast - By Country/Sub-region
- 11.1.1 Germany
- 11.1.2 United Kingdom
- 11.1.3 France
- 11.1.4 Spain
- 11.1.5 Italy
- 11.1.6 Spain
- 11.1.7 Belgium
- 11.1.8 Netherland
- 11.1.9 Nordics
- 11.1.10 Rest of Europe
- 12. Asia Pacific Blockchain in Manufacturing Industry Analysis, Insights and Forecast, 2019-2031
- 12.1. Market Analysis, Insights and Forecast - By Country/Sub-region
- 12.1.1 China
- 12.1.2 Japan
- 12.1.3 India
- 12.1.4 South Korea
- 12.1.5 Southeast Asia
- 12.1.6 Australia
- 12.1.7 Indonesia
- 12.1.8 Phillipes
- 12.1.9 Singapore
- 12.1.10 Thailandc
- 12.1.11 Rest of Asia Pacific
- 13. South America Blockchain in Manufacturing Industry Analysis, Insights and Forecast, 2019-2031
- 13.1. Market Analysis, Insights and Forecast - By Country/Sub-region
- 13.1.1 Brazil
- 13.1.2 Argentina
- 13.1.3 Peru
- 13.1.4 Chile
- 13.1.5 Colombia
- 13.1.6 Ecuador
- 13.1.7 Venezuela
- 13.1.8 Rest of South America
- 14. North America Blockchain in Manufacturing Industry Analysis, Insights and Forecast, 2019-2031
- 14.1. Market Analysis, Insights and Forecast - By Country/Sub-region
- 14.1.1 United States
- 14.1.2 Canada
- 14.1.3 Mexico
- 15. MEA Blockchain in Manufacturing Industry Analysis, Insights and Forecast, 2019-2031
- 15.1. Market Analysis, Insights and Forecast - By Country/Sub-region
- 15.1.1 United Arab Emirates
- 15.1.2 Saudi Arabia
- 15.1.3 South Africa
- 15.1.4 Rest of Middle East and Africa
- 16. Competitive Analysis
- 16.1. Global Market Share Analysis 2024
- 16.2. Company Profiles
- 16.2.1 Wipro Limited
- 16.2.1.1. Overview
- 16.2.1.2. Products
- 16.2.1.3. SWOT Analysis
- 16.2.1.4. Recent Developments
- 16.2.1.5. Financials (Based on Availability)
- 16.2.2 Accenture PLC
- 16.2.2.1. Overview
- 16.2.2.2. Products
- 16.2.2.3. SWOT Analysis
- 16.2.2.4. Recent Developments
- 16.2.2.5. Financials (Based on Availability)
- 16.2.3 IBM Corporation
- 16.2.3.1. Overview
- 16.2.3.2. Products
- 16.2.3.3. SWOT Analysis
- 16.2.3.4. Recent Developments
- 16.2.3.5. Financials (Based on Availability)
- 16.2.4 Factom Inc
- 16.2.4.1. Overview
- 16.2.4.2. Products
- 16.2.4.3. SWOT Analysis
- 16.2.4.4. Recent Developments
- 16.2.4.5. Financials (Based on Availability)
- 16.2.5 Microsoft Corporation
- 16.2.5.1. Overview
- 16.2.5.2. Products
- 16.2.5.3. SWOT Analysis
- 16.2.5.4. Recent Developments
- 16.2.5.5. Financials (Based on Availability)
- 16.2.6 Advanced Micro Devices Inc
- 16.2.6.1. Overview
- 16.2.6.2. Products
- 16.2.6.3. SWOT Analysis
- 16.2.6.4. Recent Developments
- 16.2.6.5. Financials (Based on Availability)
- 16.2.7 Amazon Web Services Inc
- 16.2.7.1. Overview
- 16.2.7.2. Products
- 16.2.7.3. SWOT Analysis
- 16.2.7.4. Recent Developments
- 16.2.7.5. Financials (Based on Availability)
- 16.2.8 Oracle Corporation
- 16.2.8.1. Overview
- 16.2.8.2. Products
- 16.2.8.3. SWOT Analysis
- 16.2.8.4. Recent Developments
- 16.2.8.5. Financials (Based on Availability)
- 16.2.9 Infosys Ltd*List Not Exhaustive
- 16.2.9.1. Overview
- 16.2.9.2. Products
- 16.2.9.3. SWOT Analysis
- 16.2.9.4. Recent Developments
- 16.2.9.5. Financials (Based on Availability)
- 16.2.10 SAP SE
- 16.2.10.1. Overview
- 16.2.10.2. Products
- 16.2.10.3. SWOT Analysis
- 16.2.10.4. Recent Developments
- 16.2.10.5. Financials (Based on Availability)
- 16.2.11 Intel Corporation
- 16.2.11.1. Overview
- 16.2.11.2. Products
- 16.2.11.3. SWOT Analysis
- 16.2.11.4. Recent Developments
- 16.2.11.5. Financials (Based on Availability)
- 16.2.1 Wipro Limited
List of Figures
- Figure 1: Global Blockchain in Manufacturing Industry Revenue Breakdown (Million, %) by Region 2024 & 2032
- Figure 2: North America Blockchain in Manufacturing Industry Revenue (Million), by Country 2024 & 2032
- Figure 3: North America Blockchain in Manufacturing Industry Revenue Share (%), by Country 2024 & 2032
- Figure 4: Europe Blockchain in Manufacturing Industry Revenue (Million), by Country 2024 & 2032
- Figure 5: Europe Blockchain in Manufacturing Industry Revenue Share (%), by Country 2024 & 2032
- Figure 6: Asia Pacific Blockchain in Manufacturing Industry Revenue (Million), by Country 2024 & 2032
- Figure 7: Asia Pacific Blockchain in Manufacturing Industry Revenue Share (%), by Country 2024 & 2032
- Figure 8: South America Blockchain in Manufacturing Industry Revenue (Million), by Country 2024 & 2032
- Figure 9: South America Blockchain in Manufacturing Industry Revenue Share (%), by Country 2024 & 2032
- Figure 10: North America Blockchain in Manufacturing Industry Revenue (Million), by Country 2024 & 2032
- Figure 11: North America Blockchain in Manufacturing Industry Revenue Share (%), by Country 2024 & 2032
- Figure 12: MEA Blockchain in Manufacturing Industry Revenue (Million), by Country 2024 & 2032
- Figure 13: MEA Blockchain in Manufacturing Industry Revenue Share (%), by Country 2024 & 2032
- Figure 14: North America Blockchain in Manufacturing Industry Revenue (Million), by Application 2024 & 2032
- Figure 15: North America Blockchain in Manufacturing Industry Revenue Share (%), by Application 2024 & 2032
- Figure 16: North America Blockchain in Manufacturing Industry Revenue (Million), by End-user Vertical 2024 & 2032
- Figure 17: North America Blockchain in Manufacturing Industry Revenue Share (%), by End-user Vertical 2024 & 2032
- Figure 18: North America Blockchain in Manufacturing Industry Revenue (Million), by Country 2024 & 2032
- Figure 19: North America Blockchain in Manufacturing Industry Revenue Share (%), by Country 2024 & 2032
- Figure 20: Europe Blockchain in Manufacturing Industry Revenue (Million), by Application 2024 & 2032
- Figure 21: Europe Blockchain in Manufacturing Industry Revenue Share (%), by Application 2024 & 2032
- Figure 22: Europe Blockchain in Manufacturing Industry Revenue (Million), by End-user Vertical 2024 & 2032
- Figure 23: Europe Blockchain in Manufacturing Industry Revenue Share (%), by End-user Vertical 2024 & 2032
- Figure 24: Europe Blockchain in Manufacturing Industry Revenue (Million), by Country 2024 & 2032
- Figure 25: Europe Blockchain in Manufacturing Industry Revenue Share (%), by Country 2024 & 2032
- Figure 26: Asia Pacific Blockchain in Manufacturing Industry Revenue (Million), by Application 2024 & 2032
- Figure 27: Asia Pacific Blockchain in Manufacturing Industry Revenue Share (%), by Application 2024 & 2032
- Figure 28: Asia Pacific Blockchain in Manufacturing Industry Revenue (Million), by End-user Vertical 2024 & 2032
- Figure 29: Asia Pacific Blockchain in Manufacturing Industry Revenue Share (%), by End-user Vertical 2024 & 2032
- Figure 30: Asia Pacific Blockchain in Manufacturing Industry Revenue (Million), by Country 2024 & 2032
- Figure 31: Asia Pacific Blockchain in Manufacturing Industry Revenue Share (%), by Country 2024 & 2032
- Figure 32: Rest of the World Blockchain in Manufacturing Industry Revenue (Million), by Application 2024 & 2032
- Figure 33: Rest of the World Blockchain in Manufacturing Industry Revenue Share (%), by Application 2024 & 2032
- Figure 34: Rest of the World Blockchain in Manufacturing Industry Revenue (Million), by End-user Vertical 2024 & 2032
- Figure 35: Rest of the World Blockchain in Manufacturing Industry Revenue Share (%), by End-user Vertical 2024 & 2032
- Figure 36: Rest of the World Blockchain in Manufacturing Industry Revenue (Million), by Country 2024 & 2032
- Figure 37: Rest of the World Blockchain in Manufacturing Industry Revenue Share (%), by Country 2024 & 2032
List of Tables
- Table 1: Global Blockchain in Manufacturing Industry Revenue Million Forecast, by Region 2019 & 2032
- Table 2: Global Blockchain in Manufacturing Industry Revenue Million Forecast, by Application 2019 & 2032
- Table 3: Global Blockchain in Manufacturing Industry Revenue Million Forecast, by End-user Vertical 2019 & 2032
- Table 4: Global Blockchain in Manufacturing Industry Revenue Million Forecast, by Region 2019 & 2032
- Table 5: Global Blockchain in Manufacturing Industry Revenue Million Forecast, by Country 2019 & 2032
- Table 6: United States Blockchain in Manufacturing Industry Revenue (Million) Forecast, by Application 2019 & 2032
- Table 7: Canada Blockchain in Manufacturing Industry Revenue (Million) Forecast, by Application 2019 & 2032
- Table 8: Mexico Blockchain in Manufacturing Industry Revenue (Million) Forecast, by Application 2019 & 2032
- Table 9: Global Blockchain in Manufacturing Industry Revenue Million Forecast, by Country 2019 & 2032
- Table 10: Germany Blockchain in Manufacturing Industry Revenue (Million) Forecast, by Application 2019 & 2032
- Table 11: United Kingdom Blockchain in Manufacturing Industry Revenue (Million) Forecast, by Application 2019 & 2032
- Table 12: France Blockchain in Manufacturing Industry Revenue (Million) Forecast, by Application 2019 & 2032
- Table 13: Spain Blockchain in Manufacturing Industry Revenue (Million) Forecast, by Application 2019 & 2032
- Table 14: Italy Blockchain in Manufacturing Industry Revenue (Million) Forecast, by Application 2019 & 2032
- Table 15: Spain Blockchain in Manufacturing Industry Revenue (Million) Forecast, by Application 2019 & 2032
- Table 16: Belgium Blockchain in Manufacturing Industry Revenue (Million) Forecast, by Application 2019 & 2032
- Table 17: Netherland Blockchain in Manufacturing Industry Revenue (Million) Forecast, by Application 2019 & 2032
- Table 18: Nordics Blockchain in Manufacturing Industry Revenue (Million) Forecast, by Application 2019 & 2032
- Table 19: Rest of Europe Blockchain in Manufacturing Industry Revenue (Million) Forecast, by Application 2019 & 2032
- Table 20: Global Blockchain in Manufacturing Industry Revenue Million Forecast, by Country 2019 & 2032
- Table 21: China Blockchain in Manufacturing Industry Revenue (Million) Forecast, by Application 2019 & 2032
- Table 22: Japan Blockchain in Manufacturing Industry Revenue (Million) Forecast, by Application 2019 & 2032
- Table 23: India Blockchain in Manufacturing Industry Revenue (Million) Forecast, by Application 2019 & 2032
- Table 24: South Korea Blockchain in Manufacturing Industry Revenue (Million) Forecast, by Application 2019 & 2032
- Table 25: Southeast Asia Blockchain in Manufacturing Industry Revenue (Million) Forecast, by Application 2019 & 2032
- Table 26: Australia Blockchain in Manufacturing Industry Revenue (Million) Forecast, by Application 2019 & 2032
- Table 27: Indonesia Blockchain in Manufacturing Industry Revenue (Million) Forecast, by Application 2019 & 2032
- Table 28: Phillipes Blockchain in Manufacturing Industry Revenue (Million) Forecast, by Application 2019 & 2032
- Table 29: Singapore Blockchain in Manufacturing Industry Revenue (Million) Forecast, by Application 2019 & 2032
- Table 30: Thailandc Blockchain in Manufacturing Industry Revenue (Million) Forecast, by Application 2019 & 2032
- Table 31: Rest of Asia Pacific Blockchain in Manufacturing Industry Revenue (Million) Forecast, by Application 2019 & 2032
- Table 32: Global Blockchain in Manufacturing Industry Revenue Million Forecast, by Country 2019 & 2032
- Table 33: Brazil Blockchain in Manufacturing Industry Revenue (Million) Forecast, by Application 2019 & 2032
- Table 34: Argentina Blockchain in Manufacturing Industry Revenue (Million) Forecast, by Application 2019 & 2032
- Table 35: Peru Blockchain in Manufacturing Industry Revenue (Million) Forecast, by Application 2019 & 2032
- Table 36: Chile Blockchain in Manufacturing Industry Revenue (Million) Forecast, by Application 2019 & 2032
- Table 37: Colombia Blockchain in Manufacturing Industry Revenue (Million) Forecast, by Application 2019 & 2032
- Table 38: Ecuador Blockchain in Manufacturing Industry Revenue (Million) Forecast, by Application 2019 & 2032
- Table 39: Venezuela Blockchain in Manufacturing Industry Revenue (Million) Forecast, by Application 2019 & 2032
- Table 40: Rest of South America Blockchain in Manufacturing Industry Revenue (Million) Forecast, by Application 2019 & 2032
- Table 41: Global Blockchain in Manufacturing Industry Revenue Million Forecast, by Country 2019 & 2032
- Table 42: United States Blockchain in Manufacturing Industry Revenue (Million) Forecast, by Application 2019 & 2032
- Table 43: Canada Blockchain in Manufacturing Industry Revenue (Million) Forecast, by Application 2019 & 2032
- Table 44: Mexico Blockchain in Manufacturing Industry Revenue (Million) Forecast, by Application 2019 & 2032
- Table 45: Global Blockchain in Manufacturing Industry Revenue Million Forecast, by Country 2019 & 2032
- Table 46: United Arab Emirates Blockchain in Manufacturing Industry Revenue (Million) Forecast, by Application 2019 & 2032
- Table 47: Saudi Arabia Blockchain in Manufacturing Industry Revenue (Million) Forecast, by Application 2019 & 2032
- Table 48: South Africa Blockchain in Manufacturing Industry Revenue (Million) Forecast, by Application 2019 & 2032
- Table 49: Rest of Middle East and Africa Blockchain in Manufacturing Industry Revenue (Million) Forecast, by Application 2019 & 2032
- Table 50: Global Blockchain in Manufacturing Industry Revenue Million Forecast, by Application 2019 & 2032
- Table 51: Global Blockchain in Manufacturing Industry Revenue Million Forecast, by End-user Vertical 2019 & 2032
- Table 52: Global Blockchain in Manufacturing Industry Revenue Million Forecast, by Country 2019 & 2032
- Table 53: Global Blockchain in Manufacturing Industry Revenue Million Forecast, by Application 2019 & 2032
- Table 54: Global Blockchain in Manufacturing Industry Revenue Million Forecast, by End-user Vertical 2019 & 2032
- Table 55: Global Blockchain in Manufacturing Industry Revenue Million Forecast, by Country 2019 & 2032
- Table 56: Global Blockchain in Manufacturing Industry Revenue Million Forecast, by Application 2019 & 2032
- Table 57: Global Blockchain in Manufacturing Industry Revenue Million Forecast, by End-user Vertical 2019 & 2032
- Table 58: Global Blockchain in Manufacturing Industry Revenue Million Forecast, by Country 2019 & 2032
- Table 59: Global Blockchain in Manufacturing Industry Revenue Million Forecast, by Application 2019 & 2032
- Table 60: Global Blockchain in Manufacturing Industry Revenue Million Forecast, by End-user Vertical 2019 & 2032
- Table 61: Global Blockchain in Manufacturing Industry Revenue Million Forecast, by Country 2019 & 2032
Frequently Asked Questions
1. What is the projected Compound Annual Growth Rate (CAGR) of the Blockchain in Manufacturing Industry?
The projected CAGR is approximately 76.26%.
2. Which companies are prominent players in the Blockchain in Manufacturing Industry?
Key companies in the market include Wipro Limited, Accenture PLC, IBM Corporation, Factom Inc, Microsoft Corporation, Advanced Micro Devices Inc, Amazon Web Services Inc, Oracle Corporation, Infosys Ltd*List Not Exhaustive, SAP SE, Intel Corporation.
3. What are the main segments of the Blockchain in Manufacturing Industry?
The market segments include Application, End-user Vertical.
4. Can you provide details about the market size?
The market size is estimated to be USD XX Million as of 2022.
5. What are some drivers contributing to market growth?
Blockchain-as-a-Service Solutions for Enterprises; Simplifies Business Processes and Reduces Cost of Production.
6. What are the notable trends driving market growth?
Automotive Vertical is to Witness the Significant Growth.
7. Are there any restraints impacting market growth?
Absence of Common Set of Standards and Regulatory Bodies.
8. Can you provide examples of recent developments in the market?
June 2022: Shell, Accenture, and American Express Global Business Travel collaborated to launch Avelia, one of the first digital book-and-claim services for sustainable aviation fuel (SAF) backed by blockchain for business travel. The program's pilot phase intends to show the validity of the book-and-claim concept by securing the distribution of SAF's environmental qualities to businesses and airlines after the fuel has been supplied into the fuel network using blockchain technology.
9. What pricing options are available for accessing the report?
Pricing options include single-user, multi-user, and enterprise licenses priced at USD 4750, USD 5250, and USD 8750 respectively.
10. Is the market size provided in terms of value or volume?
The market size is provided in terms of value, measured in Million.
11. Are there any specific market keywords associated with the report?
Yes, the market keyword associated with the report is "Blockchain in Manufacturing Industry," which aids in identifying and referencing the specific market segment covered.
12. How do I determine which pricing option suits my needs best?
The pricing options vary based on user requirements and access needs. Individual users may opt for single-user licenses, while businesses requiring broader access may choose multi-user or enterprise licenses for cost-effective access to the report.
13. Are there any additional resources or data provided in the Blockchain in Manufacturing Industry report?
While the report offers comprehensive insights, it's advisable to review the specific contents or supplementary materials provided to ascertain if additional resources or data are available.
14. How can I stay updated on further developments or reports in the Blockchain in Manufacturing Industry?
To stay informed about further developments, trends, and reports in the Blockchain in Manufacturing Industry, consider subscribing to industry newsletters, following relevant companies and organizations, or regularly checking reputable industry news sources and publications.
Methodology
Step 1 - Identification of Relevant Samples Size from Population Database


Step 2 - Approaches for Defining Global Market Size (Value, Volume* & Price*)

Note*: In applicable scenarios
Step 3 - Data Sources
Primary Research
- Web Analytics
- Survey Reports
- Research Institute
- Latest Research Reports
- Opinion Leaders
Secondary Research
- Annual Reports
- White Paper
- Latest Press Release
- Industry Association
- Paid Database
- Investor Presentations

Step 4 - Data Triangulation
Involves using different sources of information in order to increase the validity of a study
These sources are likely to be stakeholders in a program - participants, other researchers, program staff, other community members, and so on.
Then we put all data in single framework & apply various statistical tools to find out the dynamic on the market.
During the analysis stage, feedback from the stakeholder groups would be compared to determine areas of agreement as well as areas of divergence


