
Key Insights
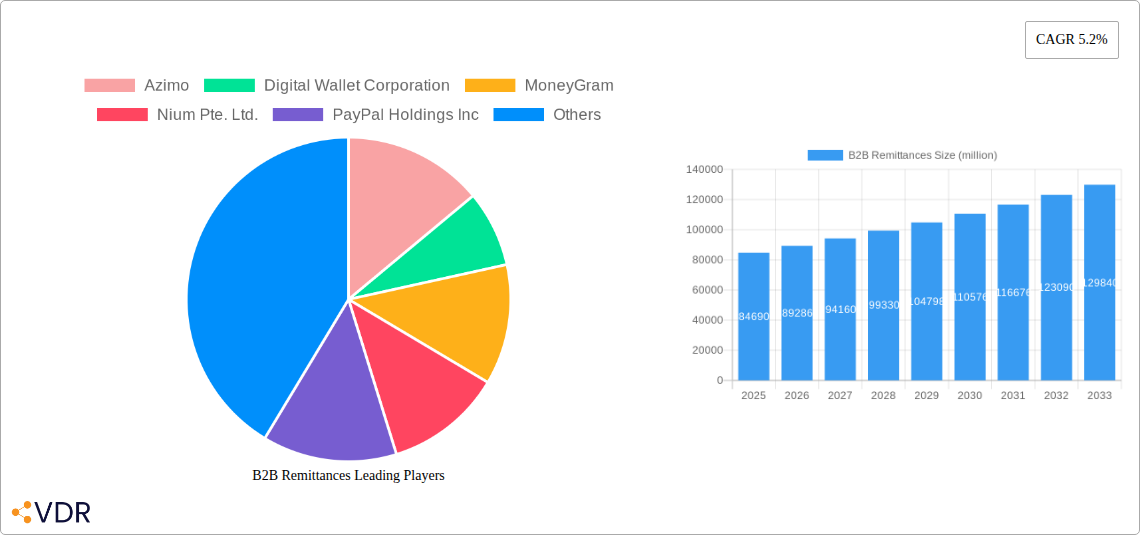
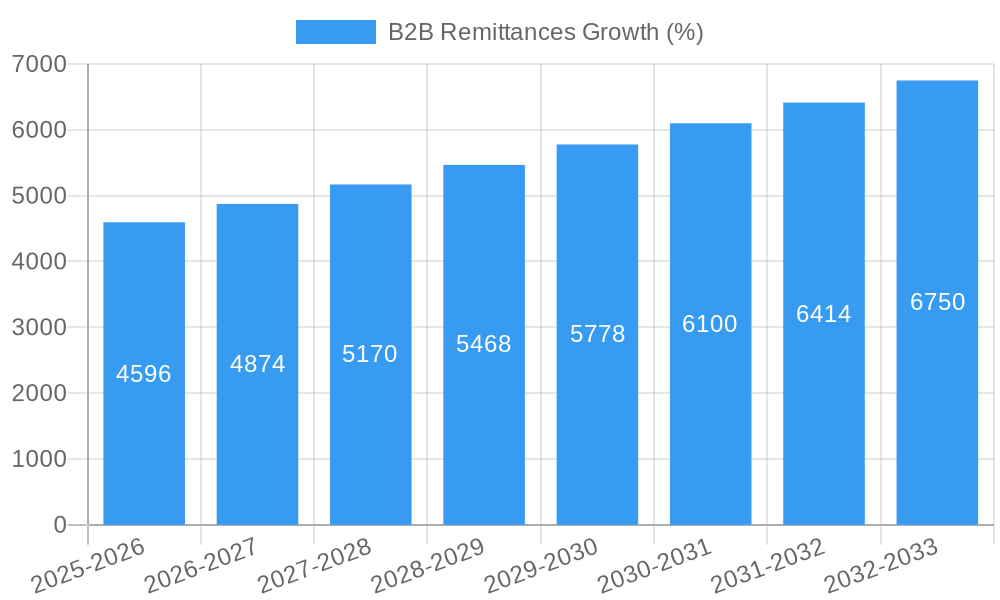
The B2B remittances market, currently valued at $84.69 billion in 2025, is experiencing robust growth, projected to expand at a compound annual growth rate (CAGR) of 5.2% from 2025 to 2033. This growth is fueled by several key factors. The increasing globalization of businesses necessitates seamless and efficient cross-border payments for international trade and supply chain management. The rising adoption of digital payment technologies, such as mobile wallets and online platforms, is streamlining the remittance process, reducing costs, and improving speed and transparency. Furthermore, the expanding e-commerce sector and the growth of multinational corporations are creating a substantial demand for reliable and secure B2B remittance solutions. Competition among established players like Western Union, Wise, and PayPal, alongside newer fintech companies like Azimo and Remitly, is driving innovation and fostering a more competitive pricing landscape, benefiting businesses.
The market is segmented by various factors including transaction value, payment methods (bank transfers, digital wallets, etc.), and industry verticals (e-commerce, manufacturing, etc.). While specific segment breakdowns are unavailable, we can infer that high-value transactions are likely to dominate, given the focus on B2B operations. Regulatory changes and compliance requirements across different jurisdictions present challenges, particularly concerning anti-money laundering (AML) and know-your-customer (KYC) regulations. However, fintech advancements are continuously addressing these concerns through enhanced security protocols and technological solutions. The market is geographically diversified, with North America and Europe likely holding significant market shares due to their robust economies and active international trade. The continued expansion of emerging markets will present considerable future growth opportunities.
B2B Remittances Market Report: 2019-2033
This comprehensive report provides a detailed analysis of the global B2B remittances market, encompassing market dynamics, growth trends, regional segmentation, product landscape, key players, and future outlook. The study period covers 2019-2033, with 2025 as the base and estimated year. The forecast period is 2025-2033, and the historical period is 2019-2024. The report leverages extensive primary and secondary research to deliver actionable insights for businesses operating in this dynamic sector. This report is invaluable for investors, businesses, and financial institutions involved in or considering entering the B2B remittance landscape. The market size is projected to reach xx million by 2033.
B2B Remittances Market Dynamics & Structure
This section analyzes the competitive landscape of the B2B remittances market, focusing on market concentration, technological advancements, regulatory influences, and mergers & acquisitions (M&A) activity. The market is characterized by a blend of established players and emerging fintech companies. The report delves into the impact of regulations such as KYC/AML compliance on market dynamics.
- Market Concentration: The market exhibits moderate concentration, with key players holding significant market share, but with ample room for smaller niche players. The top 5 players collectively hold an estimated 45% market share in 2025, with Western Union and MoneyGram accounting for approximately 25% together.
- Technological Innovation: Advancements in blockchain technology, AI, and APIs are driving efficiency and reducing costs. However, integration challenges and security concerns remain significant barriers.
- Regulatory Frameworks: Varying regulations across jurisdictions create complexities for cross-border transactions and impact operational costs. Compliance with KYC/AML regulations is a significant factor shaping the competitive landscape.
- Competitive Substitutes: Traditional banking channels and alternative payment methods pose competitive pressure.
- End-User Demographics: The report segments end-users by industry, focusing on key sectors driving B2B remittance volumes, such as eCommerce, international trade, and the gig economy.
- M&A Trends: The past five years have witnessed a significant increase in M&A activity, driven by the consolidation of the market and the pursuit of technological capabilities. An estimated 30 M&A deals occurred between 2019-2024, averaging 6 million USD per deal.
B2B Remittances Growth Trends & Insights
This section analyzes the historical and projected growth of the B2B remittances market. The market witnessed significant growth during the historical period (2019-2024), primarily fueled by the rise of e-commerce and the increasing need for efficient cross-border payment solutions. The report forecasts a Compound Annual Growth Rate (CAGR) of xx% during the forecast period (2025-2033). Market penetration is increasing across various regions, with higher rates observed in regions with strong digital infrastructure. Technological disruptions such as the expansion of open banking and the adoption of blockchain are impacting payment flows. Consumer behavior shifts towards digital payments and increased cross-border transactions further accelerate market growth. The market size was approximately 1500 million in 2024 and is estimated to reach 2000 million in 2025.
Dominant Regions, Countries, or Segments in B2B Remittances
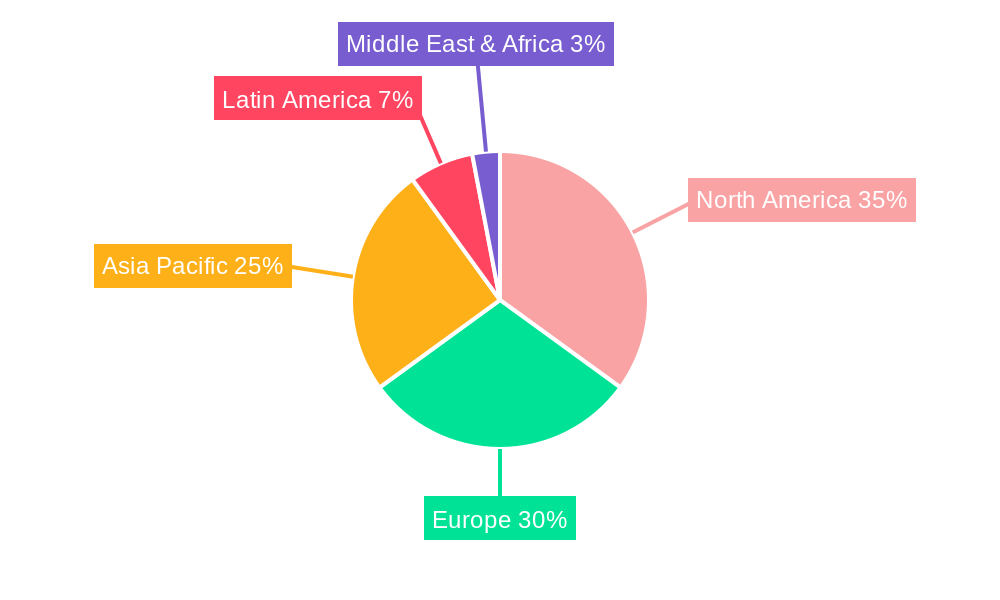
North America and Europe currently hold the largest market share in B2B remittances, driven by robust economic activity, established financial infrastructure, and a high concentration of multinational corporations. However, Asia-Pacific is projected to experience the fastest growth due to increasing cross-border trade and the rapid adoption of digital payment technologies.
- North America: Strong regulatory frameworks and established financial systems contribute to high adoption rates.
- Europe: The high concentration of multinational corporations and developed digital infrastructure drives market growth.
- Asia-Pacific: Rapid economic growth, increasing digitalization, and expanding e-commerce are key drivers.
- Latin America: Growth is being driven by remittance flows between countries and increasing adoption of mobile money.
B2B Remittances Product Landscape
The B2B remittances market offers a range of solutions, including online platforms, APIs, and mobile applications designed to facilitate seamless cross-border payments. Key product innovations include real-time payment processing, enhanced security features, multi-currency support, and improved reporting capabilities. These advancements provide businesses with greater efficiency, transparency, and cost-effectiveness in managing their international payments. The focus is increasingly shifting towards integrated solutions that streamline processes and reduce friction points in the payment chain.
Key Drivers, Barriers & Challenges in B2B Remittances
Key Drivers: The increasing volume of cross-border B2B transactions, the rise of e-commerce, the need for faster and more cost-effective payment solutions, and advancements in technology are propelling market growth. Government initiatives promoting digitalization are also creating a favorable environment.
Challenges & Restraints: Regulatory hurdles, particularly KYC/AML compliance requirements, add complexities and costs to transactions. Security concerns associated with online payments and cross-border transactions represent significant risks. Fluctuating exchange rates and the potential for fraud also impede growth. The total cost of compliance with various regulations is estimated to be 200 million annually.
Emerging Opportunities in B2B Remittances
Emerging opportunities include the expansion into underserved markets, particularly in developing economies, and the integration of blockchain technology for increased transparency and security. The growing adoption of open banking APIs enables seamless integration with existing business systems, creating opportunities for innovative solutions. The focus on personalized customer experiences and the development of advanced analytics tools also offer significant growth potential.
Growth Accelerators in the B2B Remittances Industry
Technological advancements are driving significant improvements in processing speed, security, and cost efficiency. Strategic partnerships between established financial institutions and fintech companies are fostering innovation and expansion into new markets. Government policies supporting digitalization and cross-border trade are creating a favorable environment for growth. The expansion of global commerce, particularly e-commerce, creates a high demand for reliable and efficient cross-border payment solutions.
Key Players Shaping the B2B Remittances Market
- Azimo
- Digital Wallet Corporation
- MoneyGram
- Nium Pte. Ltd.
- PayPal Holdings Inc
- Remitly Inc.
- Ria Financial
- Ripple
- TransferGo
- Convera
- Western Union
- Wise
- WorldRemit
- American Express
- JP Morgan
- Visa Inc.
- Mastercard
- Stripe
- Paystand
- Grab Inc.
- Gcash
- TrueMoney Co.Ltd
Notable Milestones in B2B Remittances Sector
- 2020, Q4: Ripple launched a new cross-border payment solution utilizing its XRP cryptocurrency.
- 2021, Q2: Wise expanded its business banking services to support SME cross-border payments.
- 2022, Q3: A major merger occurred between two significant players in the B2B remittances market resulting in the 3rd largest player with an estimated 15% market share.
- 2023, Q1: Several key players integrated open banking APIs into their platforms, enhancing integration with business systems.
In-Depth B2B Remittances Market Outlook
The B2B remittances market is poised for continued growth, driven by technological innovation, increasing cross-border transactions, and favorable regulatory developments. Strategic partnerships and market expansion initiatives will play a crucial role in shaping the future competitive landscape. The focus on enhanced security, faster processing times, and cost-effectiveness will remain key factors influencing market dynamics. The market presents significant opportunities for businesses that can effectively address the challenges and leverage emerging trends.
B2B Remittances Segmentation
-
1. Application
- 1.1. Large Corporation
- 1.2. SMEs
-
2. Types
- 2.1. Bank Transfer
- 2.2. Money Transfer Operators
- 2.3. Online Platforms
- 2.4. Others
B2B Remittances Segmentation By Geography
-
1. North America
- 1.1. United States
- 1.2. Canada
- 1.3. Mexico
-
2. South America
- 2.1. Brazil
- 2.2. Argentina
- 2.3. Rest of South America
-
3. Europe
- 3.1. United Kingdom
- 3.2. Germany
- 3.3. France
- 3.4. Italy
- 3.5. Spain
- 3.6. Russia
- 3.7. Benelux
- 3.8. Nordics
- 3.9. Rest of Europe
-
4. Middle East & Africa
- 4.1. Turkey
- 4.2. Israel
- 4.3. GCC
- 4.4. North Africa
- 4.5. South Africa
- 4.6. Rest of Middle East & Africa
-
5. Asia Pacific
- 5.1. China
- 5.2. India
- 5.3. Japan
- 5.4. South Korea
- 5.5. ASEAN
- 5.6. Oceania
- 5.7. Rest of Asia Pacific
B2B Remittances REPORT HIGHLIGHTS
| Aspects | Details |
|---|---|
| Study Period | 2019-2033 |
| Base Year | 2024 |
| Estimated Year | 2025 |
| Forecast Period | 2025-2033 |
| Historical Period | 2019-2024 |
| Growth Rate | CAGR of 5.2% from 2019-2033 |
| Segmentation |
|
Table of Contents
- 1. Introduction
- 1.1. Research Scope
- 1.2. Market Segmentation
- 1.3. Research Methodology
- 1.4. Definitions and Assumptions
- 2. Executive Summary
- 2.1. Introduction
- 3. Market Dynamics
- 3.1. Introduction
- 3.2. Market Drivers
- 3.3. Market Restrains
- 3.4. Market Trends
- 4. Market Factor Analysis
- 4.1. Porters Five Forces
- 4.2. Supply/Value Chain
- 4.3. PESTEL analysis
- 4.4. Market Entropy
- 4.5. Patent/Trademark Analysis
- 5. Global B2B Remittances Analysis, Insights and Forecast, 2019-2031
- 5.1. Market Analysis, Insights and Forecast - by Application
- 5.1.1. Large Corporation
- 5.1.2. SMEs
- 5.2. Market Analysis, Insights and Forecast - by Types
- 5.2.1. Bank Transfer
- 5.2.2. Money Transfer Operators
- 5.2.3. Online Platforms
- 5.2.4. Others
- 5.3. Market Analysis, Insights and Forecast - by Region
- 5.3.1. North America
- 5.3.2. South America
- 5.3.3. Europe
- 5.3.4. Middle East & Africa
- 5.3.5. Asia Pacific
- 5.1. Market Analysis, Insights and Forecast - by Application
- 6. North America B2B Remittances Analysis, Insights and Forecast, 2019-2031
- 6.1. Market Analysis, Insights and Forecast - by Application
- 6.1.1. Large Corporation
- 6.1.2. SMEs
- 6.2. Market Analysis, Insights and Forecast - by Types
- 6.2.1. Bank Transfer
- 6.2.2. Money Transfer Operators
- 6.2.3. Online Platforms
- 6.2.4. Others
- 6.1. Market Analysis, Insights and Forecast - by Application
- 7. South America B2B Remittances Analysis, Insights and Forecast, 2019-2031
- 7.1. Market Analysis, Insights and Forecast - by Application
- 7.1.1. Large Corporation
- 7.1.2. SMEs
- 7.2. Market Analysis, Insights and Forecast - by Types
- 7.2.1. Bank Transfer
- 7.2.2. Money Transfer Operators
- 7.2.3. Online Platforms
- 7.2.4. Others
- 7.1. Market Analysis, Insights and Forecast - by Application
- 8. Europe B2B Remittances Analysis, Insights and Forecast, 2019-2031
- 8.1. Market Analysis, Insights and Forecast - by Application
- 8.1.1. Large Corporation
- 8.1.2. SMEs
- 8.2. Market Analysis, Insights and Forecast - by Types
- 8.2.1. Bank Transfer
- 8.2.2. Money Transfer Operators
- 8.2.3. Online Platforms
- 8.2.4. Others
- 8.1. Market Analysis, Insights and Forecast - by Application
- 9. Middle East & Africa B2B Remittances Analysis, Insights and Forecast, 2019-2031
- 9.1. Market Analysis, Insights and Forecast - by Application
- 9.1.1. Large Corporation
- 9.1.2. SMEs
- 9.2. Market Analysis, Insights and Forecast - by Types
- 9.2.1. Bank Transfer
- 9.2.2. Money Transfer Operators
- 9.2.3. Online Platforms
- 9.2.4. Others
- 9.1. Market Analysis, Insights and Forecast - by Application
- 10. Asia Pacific B2B Remittances Analysis, Insights and Forecast, 2019-2031
- 10.1. Market Analysis, Insights and Forecast - by Application
- 10.1.1. Large Corporation
- 10.1.2. SMEs
- 10.2. Market Analysis, Insights and Forecast - by Types
- 10.2.1. Bank Transfer
- 10.2.2. Money Transfer Operators
- 10.2.3. Online Platforms
- 10.2.4. Others
- 10.1. Market Analysis, Insights and Forecast - by Application
- 11. Competitive Analysis
- 11.1. Global Market Share Analysis 2024
- 11.2. Company Profiles
- 11.2.1 Azimo
- 11.2.1.1. Overview
- 11.2.1.2. Products
- 11.2.1.3. SWOT Analysis
- 11.2.1.4. Recent Developments
- 11.2.1.5. Financials (Based on Availability)
- 11.2.2 Digital Wallet Corporation
- 11.2.2.1. Overview
- 11.2.2.2. Products
- 11.2.2.3. SWOT Analysis
- 11.2.2.4. Recent Developments
- 11.2.2.5. Financials (Based on Availability)
- 11.2.3 MoneyGram
- 11.2.3.1. Overview
- 11.2.3.2. Products
- 11.2.3.3. SWOT Analysis
- 11.2.3.4. Recent Developments
- 11.2.3.5. Financials (Based on Availability)
- 11.2.4 Nium Pte. Ltd.
- 11.2.4.1. Overview
- 11.2.4.2. Products
- 11.2.4.3. SWOT Analysis
- 11.2.4.4. Recent Developments
- 11.2.4.5. Financials (Based on Availability)
- 11.2.5 PayPal Holdings Inc
- 11.2.5.1. Overview
- 11.2.5.2. Products
- 11.2.5.3. SWOT Analysis
- 11.2.5.4. Recent Developments
- 11.2.5.5. Financials (Based on Availability)
- 11.2.6 Remitly Inc.
- 11.2.6.1. Overview
- 11.2.6.2. Products
- 11.2.6.3. SWOT Analysis
- 11.2.6.4. Recent Developments
- 11.2.6.5. Financials (Based on Availability)
- 11.2.7 Ria Financial
- 11.2.7.1. Overview
- 11.2.7.2. Products
- 11.2.7.3. SWOT Analysis
- 11.2.7.4. Recent Developments
- 11.2.7.5. Financials (Based on Availability)
- 11.2.8 Ripple
- 11.2.8.1. Overview
- 11.2.8.2. Products
- 11.2.8.3. SWOT Analysis
- 11.2.8.4. Recent Developments
- 11.2.8.5. Financials (Based on Availability)
- 11.2.9 TransferGo
- 11.2.9.1. Overview
- 11.2.9.2. Products
- 11.2.9.3. SWOT Analysis
- 11.2.9.4. Recent Developments
- 11.2.9.5. Financials (Based on Availability)
- 11.2.10 Convera
- 11.2.10.1. Overview
- 11.2.10.2. Products
- 11.2.10.3. SWOT Analysis
- 11.2.10.4. Recent Developments
- 11.2.10.5. Financials (Based on Availability)
- 11.2.11 Western Union
- 11.2.11.1. Overview
- 11.2.11.2. Products
- 11.2.11.3. SWOT Analysis
- 11.2.11.4. Recent Developments
- 11.2.11.5. Financials (Based on Availability)
- 11.2.12 Wise
- 11.2.12.1. Overview
- 11.2.12.2. Products
- 11.2.12.3. SWOT Analysis
- 11.2.12.4. Recent Developments
- 11.2.12.5. Financials (Based on Availability)
- 11.2.13 WorldRemit
- 11.2.13.1. Overview
- 11.2.13.2. Products
- 11.2.13.3. SWOT Analysis
- 11.2.13.4. Recent Developments
- 11.2.13.5. Financials (Based on Availability)
- 11.2.14 American Express
- 11.2.14.1. Overview
- 11.2.14.2. Products
- 11.2.14.3. SWOT Analysis
- 11.2.14.4. Recent Developments
- 11.2.14.5. Financials (Based on Availability)
- 11.2.15 JP Morgan
- 11.2.15.1. Overview
- 11.2.15.2. Products
- 11.2.15.3. SWOT Analysis
- 11.2.15.4. Recent Developments
- 11.2.15.5. Financials (Based on Availability)
- 11.2.16 Visa Inc.
- 11.2.16.1. Overview
- 11.2.16.2. Products
- 11.2.16.3. SWOT Analysis
- 11.2.16.4. Recent Developments
- 11.2.16.5. Financials (Based on Availability)
- 11.2.17 Mastercard
- 11.2.17.1. Overview
- 11.2.17.2. Products
- 11.2.17.3. SWOT Analysis
- 11.2.17.4. Recent Developments
- 11.2.17.5. Financials (Based on Availability)
- 11.2.18 Stripe
- 11.2.18.1. Overview
- 11.2.18.2. Products
- 11.2.18.3. SWOT Analysis
- 11.2.18.4. Recent Developments
- 11.2.18.5. Financials (Based on Availability)
- 11.2.19 Paystand
- 11.2.19.1. Overview
- 11.2.19.2. Products
- 11.2.19.3. SWOT Analysis
- 11.2.19.4. Recent Developments
- 11.2.19.5. Financials (Based on Availability)
- 11.2.20 Grab Inc.
- 11.2.20.1. Overview
- 11.2.20.2. Products
- 11.2.20.3. SWOT Analysis
- 11.2.20.4. Recent Developments
- 11.2.20.5. Financials (Based on Availability)
- 11.2.21 Gcash
- 11.2.21.1. Overview
- 11.2.21.2. Products
- 11.2.21.3. SWOT Analysis
- 11.2.21.4. Recent Developments
- 11.2.21.5. Financials (Based on Availability)
- 11.2.22 TrueMoney Co.Ltd
- 11.2.22.1. Overview
- 11.2.22.2. Products
- 11.2.22.3. SWOT Analysis
- 11.2.22.4. Recent Developments
- 11.2.22.5. Financials (Based on Availability)
- 11.2.1 Azimo
List of Figures
- Figure 1: Global B2B Remittances Revenue Breakdown (million, %) by Region 2024 & 2032
- Figure 2: North America B2B Remittances Revenue (million), by Application 2024 & 2032
- Figure 3: North America B2B Remittances Revenue Share (%), by Application 2024 & 2032
- Figure 4: North America B2B Remittances Revenue (million), by Types 2024 & 2032
- Figure 5: North America B2B Remittances Revenue Share (%), by Types 2024 & 2032
- Figure 6: North America B2B Remittances Revenue (million), by Country 2024 & 2032
- Figure 7: North America B2B Remittances Revenue Share (%), by Country 2024 & 2032
- Figure 8: South America B2B Remittances Revenue (million), by Application 2024 & 2032
- Figure 9: South America B2B Remittances Revenue Share (%), by Application 2024 & 2032
- Figure 10: South America B2B Remittances Revenue (million), by Types 2024 & 2032
- Figure 11: South America B2B Remittances Revenue Share (%), by Types 2024 & 2032
- Figure 12: South America B2B Remittances Revenue (million), by Country 2024 & 2032
- Figure 13: South America B2B Remittances Revenue Share (%), by Country 2024 & 2032
- Figure 14: Europe B2B Remittances Revenue (million), by Application 2024 & 2032
- Figure 15: Europe B2B Remittances Revenue Share (%), by Application 2024 & 2032
- Figure 16: Europe B2B Remittances Revenue (million), by Types 2024 & 2032
- Figure 17: Europe B2B Remittances Revenue Share (%), by Types 2024 & 2032
- Figure 18: Europe B2B Remittances Revenue (million), by Country 2024 & 2032
- Figure 19: Europe B2B Remittances Revenue Share (%), by Country 2024 & 2032
- Figure 20: Middle East & Africa B2B Remittances Revenue (million), by Application 2024 & 2032
- Figure 21: Middle East & Africa B2B Remittances Revenue Share (%), by Application 2024 & 2032
- Figure 22: Middle East & Africa B2B Remittances Revenue (million), by Types 2024 & 2032
- Figure 23: Middle East & Africa B2B Remittances Revenue Share (%), by Types 2024 & 2032
- Figure 24: Middle East & Africa B2B Remittances Revenue (million), by Country 2024 & 2032
- Figure 25: Middle East & Africa B2B Remittances Revenue Share (%), by Country 2024 & 2032
- Figure 26: Asia Pacific B2B Remittances Revenue (million), by Application 2024 & 2032
- Figure 27: Asia Pacific B2B Remittances Revenue Share (%), by Application 2024 & 2032
- Figure 28: Asia Pacific B2B Remittances Revenue (million), by Types 2024 & 2032
- Figure 29: Asia Pacific B2B Remittances Revenue Share (%), by Types 2024 & 2032
- Figure 30: Asia Pacific B2B Remittances Revenue (million), by Country 2024 & 2032
- Figure 31: Asia Pacific B2B Remittances Revenue Share (%), by Country 2024 & 2032
List of Tables
- Table 1: Global B2B Remittances Revenue million Forecast, by Region 2019 & 2032
- Table 2: Global B2B Remittances Revenue million Forecast, by Application 2019 & 2032
- Table 3: Global B2B Remittances Revenue million Forecast, by Types 2019 & 2032
- Table 4: Global B2B Remittances Revenue million Forecast, by Region 2019 & 2032
- Table 5: Global B2B Remittances Revenue million Forecast, by Application 2019 & 2032
- Table 6: Global B2B Remittances Revenue million Forecast, by Types 2019 & 2032
- Table 7: Global B2B Remittances Revenue million Forecast, by Country 2019 & 2032
- Table 8: United States B2B Remittances Revenue (million) Forecast, by Application 2019 & 2032
- Table 9: Canada B2B Remittances Revenue (million) Forecast, by Application 2019 & 2032
- Table 10: Mexico B2B Remittances Revenue (million) Forecast, by Application 2019 & 2032
- Table 11: Global B2B Remittances Revenue million Forecast, by Application 2019 & 2032
- Table 12: Global B2B Remittances Revenue million Forecast, by Types 2019 & 2032
- Table 13: Global B2B Remittances Revenue million Forecast, by Country 2019 & 2032
- Table 14: Brazil B2B Remittances Revenue (million) Forecast, by Application 2019 & 2032
- Table 15: Argentina B2B Remittances Revenue (million) Forecast, by Application 2019 & 2032
- Table 16: Rest of South America B2B Remittances Revenue (million) Forecast, by Application 2019 & 2032
- Table 17: Global B2B Remittances Revenue million Forecast, by Application 2019 & 2032
- Table 18: Global B2B Remittances Revenue million Forecast, by Types 2019 & 2032
- Table 19: Global B2B Remittances Revenue million Forecast, by Country 2019 & 2032
- Table 20: United Kingdom B2B Remittances Revenue (million) Forecast, by Application 2019 & 2032
- Table 21: Germany B2B Remittances Revenue (million) Forecast, by Application 2019 & 2032
- Table 22: France B2B Remittances Revenue (million) Forecast, by Application 2019 & 2032
- Table 23: Italy B2B Remittances Revenue (million) Forecast, by Application 2019 & 2032
- Table 24: Spain B2B Remittances Revenue (million) Forecast, by Application 2019 & 2032
- Table 25: Russia B2B Remittances Revenue (million) Forecast, by Application 2019 & 2032
- Table 26: Benelux B2B Remittances Revenue (million) Forecast, by Application 2019 & 2032
- Table 27: Nordics B2B Remittances Revenue (million) Forecast, by Application 2019 & 2032
- Table 28: Rest of Europe B2B Remittances Revenue (million) Forecast, by Application 2019 & 2032
- Table 29: Global B2B Remittances Revenue million Forecast, by Application 2019 & 2032
- Table 30: Global B2B Remittances Revenue million Forecast, by Types 2019 & 2032
- Table 31: Global B2B Remittances Revenue million Forecast, by Country 2019 & 2032
- Table 32: Turkey B2B Remittances Revenue (million) Forecast, by Application 2019 & 2032
- Table 33: Israel B2B Remittances Revenue (million) Forecast, by Application 2019 & 2032
- Table 34: GCC B2B Remittances Revenue (million) Forecast, by Application 2019 & 2032
- Table 35: North Africa B2B Remittances Revenue (million) Forecast, by Application 2019 & 2032
- Table 36: South Africa B2B Remittances Revenue (million) Forecast, by Application 2019 & 2032
- Table 37: Rest of Middle East & Africa B2B Remittances Revenue (million) Forecast, by Application 2019 & 2032
- Table 38: Global B2B Remittances Revenue million Forecast, by Application 2019 & 2032
- Table 39: Global B2B Remittances Revenue million Forecast, by Types 2019 & 2032
- Table 40: Global B2B Remittances Revenue million Forecast, by Country 2019 & 2032
- Table 41: China B2B Remittances Revenue (million) Forecast, by Application 2019 & 2032
- Table 42: India B2B Remittances Revenue (million) Forecast, by Application 2019 & 2032
- Table 43: Japan B2B Remittances Revenue (million) Forecast, by Application 2019 & 2032
- Table 44: South Korea B2B Remittances Revenue (million) Forecast, by Application 2019 & 2032
- Table 45: ASEAN B2B Remittances Revenue (million) Forecast, by Application 2019 & 2032
- Table 46: Oceania B2B Remittances Revenue (million) Forecast, by Application 2019 & 2032
- Table 47: Rest of Asia Pacific B2B Remittances Revenue (million) Forecast, by Application 2019 & 2032
Frequently Asked Questions
1. What is the projected Compound Annual Growth Rate (CAGR) of the B2B Remittances?
The projected CAGR is approximately 5.2%.
2. Which companies are prominent players in the B2B Remittances?
Key companies in the market include Azimo, Digital Wallet Corporation, MoneyGram, Nium Pte. Ltd., PayPal Holdings Inc, Remitly Inc., Ria Financial, Ripple, TransferGo, Convera, Western Union, Wise, WorldRemit, American Express, JP Morgan, Visa Inc., Mastercard, Stripe, Paystand, Grab Inc., Gcash, TrueMoney Co.Ltd.
3. What are the main segments of the B2B Remittances?
The market segments include Application, Types.
4. Can you provide details about the market size?
The market size is estimated to be USD 84690 million as of 2022.
5. What are some drivers contributing to market growth?
N/A
6. What are the notable trends driving market growth?
N/A
7. Are there any restraints impacting market growth?
N/A
8. Can you provide examples of recent developments in the market?
N/A
9. What pricing options are available for accessing the report?
Pricing options include single-user, multi-user, and enterprise licenses priced at USD 4900.00, USD 7350.00, and USD 9800.00 respectively.
10. Is the market size provided in terms of value or volume?
The market size is provided in terms of value, measured in million.
11. Are there any specific market keywords associated with the report?
Yes, the market keyword associated with the report is "B2B Remittances," which aids in identifying and referencing the specific market segment covered.
12. How do I determine which pricing option suits my needs best?
The pricing options vary based on user requirements and access needs. Individual users may opt for single-user licenses, while businesses requiring broader access may choose multi-user or enterprise licenses for cost-effective access to the report.
13. Are there any additional resources or data provided in the B2B Remittances report?
While the report offers comprehensive insights, it's advisable to review the specific contents or supplementary materials provided to ascertain if additional resources or data are available.
14. How can I stay updated on further developments or reports in the B2B Remittances?
To stay informed about further developments, trends, and reports in the B2B Remittances, consider subscribing to industry newsletters, following relevant companies and organizations, or regularly checking reputable industry news sources and publications.
Methodology
Step 1 - Identification of Relevant Samples Size from Population Database


Step 2 - Approaches for Defining Global Market Size (Value, Volume* & Price*)

Note*: In applicable scenarios
Step 3 - Data Sources
Primary Research
- Web Analytics
- Survey Reports
- Research Institute
- Latest Research Reports
- Opinion Leaders
Secondary Research
- Annual Reports
- White Paper
- Latest Press Release
- Industry Association
- Paid Database
- Investor Presentations

Step 4 - Data Triangulation
Involves using different sources of information in order to increase the validity of a study
These sources are likely to be stakeholders in a program - participants, other researchers, program staff, other community members, and so on.
Then we put all data in single framework & apply various statistical tools to find out the dynamic on the market.
During the analysis stage, feedback from the stakeholder groups would be compared to determine areas of agreement as well as areas of divergence


