
Key Insights
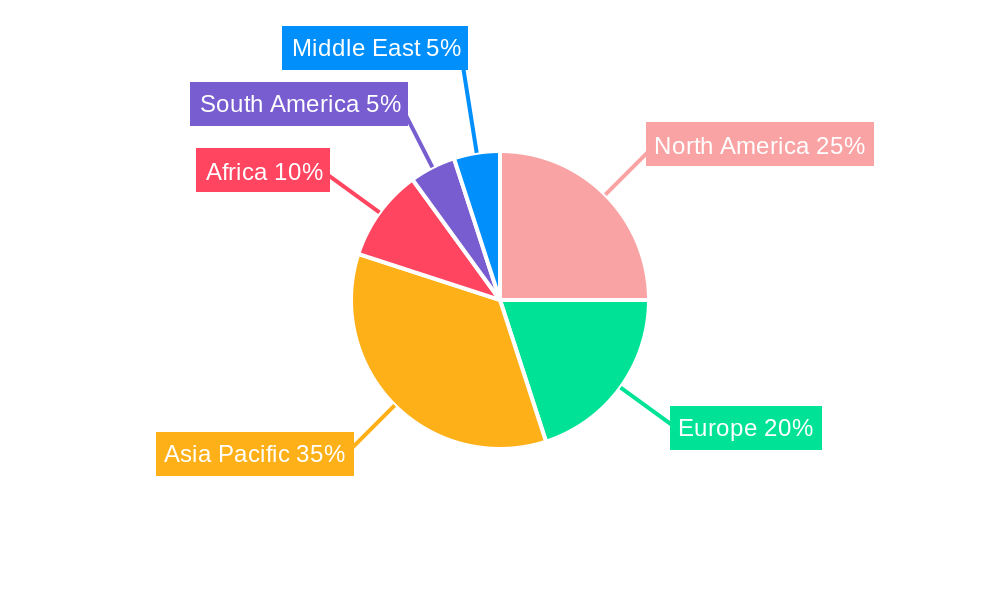
The Azotobacter market, exhibiting a robust CAGR of 9.02%, presents a significant opportunity for growth in the agricultural sector. Driven by increasing demand for sustainable and eco-friendly agricultural practices, the market is witnessing a surge in the adoption of biofertilizers like Azotobacter. Farmers are increasingly seeking alternatives to chemical fertilizers to enhance soil health, improve crop yields, and reduce environmental impact. This shift towards sustainable agriculture is a major catalyst for market expansion. The market is segmented by crop type (cash crops, horticultural crops, row crops), region (Africa, Asia-Pacific, Europe, Middle East, North America, South America), and specific countries within each region. The high concentration of agricultural activities in regions like Asia-Pacific and North America contributes significantly to the market's size. Furthermore, government initiatives promoting sustainable agriculture and research and development efforts focused on enhancing Azotobacter's efficacy further bolster market growth.
However, challenges remain. The relatively high cost of Azotobacter compared to chemical fertilizers might restrain widespread adoption, particularly among smallholder farmers. Furthermore, inconsistent product quality and a lack of awareness about the benefits of biofertilizers among farmers in certain regions pose obstacles to market penetration. Nevertheless, technological advancements aimed at improving Azotobacter production and enhancing its effectiveness, coupled with increased awareness campaigns, are expected to mitigate these challenges and drive future market growth. The presence of established players such as Ezzy Bioscience Pvt Ltd, Gujarat State Fertilizers & Chemicals Ltd, and others indicates a competitive yet dynamic market landscape. The forecast period of 2025-2033 suggests substantial expansion opportunities, particularly in developing economies with a burgeoning agricultural sector. This growth will likely be fueled by increased investment in agricultural research, favorable government policies, and rising consumer demand for organically produced food.
Azotobacter Market: A Comprehensive Analysis (2019-2033)
This in-depth report provides a comprehensive analysis of the Azotobacter market, encompassing market dynamics, growth trends, regional performance, key players, and future outlook. The study period covers 2019-2033, with 2025 as the base year and a forecast period of 2025-2033. This report is essential for industry professionals, investors, and researchers seeking a detailed understanding of this dynamic market.
Azotobacter Market Dynamics & Structure
The Azotobacter market, a segment of the larger biofertilizer market, is characterized by moderate concentration with several key players vying for market share. Technological innovation, particularly in enhancing Azotobacter strain efficacy and delivery systems, is a significant driver. Stringent regulatory frameworks governing biofertilizer use influence market growth, alongside the presence of competitive chemical fertilizer substitutes. End-user demographics, primarily farmers across various crop types, heavily shape demand. M&A activity within the sector remains relatively low, with xx deals recorded during the historical period (2019-2024), indicating opportunities for consolidation.
- Market Concentration: Moderately fragmented, with top 5 players holding approximately xx% market share (2025).
- Innovation Drivers: Improved strain development, enhanced formulation technologies, cost-effective production.
- Regulatory Landscape: Varies by region, impacting product registration and market access.
- Competitive Substitutes: Chemical fertilizers pose a significant competitive threat.
- End-User Demographics: Primarily small to medium-scale farmers across diverse agricultural settings.
- M&A Activity: Low to moderate during 2019-2024, with potential for increased consolidation in the forecast period.
Azotobacter Market Growth Trends & Insights
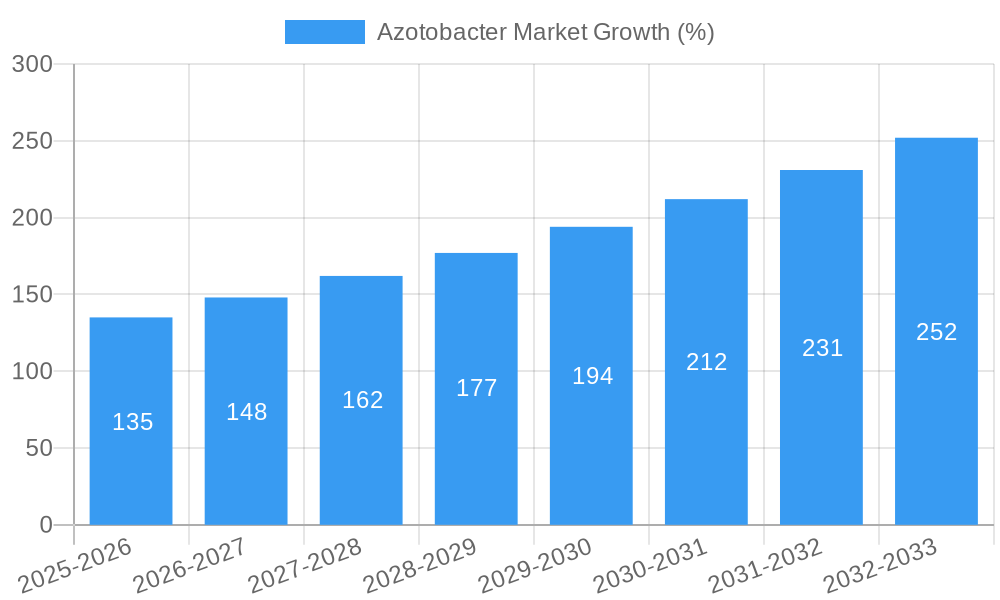
The Azotobacter market experienced steady growth during the historical period (2019-2024), driven by increasing awareness of sustainable agriculture practices and growing concerns about environmental impacts of chemical fertilizers. The market size reached xx million in 2024 and is projected to reach xx million by 2033, exhibiting a CAGR of xx% during the forecast period (2025-2033). Adoption rates are gradually increasing, particularly in regions with favorable government policies supporting biofertilizer usage. Technological disruptions, such as the development of enhanced Azotobacter strains with superior nitrogen fixation capabilities, are fueling market expansion. Consumer behavior shifts towards environmentally friendly agricultural practices further contribute to market growth. Market penetration remains relatively low, presenting significant growth opportunities.
Dominant Regions, Countries, or Segments in Azotobacter Market
The Asia-Pacific region, particularly India, dominates the Azotobacter market, driven by large-scale agricultural activities, favorable government initiatives promoting sustainable agriculture, and a substantial farmer base. India’s robust market is a significant contributor, followed by China and other Southeast Asian countries. Within crop types, Row Crops demonstrates the largest market share, followed by Horticultural Crops and Cash Crops.
- Key Drivers in Asia-Pacific (especially India): Large agricultural land area, government support for biofertilizers, increasing farmer awareness.
- Dominance Factors: High demand for nitrogen-fixing biofertilizers, favorable climate conditions, and government subsidies.
- Growth Potential: Significant untapped potential exists in other regions, particularly Africa and South America, as awareness grows and sustainable agriculture practices are adopted.
Azotobacter Market Product Landscape
The Azotobacter market offers a range of products, including liquid and powder formulations. Recent innovations focus on enhancing the shelf life, efficacy, and ease of application. These improvements leverage advancements in formulation technologies and strain selection, resulting in superior nitrogen-fixing capabilities and increased crop yields. Unique selling propositions center on environmental friendliness, cost-effectiveness compared to chemical fertilizers, and improved soil health.
Key Drivers, Barriers & Challenges in Azotobacter Market
Key Drivers:
- Growing demand for sustainable agricultural practices
- Increasing awareness of environmental concerns related to chemical fertilizers
- Government initiatives and subsidies promoting biofertilizer use
- Technological advancements leading to improved product efficacy.
Key Challenges:
- Competition from established chemical fertilizer industry
- Relatively high production costs compared to some chemical fertilizers
- Limited awareness among farmers in certain regions
- Varied regulatory frameworks across different countries.
Emerging Opportunities in Azotobacter Market
Emerging opportunities lie in untapped markets, particularly in Africa and South America. Innovative applications of Azotobacter, such as integration with other biofertilizers or use in specialized crops, offer significant potential. Evolving consumer preferences towards organic and sustainable products drive increased demand.
Growth Accelerators in the Azotobacter Market Industry
Technological breakthroughs in strain development and formulation are key growth accelerators. Strategic partnerships between biofertilizer companies and agricultural input suppliers enhance market penetration. Expanding into new geographic markets and focusing on effective farmer outreach programs are vital for long-term market growth.
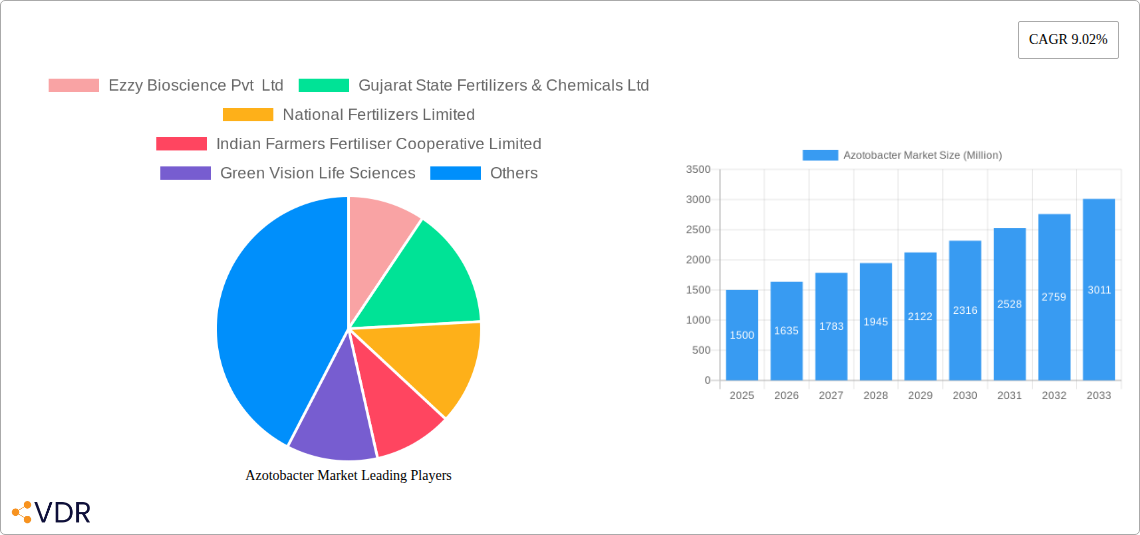
Key Players Shaping the Azotobacter Market Market
- Ezzy Bioscience Pvt Ltd
- Gujarat State Fertilizers & Chemicals Ltd
- National Fertilizers Limited
- Indian Farmers Fertiliser Cooperative Limited
- Green Vision Life Sciences
- Samriddhi Crops India Pvt Ltd
- Jaipur Bio Fertilizers
- IPL Biologicals Limited
- Indogulf BioAg LLC (Biotech Division of Indogulf Company)
- T Stanes and Company Limite
Notable Milestones in Azotobacter Market Sector
- 2022: Launch of a new, highly efficient Azotobacter strain by Ezzy Bioscience Pvt Ltd.
- 2023: Gujarat State Fertilizers & Chemicals Ltd partners with a research institution to develop advanced Azotobacter formulations.
- 2024: Government of India announces increased subsidies for biofertilizers, including Azotobacter-based products.
In-Depth Azotobacter Market Market Outlook
The Azotobacter market exhibits significant long-term growth potential, driven by the increasing global demand for sustainable agricultural solutions and the rising awareness of environmental concerns related to chemical fertilizers. Strategic partnerships, technological advancements, and government support will further propel market growth. Untapped opportunities exist in emerging economies and specialized crop applications, offering ample scope for expansion and innovation within the sector.
Azotobacter Market Segmentation
- 1. Production Analysis
- 2. Consumption Analysis
- 3. Import Market Analysis (Value & Volume)
- 4. Export Market Analysis (Value & Volume)
- 5. Price Trend Analysis
Azotobacter Market Segmentation By Geography
-
1. North America
- 1.1. United States
- 1.2. Canada
- 1.3. Mexico
-
2. South America
- 2.1. Brazil
- 2.2. Argentina
- 2.3. Rest of South America
-
3. Europe
- 3.1. United Kingdom
- 3.2. Germany
- 3.3. France
- 3.4. Italy
- 3.5. Spain
- 3.6. Russia
- 3.7. Benelux
- 3.8. Nordics
- 3.9. Rest of Europe
-
4. Middle East & Africa
- 4.1. Turkey
- 4.2. Israel
- 4.3. GCC
- 4.4. North Africa
- 4.5. South Africa
- 4.6. Rest of Middle East & Africa
-
5. Asia Pacific
- 5.1. China
- 5.2. India
- 5.3. Japan
- 5.4. South Korea
- 5.5. ASEAN
- 5.6. Oceania
- 5.7. Rest of Asia Pacific
Azotobacter Market REPORT HIGHLIGHTS
| Aspects | Details |
|---|---|
| Study Period | 2019-2033 |
| Base Year | 2024 |
| Estimated Year | 2025 |
| Forecast Period | 2025-2033 |
| Historical Period | 2019-2024 |
| Growth Rate | CAGR of 9.02% from 2019-2033 |
| Segmentation |
|
Table of Contents
- 1. Introduction
- 1.1. Research Scope
- 1.2. Market Segmentation
- 1.3. Research Methodology
- 1.4. Definitions and Assumptions
- 2. Executive Summary
- 2.1. Introduction
- 3. Market Dynamics
- 3.1. Introduction
- 3.2. Market Drivers
- 3.2.1. Need for Custom Product Development; Use of CROs for Regulatory Services
- 3.3. Market Restrains
- 3.3.1. Data and Cyber Security Concerns; Lack of Experts and Professionals in this Industry
- 3.4. Market Trends
- 3.4.1. Row Crops is the largest Crop Type
- 4. Market Factor Analysis
- 4.1. Porters Five Forces
- 4.2. Supply/Value Chain
- 4.3. PESTEL analysis
- 4.4. Market Entropy
- 4.5. Patent/Trademark Analysis
- 5. Global Azotobacter Market Analysis, Insights and Forecast, 2019-2031
- 5.1. Market Analysis, Insights and Forecast - by Production Analysis
- 5.2. Market Analysis, Insights and Forecast - by Consumption Analysis
- 5.3. Market Analysis, Insights and Forecast - by Import Market Analysis (Value & Volume)
- 5.4. Market Analysis, Insights and Forecast - by Export Market Analysis (Value & Volume)
- 5.5. Market Analysis, Insights and Forecast - by Price Trend Analysis
- 5.6. Market Analysis, Insights and Forecast - by Region
- 5.6.1. North America
- 5.6.2. South America
- 5.6.3. Europe
- 5.6.4. Middle East & Africa
- 5.6.5. Asia Pacific
- 5.1. Market Analysis, Insights and Forecast - by Production Analysis
- 6. North America Azotobacter Market Analysis, Insights and Forecast, 2019-2031
- 6.1. Market Analysis, Insights and Forecast - by Production Analysis
- 6.2. Market Analysis, Insights and Forecast - by Consumption Analysis
- 6.3. Market Analysis, Insights and Forecast - by Import Market Analysis (Value & Volume)
- 6.4. Market Analysis, Insights and Forecast - by Export Market Analysis (Value & Volume)
- 6.5. Market Analysis, Insights and Forecast - by Price Trend Analysis
- 6.1. Market Analysis, Insights and Forecast - by Production Analysis
- 7. South America Azotobacter Market Analysis, Insights and Forecast, 2019-2031
- 7.1. Market Analysis, Insights and Forecast - by Production Analysis
- 7.2. Market Analysis, Insights and Forecast - by Consumption Analysis
- 7.3. Market Analysis, Insights and Forecast - by Import Market Analysis (Value & Volume)
- 7.4. Market Analysis, Insights and Forecast - by Export Market Analysis (Value & Volume)
- 7.5. Market Analysis, Insights and Forecast - by Price Trend Analysis
- 7.1. Market Analysis, Insights and Forecast - by Production Analysis
- 8. Europe Azotobacter Market Analysis, Insights and Forecast, 2019-2031
- 8.1. Market Analysis, Insights and Forecast - by Production Analysis
- 8.2. Market Analysis, Insights and Forecast - by Consumption Analysis
- 8.3. Market Analysis, Insights and Forecast - by Import Market Analysis (Value & Volume)
- 8.4. Market Analysis, Insights and Forecast - by Export Market Analysis (Value & Volume)
- 8.5. Market Analysis, Insights and Forecast - by Price Trend Analysis
- 8.1. Market Analysis, Insights and Forecast - by Production Analysis
- 9. Middle East & Africa Azotobacter Market Analysis, Insights and Forecast, 2019-2031
- 9.1. Market Analysis, Insights and Forecast - by Production Analysis
- 9.2. Market Analysis, Insights and Forecast - by Consumption Analysis
- 9.3. Market Analysis, Insights and Forecast - by Import Market Analysis (Value & Volume)
- 9.4. Market Analysis, Insights and Forecast - by Export Market Analysis (Value & Volume)
- 9.5. Market Analysis, Insights and Forecast - by Price Trend Analysis
- 9.1. Market Analysis, Insights and Forecast - by Production Analysis
- 10. Asia Pacific Azotobacter Market Analysis, Insights and Forecast, 2019-2031
- 10.1. Market Analysis, Insights and Forecast - by Production Analysis
- 10.2. Market Analysis, Insights and Forecast - by Consumption Analysis
- 10.3. Market Analysis, Insights and Forecast - by Import Market Analysis (Value & Volume)
- 10.4. Market Analysis, Insights and Forecast - by Export Market Analysis (Value & Volume)
- 10.5. Market Analysis, Insights and Forecast - by Price Trend Analysis
- 10.1. Market Analysis, Insights and Forecast - by Production Analysis
- 11. North America Azotobacter Market Analysis, Insights and Forecast, 2019-2031
- 11.1. Market Analysis, Insights and Forecast - By Country/Sub-region
- 11.1.1 United States
- 11.1.2 Canada
- 11.1.3 Mexico
- 12. South America Azotobacter Market Analysis, Insights and Forecast, 2019-2031
- 12.1. Market Analysis, Insights and Forecast - By Country/Sub-region
- 12.1.1 Brazil
- 12.1.2 Argentina
- 12.1.3 Rest of South America
- 13. Asia Pacific Azotobacter Market Analysis, Insights and Forecast, 2019-2031
- 13.1. Market Analysis, Insights and Forecast - By Country/Sub-region
- 13.1.1 China
- 13.1.2 Japan
- 13.1.3 India
- 13.1.4 South Korea
- 13.1.5 Taiwan
- 13.1.6 Australia
- 13.1.7 Rest of Asia-Pacific
- 14. Europe Azotobacter Market Analysis, Insights and Forecast, 2019-2031
- 14.1. Market Analysis, Insights and Forecast - By Country/Sub-region
- 14.1.1 Germany
- 14.1.2 France
- 14.1.3 Italy
- 14.1.4 United Kingdom
- 14.1.5 Netherlands
- 14.1.6 Rest of Europe
- 15. MEA Azotobacter Market Analysis, Insights and Forecast, 2019-2031
- 15.1. Market Analysis, Insights and Forecast - By Country/Sub-region
- 15.1.1 Middle East
- 15.1.2 Africa
- 16. Competitive Analysis
- 16.1. Global Market Share Analysis 2024
- 16.2. Company Profiles
- 16.2.1 Ezzy Bioscience Pvt Ltd
- 16.2.1.1. Overview
- 16.2.1.2. Products
- 16.2.1.3. SWOT Analysis
- 16.2.1.4. Recent Developments
- 16.2.1.5. Financials (Based on Availability)
- 16.2.2 Gujarat State Fertilizers & Chemicals Ltd
- 16.2.2.1. Overview
- 16.2.2.2. Products
- 16.2.2.3. SWOT Analysis
- 16.2.2.4. Recent Developments
- 16.2.2.5. Financials (Based on Availability)
- 16.2.3 National Fertilizers Limited
- 16.2.3.1. Overview
- 16.2.3.2. Products
- 16.2.3.3. SWOT Analysis
- 16.2.3.4. Recent Developments
- 16.2.3.5. Financials (Based on Availability)
- 16.2.4 Indian Farmers Fertiliser Cooperative Limited
- 16.2.4.1. Overview
- 16.2.4.2. Products
- 16.2.4.3. SWOT Analysis
- 16.2.4.4. Recent Developments
- 16.2.4.5. Financials (Based on Availability)
- 16.2.5 Green Vision Life Sciences
- 16.2.5.1. Overview
- 16.2.5.2. Products
- 16.2.5.3. SWOT Analysis
- 16.2.5.4. Recent Developments
- 16.2.5.5. Financials (Based on Availability)
- 16.2.6 Samriddhi Crops India Pvt Ltd
- 16.2.6.1. Overview
- 16.2.6.2. Products
- 16.2.6.3. SWOT Analysis
- 16.2.6.4. Recent Developments
- 16.2.6.5. Financials (Based on Availability)
- 16.2.7 Jaipur Bio Fertilizers
- 16.2.7.1. Overview
- 16.2.7.2. Products
- 16.2.7.3. SWOT Analysis
- 16.2.7.4. Recent Developments
- 16.2.7.5. Financials (Based on Availability)
- 16.2.8 IPL Biologicals Limited
- 16.2.8.1. Overview
- 16.2.8.2. Products
- 16.2.8.3. SWOT Analysis
- 16.2.8.4. Recent Developments
- 16.2.8.5. Financials (Based on Availability)
- 16.2.9 Indogulf BioAg LLC (Biotech Division of Indogulf Company)
- 16.2.9.1. Overview
- 16.2.9.2. Products
- 16.2.9.3. SWOT Analysis
- 16.2.9.4. Recent Developments
- 16.2.9.5. Financials (Based on Availability)
- 16.2.10 T Stanes and Company Limite
- 16.2.10.1. Overview
- 16.2.10.2. Products
- 16.2.10.3. SWOT Analysis
- 16.2.10.4. Recent Developments
- 16.2.10.5. Financials (Based on Availability)
- 16.2.1 Ezzy Bioscience Pvt Ltd
List of Figures
- Figure 1: Global Azotobacter Market Revenue Breakdown (Million, %) by Region 2024 & 2032
- Figure 2: North America Azotobacter Market Revenue (Million), by Country 2024 & 2032
- Figure 3: North America Azotobacter Market Revenue Share (%), by Country 2024 & 2032
- Figure 4: South America Azotobacter Market Revenue (Million), by Country 2024 & 2032
- Figure 5: South America Azotobacter Market Revenue Share (%), by Country 2024 & 2032
- Figure 6: Asia Pacific Azotobacter Market Revenue (Million), by Country 2024 & 2032
- Figure 7: Asia Pacific Azotobacter Market Revenue Share (%), by Country 2024 & 2032
- Figure 8: Europe Azotobacter Market Revenue (Million), by Country 2024 & 2032
- Figure 9: Europe Azotobacter Market Revenue Share (%), by Country 2024 & 2032
- Figure 10: MEA Azotobacter Market Revenue (Million), by Country 2024 & 2032
- Figure 11: MEA Azotobacter Market Revenue Share (%), by Country 2024 & 2032
- Figure 12: North America Azotobacter Market Revenue (Million), by Production Analysis 2024 & 2032
- Figure 13: North America Azotobacter Market Revenue Share (%), by Production Analysis 2024 & 2032
- Figure 14: North America Azotobacter Market Revenue (Million), by Consumption Analysis 2024 & 2032
- Figure 15: North America Azotobacter Market Revenue Share (%), by Consumption Analysis 2024 & 2032
- Figure 16: North America Azotobacter Market Revenue (Million), by Import Market Analysis (Value & Volume) 2024 & 2032
- Figure 17: North America Azotobacter Market Revenue Share (%), by Import Market Analysis (Value & Volume) 2024 & 2032
- Figure 18: North America Azotobacter Market Revenue (Million), by Export Market Analysis (Value & Volume) 2024 & 2032
- Figure 19: North America Azotobacter Market Revenue Share (%), by Export Market Analysis (Value & Volume) 2024 & 2032
- Figure 20: North America Azotobacter Market Revenue (Million), by Price Trend Analysis 2024 & 2032
- Figure 21: North America Azotobacter Market Revenue Share (%), by Price Trend Analysis 2024 & 2032
- Figure 22: North America Azotobacter Market Revenue (Million), by Country 2024 & 2032
- Figure 23: North America Azotobacter Market Revenue Share (%), by Country 2024 & 2032
- Figure 24: South America Azotobacter Market Revenue (Million), by Production Analysis 2024 & 2032
- Figure 25: South America Azotobacter Market Revenue Share (%), by Production Analysis 2024 & 2032
- Figure 26: South America Azotobacter Market Revenue (Million), by Consumption Analysis 2024 & 2032
- Figure 27: South America Azotobacter Market Revenue Share (%), by Consumption Analysis 2024 & 2032
- Figure 28: South America Azotobacter Market Revenue (Million), by Import Market Analysis (Value & Volume) 2024 & 2032
- Figure 29: South America Azotobacter Market Revenue Share (%), by Import Market Analysis (Value & Volume) 2024 & 2032
- Figure 30: South America Azotobacter Market Revenue (Million), by Export Market Analysis (Value & Volume) 2024 & 2032
- Figure 31: South America Azotobacter Market Revenue Share (%), by Export Market Analysis (Value & Volume) 2024 & 2032
- Figure 32: South America Azotobacter Market Revenue (Million), by Price Trend Analysis 2024 & 2032
- Figure 33: South America Azotobacter Market Revenue Share (%), by Price Trend Analysis 2024 & 2032
- Figure 34: South America Azotobacter Market Revenue (Million), by Country 2024 & 2032
- Figure 35: South America Azotobacter Market Revenue Share (%), by Country 2024 & 2032
- Figure 36: Europe Azotobacter Market Revenue (Million), by Production Analysis 2024 & 2032
- Figure 37: Europe Azotobacter Market Revenue Share (%), by Production Analysis 2024 & 2032
- Figure 38: Europe Azotobacter Market Revenue (Million), by Consumption Analysis 2024 & 2032
- Figure 39: Europe Azotobacter Market Revenue Share (%), by Consumption Analysis 2024 & 2032
- Figure 40: Europe Azotobacter Market Revenue (Million), by Import Market Analysis (Value & Volume) 2024 & 2032
- Figure 41: Europe Azotobacter Market Revenue Share (%), by Import Market Analysis (Value & Volume) 2024 & 2032
- Figure 42: Europe Azotobacter Market Revenue (Million), by Export Market Analysis (Value & Volume) 2024 & 2032
- Figure 43: Europe Azotobacter Market Revenue Share (%), by Export Market Analysis (Value & Volume) 2024 & 2032
- Figure 44: Europe Azotobacter Market Revenue (Million), by Price Trend Analysis 2024 & 2032
- Figure 45: Europe Azotobacter Market Revenue Share (%), by Price Trend Analysis 2024 & 2032
- Figure 46: Europe Azotobacter Market Revenue (Million), by Country 2024 & 2032
- Figure 47: Europe Azotobacter Market Revenue Share (%), by Country 2024 & 2032
- Figure 48: Middle East & Africa Azotobacter Market Revenue (Million), by Production Analysis 2024 & 2032
- Figure 49: Middle East & Africa Azotobacter Market Revenue Share (%), by Production Analysis 2024 & 2032
- Figure 50: Middle East & Africa Azotobacter Market Revenue (Million), by Consumption Analysis 2024 & 2032
- Figure 51: Middle East & Africa Azotobacter Market Revenue Share (%), by Consumption Analysis 2024 & 2032
- Figure 52: Middle East & Africa Azotobacter Market Revenue (Million), by Import Market Analysis (Value & Volume) 2024 & 2032
- Figure 53: Middle East & Africa Azotobacter Market Revenue Share (%), by Import Market Analysis (Value & Volume) 2024 & 2032
- Figure 54: Middle East & Africa Azotobacter Market Revenue (Million), by Export Market Analysis (Value & Volume) 2024 & 2032
- Figure 55: Middle East & Africa Azotobacter Market Revenue Share (%), by Export Market Analysis (Value & Volume) 2024 & 2032
- Figure 56: Middle East & Africa Azotobacter Market Revenue (Million), by Price Trend Analysis 2024 & 2032
- Figure 57: Middle East & Africa Azotobacter Market Revenue Share (%), by Price Trend Analysis 2024 & 2032
- Figure 58: Middle East & Africa Azotobacter Market Revenue (Million), by Country 2024 & 2032
- Figure 59: Middle East & Africa Azotobacter Market Revenue Share (%), by Country 2024 & 2032
- Figure 60: Asia Pacific Azotobacter Market Revenue (Million), by Production Analysis 2024 & 2032
- Figure 61: Asia Pacific Azotobacter Market Revenue Share (%), by Production Analysis 2024 & 2032
- Figure 62: Asia Pacific Azotobacter Market Revenue (Million), by Consumption Analysis 2024 & 2032
- Figure 63: Asia Pacific Azotobacter Market Revenue Share (%), by Consumption Analysis 2024 & 2032
- Figure 64: Asia Pacific Azotobacter Market Revenue (Million), by Import Market Analysis (Value & Volume) 2024 & 2032
- Figure 65: Asia Pacific Azotobacter Market Revenue Share (%), by Import Market Analysis (Value & Volume) 2024 & 2032
- Figure 66: Asia Pacific Azotobacter Market Revenue (Million), by Export Market Analysis (Value & Volume) 2024 & 2032
- Figure 67: Asia Pacific Azotobacter Market Revenue Share (%), by Export Market Analysis (Value & Volume) 2024 & 2032
- Figure 68: Asia Pacific Azotobacter Market Revenue (Million), by Price Trend Analysis 2024 & 2032
- Figure 69: Asia Pacific Azotobacter Market Revenue Share (%), by Price Trend Analysis 2024 & 2032
- Figure 70: Asia Pacific Azotobacter Market Revenue (Million), by Country 2024 & 2032
- Figure 71: Asia Pacific Azotobacter Market Revenue Share (%), by Country 2024 & 2032
List of Tables
- Table 1: Global Azotobacter Market Revenue Million Forecast, by Region 2019 & 2032
- Table 2: Global Azotobacter Market Revenue Million Forecast, by Production Analysis 2019 & 2032
- Table 3: Global Azotobacter Market Revenue Million Forecast, by Consumption Analysis 2019 & 2032
- Table 4: Global Azotobacter Market Revenue Million Forecast, by Import Market Analysis (Value & Volume) 2019 & 2032
- Table 5: Global Azotobacter Market Revenue Million Forecast, by Export Market Analysis (Value & Volume) 2019 & 2032
- Table 6: Global Azotobacter Market Revenue Million Forecast, by Price Trend Analysis 2019 & 2032
- Table 7: Global Azotobacter Market Revenue Million Forecast, by Region 2019 & 2032
- Table 8: Global Azotobacter Market Revenue Million Forecast, by Country 2019 & 2032
- Table 9: United States Azotobacter Market Revenue (Million) Forecast, by Application 2019 & 2032
- Table 10: Canada Azotobacter Market Revenue (Million) Forecast, by Application 2019 & 2032
- Table 11: Mexico Azotobacter Market Revenue (Million) Forecast, by Application 2019 & 2032
- Table 12: Global Azotobacter Market Revenue Million Forecast, by Country 2019 & 2032
- Table 13: Brazil Azotobacter Market Revenue (Million) Forecast, by Application 2019 & 2032
- Table 14: Argentina Azotobacter Market Revenue (Million) Forecast, by Application 2019 & 2032
- Table 15: Rest of South America Azotobacter Market Revenue (Million) Forecast, by Application 2019 & 2032
- Table 16: Global Azotobacter Market Revenue Million Forecast, by Country 2019 & 2032
- Table 17: China Azotobacter Market Revenue (Million) Forecast, by Application 2019 & 2032
- Table 18: Japan Azotobacter Market Revenue (Million) Forecast, by Application 2019 & 2032
- Table 19: India Azotobacter Market Revenue (Million) Forecast, by Application 2019 & 2032
- Table 20: South Korea Azotobacter Market Revenue (Million) Forecast, by Application 2019 & 2032
- Table 21: Taiwan Azotobacter Market Revenue (Million) Forecast, by Application 2019 & 2032
- Table 22: Australia Azotobacter Market Revenue (Million) Forecast, by Application 2019 & 2032
- Table 23: Rest of Asia-Pacific Azotobacter Market Revenue (Million) Forecast, by Application 2019 & 2032
- Table 24: Global Azotobacter Market Revenue Million Forecast, by Country 2019 & 2032
- Table 25: Germany Azotobacter Market Revenue (Million) Forecast, by Application 2019 & 2032
- Table 26: France Azotobacter Market Revenue (Million) Forecast, by Application 2019 & 2032
- Table 27: Italy Azotobacter Market Revenue (Million) Forecast, by Application 2019 & 2032
- Table 28: United Kingdom Azotobacter Market Revenue (Million) Forecast, by Application 2019 & 2032
- Table 29: Netherlands Azotobacter Market Revenue (Million) Forecast, by Application 2019 & 2032
- Table 30: Rest of Europe Azotobacter Market Revenue (Million) Forecast, by Application 2019 & 2032
- Table 31: Global Azotobacter Market Revenue Million Forecast, by Country 2019 & 2032
- Table 32: Middle East Azotobacter Market Revenue (Million) Forecast, by Application 2019 & 2032
- Table 33: Africa Azotobacter Market Revenue (Million) Forecast, by Application 2019 & 2032
- Table 34: Global Azotobacter Market Revenue Million Forecast, by Production Analysis 2019 & 2032
- Table 35: Global Azotobacter Market Revenue Million Forecast, by Consumption Analysis 2019 & 2032
- Table 36: Global Azotobacter Market Revenue Million Forecast, by Import Market Analysis (Value & Volume) 2019 & 2032
- Table 37: Global Azotobacter Market Revenue Million Forecast, by Export Market Analysis (Value & Volume) 2019 & 2032
- Table 38: Global Azotobacter Market Revenue Million Forecast, by Price Trend Analysis 2019 & 2032
- Table 39: Global Azotobacter Market Revenue Million Forecast, by Country 2019 & 2032
- Table 40: United States Azotobacter Market Revenue (Million) Forecast, by Application 2019 & 2032
- Table 41: Canada Azotobacter Market Revenue (Million) Forecast, by Application 2019 & 2032
- Table 42: Mexico Azotobacter Market Revenue (Million) Forecast, by Application 2019 & 2032
- Table 43: Global Azotobacter Market Revenue Million Forecast, by Production Analysis 2019 & 2032
- Table 44: Global Azotobacter Market Revenue Million Forecast, by Consumption Analysis 2019 & 2032
- Table 45: Global Azotobacter Market Revenue Million Forecast, by Import Market Analysis (Value & Volume) 2019 & 2032
- Table 46: Global Azotobacter Market Revenue Million Forecast, by Export Market Analysis (Value & Volume) 2019 & 2032
- Table 47: Global Azotobacter Market Revenue Million Forecast, by Price Trend Analysis 2019 & 2032
- Table 48: Global Azotobacter Market Revenue Million Forecast, by Country 2019 & 2032
- Table 49: Brazil Azotobacter Market Revenue (Million) Forecast, by Application 2019 & 2032
- Table 50: Argentina Azotobacter Market Revenue (Million) Forecast, by Application 2019 & 2032
- Table 51: Rest of South America Azotobacter Market Revenue (Million) Forecast, by Application 2019 & 2032
- Table 52: Global Azotobacter Market Revenue Million Forecast, by Production Analysis 2019 & 2032
- Table 53: Global Azotobacter Market Revenue Million Forecast, by Consumption Analysis 2019 & 2032
- Table 54: Global Azotobacter Market Revenue Million Forecast, by Import Market Analysis (Value & Volume) 2019 & 2032
- Table 55: Global Azotobacter Market Revenue Million Forecast, by Export Market Analysis (Value & Volume) 2019 & 2032
- Table 56: Global Azotobacter Market Revenue Million Forecast, by Price Trend Analysis 2019 & 2032
- Table 57: Global Azotobacter Market Revenue Million Forecast, by Country 2019 & 2032
- Table 58: United Kingdom Azotobacter Market Revenue (Million) Forecast, by Application 2019 & 2032
- Table 59: Germany Azotobacter Market Revenue (Million) Forecast, by Application 2019 & 2032
- Table 60: France Azotobacter Market Revenue (Million) Forecast, by Application 2019 & 2032
- Table 61: Italy Azotobacter Market Revenue (Million) Forecast, by Application 2019 & 2032
- Table 62: Spain Azotobacter Market Revenue (Million) Forecast, by Application 2019 & 2032
- Table 63: Russia Azotobacter Market Revenue (Million) Forecast, by Application 2019 & 2032
- Table 64: Benelux Azotobacter Market Revenue (Million) Forecast, by Application 2019 & 2032
- Table 65: Nordics Azotobacter Market Revenue (Million) Forecast, by Application 2019 & 2032
- Table 66: Rest of Europe Azotobacter Market Revenue (Million) Forecast, by Application 2019 & 2032
- Table 67: Global Azotobacter Market Revenue Million Forecast, by Production Analysis 2019 & 2032
- Table 68: Global Azotobacter Market Revenue Million Forecast, by Consumption Analysis 2019 & 2032
- Table 69: Global Azotobacter Market Revenue Million Forecast, by Import Market Analysis (Value & Volume) 2019 & 2032
- Table 70: Global Azotobacter Market Revenue Million Forecast, by Export Market Analysis (Value & Volume) 2019 & 2032
- Table 71: Global Azotobacter Market Revenue Million Forecast, by Price Trend Analysis 2019 & 2032
- Table 72: Global Azotobacter Market Revenue Million Forecast, by Country 2019 & 2032
- Table 73: Turkey Azotobacter Market Revenue (Million) Forecast, by Application 2019 & 2032
- Table 74: Israel Azotobacter Market Revenue (Million) Forecast, by Application 2019 & 2032
- Table 75: GCC Azotobacter Market Revenue (Million) Forecast, by Application 2019 & 2032
- Table 76: North Africa Azotobacter Market Revenue (Million) Forecast, by Application 2019 & 2032
- Table 77: South Africa Azotobacter Market Revenue (Million) Forecast, by Application 2019 & 2032
- Table 78: Rest of Middle East & Africa Azotobacter Market Revenue (Million) Forecast, by Application 2019 & 2032
- Table 79: Global Azotobacter Market Revenue Million Forecast, by Production Analysis 2019 & 2032
- Table 80: Global Azotobacter Market Revenue Million Forecast, by Consumption Analysis 2019 & 2032
- Table 81: Global Azotobacter Market Revenue Million Forecast, by Import Market Analysis (Value & Volume) 2019 & 2032
- Table 82: Global Azotobacter Market Revenue Million Forecast, by Export Market Analysis (Value & Volume) 2019 & 2032
- Table 83: Global Azotobacter Market Revenue Million Forecast, by Price Trend Analysis 2019 & 2032
- Table 84: Global Azotobacter Market Revenue Million Forecast, by Country 2019 & 2032
- Table 85: China Azotobacter Market Revenue (Million) Forecast, by Application 2019 & 2032
- Table 86: India Azotobacter Market Revenue (Million) Forecast, by Application 2019 & 2032
- Table 87: Japan Azotobacter Market Revenue (Million) Forecast, by Application 2019 & 2032
- Table 88: South Korea Azotobacter Market Revenue (Million) Forecast, by Application 2019 & 2032
- Table 89: ASEAN Azotobacter Market Revenue (Million) Forecast, by Application 2019 & 2032
- Table 90: Oceania Azotobacter Market Revenue (Million) Forecast, by Application 2019 & 2032
- Table 91: Rest of Asia Pacific Azotobacter Market Revenue (Million) Forecast, by Application 2019 & 2032
Frequently Asked Questions
1. What is the projected Compound Annual Growth Rate (CAGR) of the Azotobacter Market?
The projected CAGR is approximately 9.02%.
2. Which companies are prominent players in the Azotobacter Market?
Key companies in the market include Ezzy Bioscience Pvt Ltd, Gujarat State Fertilizers & Chemicals Ltd, National Fertilizers Limited, Indian Farmers Fertiliser Cooperative Limited, Green Vision Life Sciences, Samriddhi Crops India Pvt Ltd, Jaipur Bio Fertilizers, IPL Biologicals Limited, Indogulf BioAg LLC (Biotech Division of Indogulf Company), T Stanes and Company Limite.
3. What are the main segments of the Azotobacter Market?
The market segments include Production Analysis, Consumption Analysis, Import Market Analysis (Value & Volume), Export Market Analysis (Value & Volume), Price Trend Analysis.
4. Can you provide details about the market size?
The market size is estimated to be USD XX Million as of 2022.
5. What are some drivers contributing to market growth?
Need for Custom Product Development; Use of CROs for Regulatory Services.
6. What are the notable trends driving market growth?
Row Crops is the largest Crop Type.
7. Are there any restraints impacting market growth?
Data and Cyber Security Concerns; Lack of Experts and Professionals in this Industry.
8. Can you provide examples of recent developments in the market?
N/A
9. What pricing options are available for accessing the report?
Pricing options include single-user, multi-user, and enterprise licenses priced at USD 3800, USD 4500, and USD 5800 respectively.
10. Is the market size provided in terms of value or volume?
The market size is provided in terms of value, measured in Million.
11. Are there any specific market keywords associated with the report?
Yes, the market keyword associated with the report is "Azotobacter Market," which aids in identifying and referencing the specific market segment covered.
12. How do I determine which pricing option suits my needs best?
The pricing options vary based on user requirements and access needs. Individual users may opt for single-user licenses, while businesses requiring broader access may choose multi-user or enterprise licenses for cost-effective access to the report.
13. Are there any additional resources or data provided in the Azotobacter Market report?
While the report offers comprehensive insights, it's advisable to review the specific contents or supplementary materials provided to ascertain if additional resources or data are available.
14. How can I stay updated on further developments or reports in the Azotobacter Market?
To stay informed about further developments, trends, and reports in the Azotobacter Market, consider subscribing to industry newsletters, following relevant companies and organizations, or regularly checking reputable industry news sources and publications.
Methodology
Step 1 - Identification of Relevant Samples Size from Population Database


Step 2 - Approaches for Defining Global Market Size (Value, Volume* & Price*)

Note*: In applicable scenarios
Step 3 - Data Sources
Primary Research
- Web Analytics
- Survey Reports
- Research Institute
- Latest Research Reports
- Opinion Leaders
Secondary Research
- Annual Reports
- White Paper
- Latest Press Release
- Industry Association
- Paid Database
- Investor Presentations

Step 4 - Data Triangulation
Involves using different sources of information in order to increase the validity of a study
These sources are likely to be stakeholders in a program - participants, other researchers, program staff, other community members, and so on.
Then we put all data in single framework & apply various statistical tools to find out the dynamic on the market.
During the analysis stage, feedback from the stakeholder groups would be compared to determine areas of agreement as well as areas of divergence


