
Key Insights
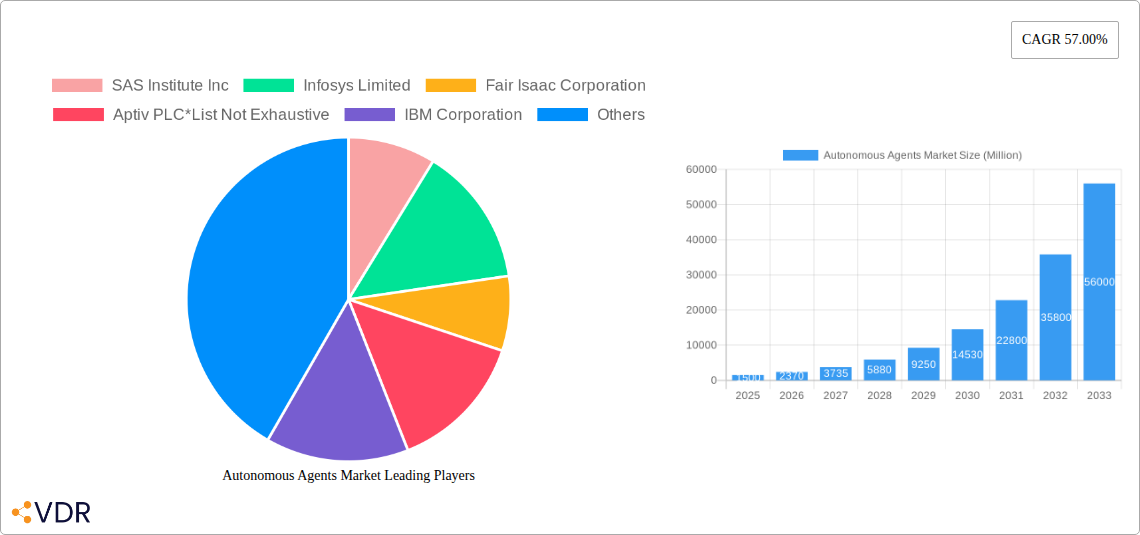
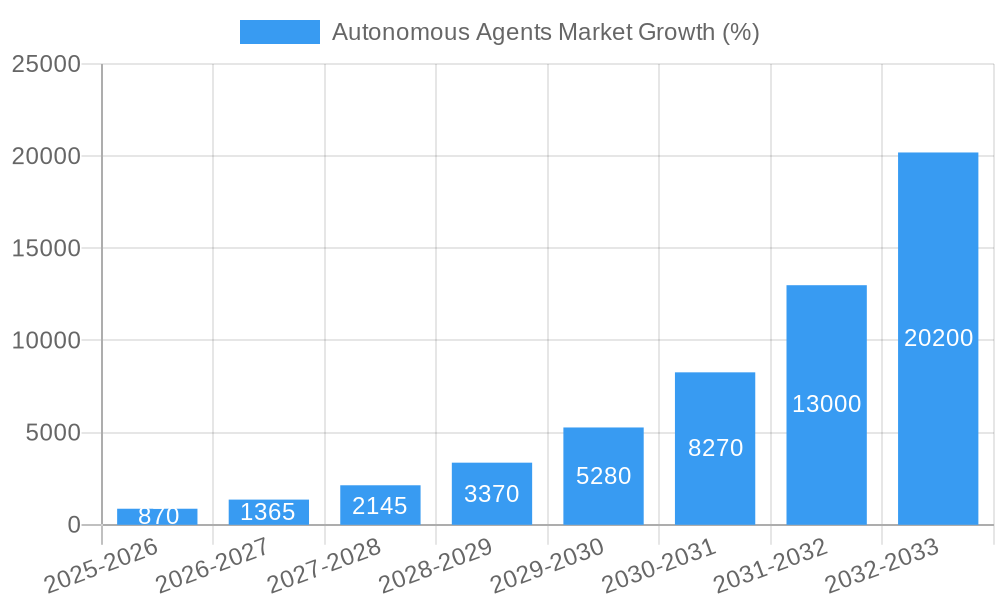
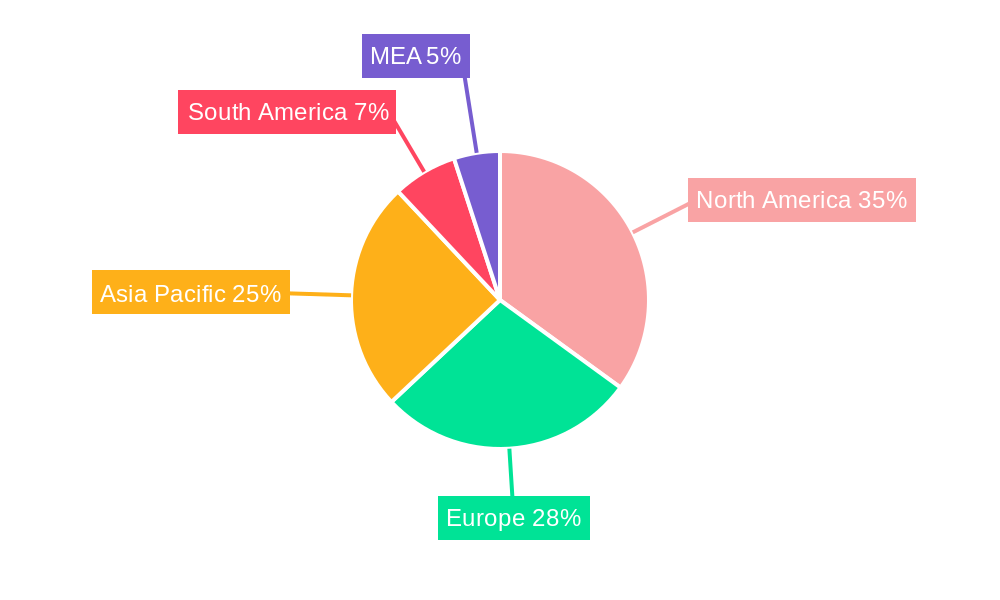
The Autonomous Agents market is experiencing explosive growth, projected to reach a substantial size with a remarkable Compound Annual Growth Rate (CAGR) of 57% between 2025 and 2033. This rapid expansion is fueled by several key drivers. The increasing adoption of cloud-based solutions offers scalability and accessibility, significantly reducing the barriers to entry for businesses of all sizes. Furthermore, advancements in artificial intelligence (AI), machine learning (ML), and natural language processing (NLP) are continuously enhancing the capabilities of autonomous agents, enabling them to perform more complex tasks and integrate seamlessly into existing workflows. The growing demand for automation across diverse industries, including BFSI (Banking, Financial Services, and Insurance), IT & Telecom, Healthcare, and Manufacturing, is further propelling market growth. While initial investment costs and potential security concerns pose some restraints, the long-term benefits of improved efficiency, reduced operational costs, and enhanced customer experiences outweigh these challenges. The market is segmented by deployment type (cloud, on-premises), organization size (SMEs, large enterprises), and industry vertical, reflecting the wide-ranging applicability of this technology. North America currently holds a significant market share, but the Asia-Pacific region is poised for rapid growth due to increasing digitalization and government initiatives.
The competitive landscape is marked by a diverse mix of established technology giants like Microsoft, Google, and IBM, alongside specialized AI companies like Affectiva and Fetch.ai. These companies are engaged in a constant race to innovate, developing increasingly sophisticated autonomous agents capable of handling diverse applications, from fraud detection in finance to personalized customer service in retail. The market's evolution will be shaped by factors such as the integration of autonomous agents with other emerging technologies like the Internet of Things (IoT) and blockchain, as well as the ongoing development of robust regulatory frameworks to address ethical considerations and ensure responsible AI development. The forecast period (2025-2033) promises continued expansion, driven by sustained technological advancements and increasing industry adoption. The market's future success hinges on addressing challenges related to data privacy, security, and ensuring the explainability and transparency of autonomous agent decision-making.
Autonomous Agents Market: A Comprehensive Report (2019-2033)
This in-depth report provides a comprehensive analysis of the Autonomous Agents Market, encompassing market dynamics, growth trends, regional segmentation, product landscape, key players, and future outlook. The study covers the period 2019-2033, with 2025 serving as the base year and the forecast period extending from 2025 to 2033. The market is segmented by deployment type (cloud, on-premises), organization size (SMEs, large enterprises), and industry vertical (BFSI, IT & Telecom, Healthcare, Manufacturing, Transportation & Mobility, Other). The total market size in 2025 is estimated at xx Million.
Autonomous Agents Market Market Dynamics & Structure
The Autonomous Agents market is characterized by a moderately concentrated landscape with several key players vying for market share. Technological innovation, particularly in AI and machine learning, is a major driver, while regulatory frameworks and data privacy concerns pose challenges. The market exhibits strong growth potential, fueled by increasing adoption across various industries. Competitive pressures are significant, with ongoing product development and strategic acquisitions shaping the competitive dynamics. The parent market of Artificial Intelligence and the child market of Intelligent Automation significantly influence the growth trajectory.
- Market Concentration: Moderately concentrated, with the top 5 players holding approximately xx% of market share in 2025.
- Technological Innovation: Rapid advancements in AI, machine learning, and natural language processing are key drivers.
- Regulatory Frameworks: Data privacy regulations (e.g., GDPR) and ethical considerations influence market growth.
- Competitive Substitutes: Traditional rule-based systems and human-operated processes present some competition.
- M&A Trends: A moderate level of M&A activity is observed, with xx deals recorded in the past five years, primarily focused on expanding capabilities and market reach.
- End-User Demographics: Large enterprises currently dominate adoption, but SMEs are increasingly showing interest.
Autonomous Agents Market Growth Trends & Insights
The Autonomous Agents market is experiencing robust growth, driven by increasing demand for automation, improved efficiency, and reduced operational costs across various industries. The market size is projected to expand significantly over the forecast period. The rising adoption of cloud-based solutions and the growing integration of autonomous agents into business processes are major catalysts. Consumer behavior shifts towards personalized experiences and the increasing availability of big data are further contributing to this growth.
- Market Size Evolution: From xx Million in 2019 to an estimated xx Million in 2025, exhibiting a CAGR of xx% during the historical period. Projected to reach xx Million by 2033.
- Adoption Rates: High adoption rates are observed in sectors like BFSI and IT & Telecom, with growth accelerating in Healthcare and Manufacturing.
- Technological Disruptions: Continued advancements in AI and related technologies are expected to drive further market expansion.
- Consumer Behavior Shifts: Growing preference for personalized services and seamless customer experiences fuels demand for autonomous agents.
Dominant Regions, Countries, or Segments in Autonomous Agents Market
North America currently holds the largest market share, followed by Europe. Within the segmentation, the cloud deployment type dominates, driven by its scalability and cost-effectiveness. Large enterprises are the primary adopters due to their higher investment capacity and complex operational needs. The BFSI and IT & Telecom sectors are leading in adoption due to their early adoption of technological advancements.
- North America: Strong presence of key players, advanced technological infrastructure, and high adoption rates.
- Europe: Significant growth potential, driven by increasing digitalization and supportive regulatory frameworks.
- Asia-Pacific: Rapidly emerging market, with significant growth opportunities in countries like China and India.
- Cloud Deployment: Dominant segment due to scalability, cost-effectiveness, and ease of integration.
- Large Enterprises: High adoption rates due to larger budgets and complex workflows requiring automation.
- BFSI and IT & Telecom: Early adoption of autonomous agents due to their focus on operational efficiency and customer experience.
Autonomous Agents Market Product Landscape
Autonomous agents are evolving rapidly, with new features and capabilities constantly emerging. These agents now offer improved accuracy, efficiency, and user experience. Key advancements include enhanced natural language processing, improved decision-making algorithms, and increased integration with other business systems. Unique selling propositions often center on ease of use, specific industry applicability, and advanced analytical capabilities.
Key Drivers, Barriers & Challenges in Autonomous Agents Market
Key Drivers: Increased demand for automation, improved operational efficiency, cost reduction, and the growing availability of big data are major drivers. Technological advancements, especially in AI and machine learning, significantly contribute to market growth. Favorable government policies and initiatives promoting digital transformation also play a role.
Challenges and Restraints: High initial investment costs, concerns about data security and privacy, the need for specialized skills, and integration complexities are significant challenges. Competition from established players and the emergence of new technologies also pose challenges. The lack of standardization and interoperability across different platforms can hinder widespread adoption.
Emerging Opportunities in Autonomous Agents Market
Untapped markets exist in sectors such as healthcare and manufacturing. Innovative applications, such as personalized medicine and predictive maintenance, hold immense growth potential. The increasing adoption of IoT and edge computing creates new opportunities for autonomous agents operating in real-time environments. The development of more explainable and transparent AI models could address user concerns and facilitate wider acceptance.
Growth Accelerators in the Autonomous Agents Market Industry
Technological breakthroughs, particularly in AI and machine learning, are major growth accelerators. Strategic partnerships between technology providers and industry players are accelerating innovation and adoption. Market expansion strategies focusing on emerging economies and underserved sectors are further fueling market growth.
Key Players Shaping the Autonomous Agents Market Market
- SAS Institute Inc
- Infosys Limited
- Fair Isaac Corporation
- Aptiv PLC
- IBM Corporation
- Google LLC
- Nuance Communications
- Salesforce com Inc
- Microsoft Corporation
- Affectiva Inc
- Amazon Web Services Inc
- Fetch ai
- Oracle Corporation
- Intel Corporation
- SAP SE
Notable Milestones in Autonomous Agents Market Sector
- 2020: Significant increase in investment in AI-related startups.
- 2021: Launch of several new autonomous agent platforms with improved capabilities.
- 2022: Major partnerships formed between technology providers and industry players to accelerate adoption.
- 2023: Increased regulatory scrutiny on data privacy and ethical considerations.
- 2024: Successful deployment of autonomous agents in various industries, demonstrating tangible ROI.
In-Depth Autonomous Agents Market Market Outlook
The Autonomous Agents market is poised for sustained growth, driven by continued technological innovation and increasing adoption across various sectors. Strategic partnerships, expansion into new markets, and the development of innovative applications will be crucial for future success. The market's evolution will be shaped by the interplay of technological advancements, regulatory changes, and evolving consumer preferences. The potential for significant market expansion over the next decade is high.
Autonomous Agents Market Segmentation
-
1. Deployment Type
- 1.1. Cloud
- 1.2. On-Premises
-
2. Organization Size
- 2.1. Small & Medium-Sized Enterprises (SMEs)
- 2.2. Large Enterprises
-
3. Industry Vertical
- 3.1. BFSI
- 3.2. IT &Telecom
- 3.3. Healthcare
- 3.4. Manufacturing
- 3.5. Transportation & Mobility
- 3.6. Other Industry Verticals
Autonomous Agents Market Segmentation By Geography
- 1. North America
- 2. Europe
- 3. Asia Pacific
- 4. Latin America
- 5. Middle East
Autonomous Agents Market REPORT HIGHLIGHTS
| Aspects | Details |
|---|---|
| Study Period | 2019-2033 |
| Base Year | 2024 |
| Estimated Year | 2025 |
| Forecast Period | 2025-2033 |
| Historical Period | 2019-2024 |
| Growth Rate | CAGR of 57.00% from 2019-2033 |
| Segmentation |
|
Table of Contents
- 1. Introduction
- 1.1. Research Scope
- 1.2. Market Segmentation
- 1.3. Research Methodology
- 1.4. Definitions and Assumptions
- 2. Executive Summary
- 2.1. Introduction
- 3. Market Dynamics
- 3.1. Introduction
- 3.2. Market Drivers
- 3.2.1. ; Rising Number of AI Applications; Growing Presence of Parallel Computational Resources
- 3.3. Market Restrains
- 3.3.1. Maintaining the Privacy and Integrity of Patient Data
- 3.4. Market Trends
- 3.4.1. Transportation and Mobility Segments to Dominate the Market
- 4. Market Factor Analysis
- 4.1. Porters Five Forces
- 4.2. Supply/Value Chain
- 4.3. PESTEL analysis
- 4.4. Market Entropy
- 4.5. Patent/Trademark Analysis
- 5. Global Autonomous Agents Market Analysis, Insights and Forecast, 2019-2031
- 5.1. Market Analysis, Insights and Forecast - by Deployment Type
- 5.1.1. Cloud
- 5.1.2. On-Premises
- 5.2. Market Analysis, Insights and Forecast - by Organization Size
- 5.2.1. Small & Medium-Sized Enterprises (SMEs)
- 5.2.2. Large Enterprises
- 5.3. Market Analysis, Insights and Forecast - by Industry Vertical
- 5.3.1. BFSI
- 5.3.2. IT &Telecom
- 5.3.3. Healthcare
- 5.3.4. Manufacturing
- 5.3.5. Transportation & Mobility
- 5.3.6. Other Industry Verticals
- 5.4. Market Analysis, Insights and Forecast - by Region
- 5.4.1. North America
- 5.4.2. Europe
- 5.4.3. Asia Pacific
- 5.4.4. Latin America
- 5.4.5. Middle East
- 5.1. Market Analysis, Insights and Forecast - by Deployment Type
- 6. North America Autonomous Agents Market Analysis, Insights and Forecast, 2019-2031
- 6.1. Market Analysis, Insights and Forecast - by Deployment Type
- 6.1.1. Cloud
- 6.1.2. On-Premises
- 6.2. Market Analysis, Insights and Forecast - by Organization Size
- 6.2.1. Small & Medium-Sized Enterprises (SMEs)
- 6.2.2. Large Enterprises
- 6.3. Market Analysis, Insights and Forecast - by Industry Vertical
- 6.3.1. BFSI
- 6.3.2. IT &Telecom
- 6.3.3. Healthcare
- 6.3.4. Manufacturing
- 6.3.5. Transportation & Mobility
- 6.3.6. Other Industry Verticals
- 6.1. Market Analysis, Insights and Forecast - by Deployment Type
- 7. Europe Autonomous Agents Market Analysis, Insights and Forecast, 2019-2031
- 7.1. Market Analysis, Insights and Forecast - by Deployment Type
- 7.1.1. Cloud
- 7.1.2. On-Premises
- 7.2. Market Analysis, Insights and Forecast - by Organization Size
- 7.2.1. Small & Medium-Sized Enterprises (SMEs)
- 7.2.2. Large Enterprises
- 7.3. Market Analysis, Insights and Forecast - by Industry Vertical
- 7.3.1. BFSI
- 7.3.2. IT &Telecom
- 7.3.3. Healthcare
- 7.3.4. Manufacturing
- 7.3.5. Transportation & Mobility
- 7.3.6. Other Industry Verticals
- 7.1. Market Analysis, Insights and Forecast - by Deployment Type
- 8. Asia Pacific Autonomous Agents Market Analysis, Insights and Forecast, 2019-2031
- 8.1. Market Analysis, Insights and Forecast - by Deployment Type
- 8.1.1. Cloud
- 8.1.2. On-Premises
- 8.2. Market Analysis, Insights and Forecast - by Organization Size
- 8.2.1. Small & Medium-Sized Enterprises (SMEs)
- 8.2.2. Large Enterprises
- 8.3. Market Analysis, Insights and Forecast - by Industry Vertical
- 8.3.1. BFSI
- 8.3.2. IT &Telecom
- 8.3.3. Healthcare
- 8.3.4. Manufacturing
- 8.3.5. Transportation & Mobility
- 8.3.6. Other Industry Verticals
- 8.1. Market Analysis, Insights and Forecast - by Deployment Type
- 9. Latin America Autonomous Agents Market Analysis, Insights and Forecast, 2019-2031
- 9.1. Market Analysis, Insights and Forecast - by Deployment Type
- 9.1.1. Cloud
- 9.1.2. On-Premises
- 9.2. Market Analysis, Insights and Forecast - by Organization Size
- 9.2.1. Small & Medium-Sized Enterprises (SMEs)
- 9.2.2. Large Enterprises
- 9.3. Market Analysis, Insights and Forecast - by Industry Vertical
- 9.3.1. BFSI
- 9.3.2. IT &Telecom
- 9.3.3. Healthcare
- 9.3.4. Manufacturing
- 9.3.5. Transportation & Mobility
- 9.3.6. Other Industry Verticals
- 9.1. Market Analysis, Insights and Forecast - by Deployment Type
- 10. Middle East Autonomous Agents Market Analysis, Insights and Forecast, 2019-2031
- 10.1. Market Analysis, Insights and Forecast - by Deployment Type
- 10.1.1. Cloud
- 10.1.2. On-Premises
- 10.2. Market Analysis, Insights and Forecast - by Organization Size
- 10.2.1. Small & Medium-Sized Enterprises (SMEs)
- 10.2.2. Large Enterprises
- 10.3. Market Analysis, Insights and Forecast - by Industry Vertical
- 10.3.1. BFSI
- 10.3.2. IT &Telecom
- 10.3.3. Healthcare
- 10.3.4. Manufacturing
- 10.3.5. Transportation & Mobility
- 10.3.6. Other Industry Verticals
- 10.1. Market Analysis, Insights and Forecast - by Deployment Type
- 11. North America Autonomous Agents Market Analysis, Insights and Forecast, 2019-2031
- 11.1. Market Analysis, Insights and Forecast - By Country/Sub-region
- 11.1.1 United States
- 11.1.2 Canada
- 11.1.3 Mexico
- 12. Europe Autonomous Agents Market Analysis, Insights and Forecast, 2019-2031
- 12.1. Market Analysis, Insights and Forecast - By Country/Sub-region
- 12.1.1 Germany
- 12.1.2 United Kingdom
- 12.1.3 France
- 12.1.4 Spain
- 12.1.5 Italy
- 12.1.6 Spain
- 12.1.7 Belgium
- 12.1.8 Netherland
- 12.1.9 Nordics
- 12.1.10 Rest of Europe
- 13. Asia Pacific Autonomous Agents Market Analysis, Insights and Forecast, 2019-2031
- 13.1. Market Analysis, Insights and Forecast - By Country/Sub-region
- 13.1.1 China
- 13.1.2 Japan
- 13.1.3 India
- 13.1.4 South Korea
- 13.1.5 Southeast Asia
- 13.1.6 Australia
- 13.1.7 Indonesia
- 13.1.8 Phillipes
- 13.1.9 Singapore
- 13.1.10 Thailandc
- 13.1.11 Rest of Asia Pacific
- 14. South America Autonomous Agents Market Analysis, Insights and Forecast, 2019-2031
- 14.1. Market Analysis, Insights and Forecast - By Country/Sub-region
- 14.1.1 Brazil
- 14.1.2 Argentina
- 14.1.3 Peru
- 14.1.4 Chile
- 14.1.5 Colombia
- 14.1.6 Ecuador
- 14.1.7 Venezuela
- 14.1.8 Rest of South America
- 15. North America Autonomous Agents Market Analysis, Insights and Forecast, 2019-2031
- 15.1. Market Analysis, Insights and Forecast - By Country/Sub-region
- 15.1.1 United States
- 15.1.2 Canada
- 15.1.3 Mexico
- 16. MEA Autonomous Agents Market Analysis, Insights and Forecast, 2019-2031
- 16.1. Market Analysis, Insights and Forecast - By Country/Sub-region
- 16.1.1 United Arab Emirates
- 16.1.2 Saudi Arabia
- 16.1.3 South Africa
- 16.1.4 Rest of Middle East and Africa
- 17. Competitive Analysis
- 17.1. Global Market Share Analysis 2024
- 17.2. Company Profiles
- 17.2.1 SAS Institute Inc
- 17.2.1.1. Overview
- 17.2.1.2. Products
- 17.2.1.3. SWOT Analysis
- 17.2.1.4. Recent Developments
- 17.2.1.5. Financials (Based on Availability)
- 17.2.2 Infosys Limited
- 17.2.2.1. Overview
- 17.2.2.2. Products
- 17.2.2.3. SWOT Analysis
- 17.2.2.4. Recent Developments
- 17.2.2.5. Financials (Based on Availability)
- 17.2.3 Fair Isaac Corporation
- 17.2.3.1. Overview
- 17.2.3.2. Products
- 17.2.3.3. SWOT Analysis
- 17.2.3.4. Recent Developments
- 17.2.3.5. Financials (Based on Availability)
- 17.2.4 Aptiv PLC*List Not Exhaustive
- 17.2.4.1. Overview
- 17.2.4.2. Products
- 17.2.4.3. SWOT Analysis
- 17.2.4.4. Recent Developments
- 17.2.4.5. Financials (Based on Availability)
- 17.2.5 IBM Corporation
- 17.2.5.1. Overview
- 17.2.5.2. Products
- 17.2.5.3. SWOT Analysis
- 17.2.5.4. Recent Developments
- 17.2.5.5. Financials (Based on Availability)
- 17.2.6 Google LLC
- 17.2.6.1. Overview
- 17.2.6.2. Products
- 17.2.6.3. SWOT Analysis
- 17.2.6.4. Recent Developments
- 17.2.6.5. Financials (Based on Availability)
- 17.2.7 Nuance Communications
- 17.2.7.1. Overview
- 17.2.7.2. Products
- 17.2.7.3. SWOT Analysis
- 17.2.7.4. Recent Developments
- 17.2.7.5. Financials (Based on Availability)
- 17.2.8 Salesforce com Inc
- 17.2.8.1. Overview
- 17.2.8.2. Products
- 17.2.8.3. SWOT Analysis
- 17.2.8.4. Recent Developments
- 17.2.8.5. Financials (Based on Availability)
- 17.2.9 Microsoft Corporation
- 17.2.9.1. Overview
- 17.2.9.2. Products
- 17.2.9.3. SWOT Analysis
- 17.2.9.4. Recent Developments
- 17.2.9.5. Financials (Based on Availability)
- 17.2.10 Affectiva Inc
- 17.2.10.1. Overview
- 17.2.10.2. Products
- 17.2.10.3. SWOT Analysis
- 17.2.10.4. Recent Developments
- 17.2.10.5. Financials (Based on Availability)
- 17.2.11 Amazon Web Services Inc
- 17.2.11.1. Overview
- 17.2.11.2. Products
- 17.2.11.3. SWOT Analysis
- 17.2.11.4. Recent Developments
- 17.2.11.5. Financials (Based on Availability)
- 17.2.12 Fetch ai
- 17.2.12.1. Overview
- 17.2.12.2. Products
- 17.2.12.3. SWOT Analysis
- 17.2.12.4. Recent Developments
- 17.2.12.5. Financials (Based on Availability)
- 17.2.13 Oracle Corporation
- 17.2.13.1. Overview
- 17.2.13.2. Products
- 17.2.13.3. SWOT Analysis
- 17.2.13.4. Recent Developments
- 17.2.13.5. Financials (Based on Availability)
- 17.2.14 Intel Corporation
- 17.2.14.1. Overview
- 17.2.14.2. Products
- 17.2.14.3. SWOT Analysis
- 17.2.14.4. Recent Developments
- 17.2.14.5. Financials (Based on Availability)
- 17.2.15 SAP SE
- 17.2.15.1. Overview
- 17.2.15.2. Products
- 17.2.15.3. SWOT Analysis
- 17.2.15.4. Recent Developments
- 17.2.15.5. Financials (Based on Availability)
- 17.2.1 SAS Institute Inc
List of Figures
- Figure 1: Global Autonomous Agents Market Revenue Breakdown (Million, %) by Region 2024 & 2032
- Figure 2: North America Autonomous Agents Market Revenue (Million), by Country 2024 & 2032
- Figure 3: North America Autonomous Agents Market Revenue Share (%), by Country 2024 & 2032
- Figure 4: Europe Autonomous Agents Market Revenue (Million), by Country 2024 & 2032
- Figure 5: Europe Autonomous Agents Market Revenue Share (%), by Country 2024 & 2032
- Figure 6: Asia Pacific Autonomous Agents Market Revenue (Million), by Country 2024 & 2032
- Figure 7: Asia Pacific Autonomous Agents Market Revenue Share (%), by Country 2024 & 2032
- Figure 8: South America Autonomous Agents Market Revenue (Million), by Country 2024 & 2032
- Figure 9: South America Autonomous Agents Market Revenue Share (%), by Country 2024 & 2032
- Figure 10: North America Autonomous Agents Market Revenue (Million), by Country 2024 & 2032
- Figure 11: North America Autonomous Agents Market Revenue Share (%), by Country 2024 & 2032
- Figure 12: MEA Autonomous Agents Market Revenue (Million), by Country 2024 & 2032
- Figure 13: MEA Autonomous Agents Market Revenue Share (%), by Country 2024 & 2032
- Figure 14: North America Autonomous Agents Market Revenue (Million), by Deployment Type 2024 & 2032
- Figure 15: North America Autonomous Agents Market Revenue Share (%), by Deployment Type 2024 & 2032
- Figure 16: North America Autonomous Agents Market Revenue (Million), by Organization Size 2024 & 2032
- Figure 17: North America Autonomous Agents Market Revenue Share (%), by Organization Size 2024 & 2032
- Figure 18: North America Autonomous Agents Market Revenue (Million), by Industry Vertical 2024 & 2032
- Figure 19: North America Autonomous Agents Market Revenue Share (%), by Industry Vertical 2024 & 2032
- Figure 20: North America Autonomous Agents Market Revenue (Million), by Country 2024 & 2032
- Figure 21: North America Autonomous Agents Market Revenue Share (%), by Country 2024 & 2032
- Figure 22: Europe Autonomous Agents Market Revenue (Million), by Deployment Type 2024 & 2032
- Figure 23: Europe Autonomous Agents Market Revenue Share (%), by Deployment Type 2024 & 2032
- Figure 24: Europe Autonomous Agents Market Revenue (Million), by Organization Size 2024 & 2032
- Figure 25: Europe Autonomous Agents Market Revenue Share (%), by Organization Size 2024 & 2032
- Figure 26: Europe Autonomous Agents Market Revenue (Million), by Industry Vertical 2024 & 2032
- Figure 27: Europe Autonomous Agents Market Revenue Share (%), by Industry Vertical 2024 & 2032
- Figure 28: Europe Autonomous Agents Market Revenue (Million), by Country 2024 & 2032
- Figure 29: Europe Autonomous Agents Market Revenue Share (%), by Country 2024 & 2032
- Figure 30: Asia Pacific Autonomous Agents Market Revenue (Million), by Deployment Type 2024 & 2032
- Figure 31: Asia Pacific Autonomous Agents Market Revenue Share (%), by Deployment Type 2024 & 2032
- Figure 32: Asia Pacific Autonomous Agents Market Revenue (Million), by Organization Size 2024 & 2032
- Figure 33: Asia Pacific Autonomous Agents Market Revenue Share (%), by Organization Size 2024 & 2032
- Figure 34: Asia Pacific Autonomous Agents Market Revenue (Million), by Industry Vertical 2024 & 2032
- Figure 35: Asia Pacific Autonomous Agents Market Revenue Share (%), by Industry Vertical 2024 & 2032
- Figure 36: Asia Pacific Autonomous Agents Market Revenue (Million), by Country 2024 & 2032
- Figure 37: Asia Pacific Autonomous Agents Market Revenue Share (%), by Country 2024 & 2032
- Figure 38: Latin America Autonomous Agents Market Revenue (Million), by Deployment Type 2024 & 2032
- Figure 39: Latin America Autonomous Agents Market Revenue Share (%), by Deployment Type 2024 & 2032
- Figure 40: Latin America Autonomous Agents Market Revenue (Million), by Organization Size 2024 & 2032
- Figure 41: Latin America Autonomous Agents Market Revenue Share (%), by Organization Size 2024 & 2032
- Figure 42: Latin America Autonomous Agents Market Revenue (Million), by Industry Vertical 2024 & 2032
- Figure 43: Latin America Autonomous Agents Market Revenue Share (%), by Industry Vertical 2024 & 2032
- Figure 44: Latin America Autonomous Agents Market Revenue (Million), by Country 2024 & 2032
- Figure 45: Latin America Autonomous Agents Market Revenue Share (%), by Country 2024 & 2032
- Figure 46: Middle East Autonomous Agents Market Revenue (Million), by Deployment Type 2024 & 2032
- Figure 47: Middle East Autonomous Agents Market Revenue Share (%), by Deployment Type 2024 & 2032
- Figure 48: Middle East Autonomous Agents Market Revenue (Million), by Organization Size 2024 & 2032
- Figure 49: Middle East Autonomous Agents Market Revenue Share (%), by Organization Size 2024 & 2032
- Figure 50: Middle East Autonomous Agents Market Revenue (Million), by Industry Vertical 2024 & 2032
- Figure 51: Middle East Autonomous Agents Market Revenue Share (%), by Industry Vertical 2024 & 2032
- Figure 52: Middle East Autonomous Agents Market Revenue (Million), by Country 2024 & 2032
- Figure 53: Middle East Autonomous Agents Market Revenue Share (%), by Country 2024 & 2032
List of Tables
- Table 1: Global Autonomous Agents Market Revenue Million Forecast, by Region 2019 & 2032
- Table 2: Global Autonomous Agents Market Revenue Million Forecast, by Deployment Type 2019 & 2032
- Table 3: Global Autonomous Agents Market Revenue Million Forecast, by Organization Size 2019 & 2032
- Table 4: Global Autonomous Agents Market Revenue Million Forecast, by Industry Vertical 2019 & 2032
- Table 5: Global Autonomous Agents Market Revenue Million Forecast, by Region 2019 & 2032
- Table 6: Global Autonomous Agents Market Revenue Million Forecast, by Country 2019 & 2032
- Table 7: United States Autonomous Agents Market Revenue (Million) Forecast, by Application 2019 & 2032
- Table 8: Canada Autonomous Agents Market Revenue (Million) Forecast, by Application 2019 & 2032
- Table 9: Mexico Autonomous Agents Market Revenue (Million) Forecast, by Application 2019 & 2032
- Table 10: Global Autonomous Agents Market Revenue Million Forecast, by Country 2019 & 2032
- Table 11: Germany Autonomous Agents Market Revenue (Million) Forecast, by Application 2019 & 2032
- Table 12: United Kingdom Autonomous Agents Market Revenue (Million) Forecast, by Application 2019 & 2032
- Table 13: France Autonomous Agents Market Revenue (Million) Forecast, by Application 2019 & 2032
- Table 14: Spain Autonomous Agents Market Revenue (Million) Forecast, by Application 2019 & 2032
- Table 15: Italy Autonomous Agents Market Revenue (Million) Forecast, by Application 2019 & 2032
- Table 16: Spain Autonomous Agents Market Revenue (Million) Forecast, by Application 2019 & 2032
- Table 17: Belgium Autonomous Agents Market Revenue (Million) Forecast, by Application 2019 & 2032
- Table 18: Netherland Autonomous Agents Market Revenue (Million) Forecast, by Application 2019 & 2032
- Table 19: Nordics Autonomous Agents Market Revenue (Million) Forecast, by Application 2019 & 2032
- Table 20: Rest of Europe Autonomous Agents Market Revenue (Million) Forecast, by Application 2019 & 2032
- Table 21: Global Autonomous Agents Market Revenue Million Forecast, by Country 2019 & 2032
- Table 22: China Autonomous Agents Market Revenue (Million) Forecast, by Application 2019 & 2032
- Table 23: Japan Autonomous Agents Market Revenue (Million) Forecast, by Application 2019 & 2032
- Table 24: India Autonomous Agents Market Revenue (Million) Forecast, by Application 2019 & 2032
- Table 25: South Korea Autonomous Agents Market Revenue (Million) Forecast, by Application 2019 & 2032
- Table 26: Southeast Asia Autonomous Agents Market Revenue (Million) Forecast, by Application 2019 & 2032
- Table 27: Australia Autonomous Agents Market Revenue (Million) Forecast, by Application 2019 & 2032
- Table 28: Indonesia Autonomous Agents Market Revenue (Million) Forecast, by Application 2019 & 2032
- Table 29: Phillipes Autonomous Agents Market Revenue (Million) Forecast, by Application 2019 & 2032
- Table 30: Singapore Autonomous Agents Market Revenue (Million) Forecast, by Application 2019 & 2032
- Table 31: Thailandc Autonomous Agents Market Revenue (Million) Forecast, by Application 2019 & 2032
- Table 32: Rest of Asia Pacific Autonomous Agents Market Revenue (Million) Forecast, by Application 2019 & 2032
- Table 33: Global Autonomous Agents Market Revenue Million Forecast, by Country 2019 & 2032
- Table 34: Brazil Autonomous Agents Market Revenue (Million) Forecast, by Application 2019 & 2032
- Table 35: Argentina Autonomous Agents Market Revenue (Million) Forecast, by Application 2019 & 2032
- Table 36: Peru Autonomous Agents Market Revenue (Million) Forecast, by Application 2019 & 2032
- Table 37: Chile Autonomous Agents Market Revenue (Million) Forecast, by Application 2019 & 2032
- Table 38: Colombia Autonomous Agents Market Revenue (Million) Forecast, by Application 2019 & 2032
- Table 39: Ecuador Autonomous Agents Market Revenue (Million) Forecast, by Application 2019 & 2032
- Table 40: Venezuela Autonomous Agents Market Revenue (Million) Forecast, by Application 2019 & 2032
- Table 41: Rest of South America Autonomous Agents Market Revenue (Million) Forecast, by Application 2019 & 2032
- Table 42: Global Autonomous Agents Market Revenue Million Forecast, by Country 2019 & 2032
- Table 43: United States Autonomous Agents Market Revenue (Million) Forecast, by Application 2019 & 2032
- Table 44: Canada Autonomous Agents Market Revenue (Million) Forecast, by Application 2019 & 2032
- Table 45: Mexico Autonomous Agents Market Revenue (Million) Forecast, by Application 2019 & 2032
- Table 46: Global Autonomous Agents Market Revenue Million Forecast, by Country 2019 & 2032
- Table 47: United Arab Emirates Autonomous Agents Market Revenue (Million) Forecast, by Application 2019 & 2032
- Table 48: Saudi Arabia Autonomous Agents Market Revenue (Million) Forecast, by Application 2019 & 2032
- Table 49: South Africa Autonomous Agents Market Revenue (Million) Forecast, by Application 2019 & 2032
- Table 50: Rest of Middle East and Africa Autonomous Agents Market Revenue (Million) Forecast, by Application 2019 & 2032
- Table 51: Global Autonomous Agents Market Revenue Million Forecast, by Deployment Type 2019 & 2032
- Table 52: Global Autonomous Agents Market Revenue Million Forecast, by Organization Size 2019 & 2032
- Table 53: Global Autonomous Agents Market Revenue Million Forecast, by Industry Vertical 2019 & 2032
- Table 54: Global Autonomous Agents Market Revenue Million Forecast, by Country 2019 & 2032
- Table 55: Global Autonomous Agents Market Revenue Million Forecast, by Deployment Type 2019 & 2032
- Table 56: Global Autonomous Agents Market Revenue Million Forecast, by Organization Size 2019 & 2032
- Table 57: Global Autonomous Agents Market Revenue Million Forecast, by Industry Vertical 2019 & 2032
- Table 58: Global Autonomous Agents Market Revenue Million Forecast, by Country 2019 & 2032
- Table 59: Global Autonomous Agents Market Revenue Million Forecast, by Deployment Type 2019 & 2032
- Table 60: Global Autonomous Agents Market Revenue Million Forecast, by Organization Size 2019 & 2032
- Table 61: Global Autonomous Agents Market Revenue Million Forecast, by Industry Vertical 2019 & 2032
- Table 62: Global Autonomous Agents Market Revenue Million Forecast, by Country 2019 & 2032
- Table 63: Global Autonomous Agents Market Revenue Million Forecast, by Deployment Type 2019 & 2032
- Table 64: Global Autonomous Agents Market Revenue Million Forecast, by Organization Size 2019 & 2032
- Table 65: Global Autonomous Agents Market Revenue Million Forecast, by Industry Vertical 2019 & 2032
- Table 66: Global Autonomous Agents Market Revenue Million Forecast, by Country 2019 & 2032
- Table 67: Global Autonomous Agents Market Revenue Million Forecast, by Deployment Type 2019 & 2032
- Table 68: Global Autonomous Agents Market Revenue Million Forecast, by Organization Size 2019 & 2032
- Table 69: Global Autonomous Agents Market Revenue Million Forecast, by Industry Vertical 2019 & 2032
- Table 70: Global Autonomous Agents Market Revenue Million Forecast, by Country 2019 & 2032
Frequently Asked Questions
1. What is the projected Compound Annual Growth Rate (CAGR) of the Autonomous Agents Market?
The projected CAGR is approximately 57.00%.
2. Which companies are prominent players in the Autonomous Agents Market?
Key companies in the market include SAS Institute Inc, Infosys Limited, Fair Isaac Corporation, Aptiv PLC*List Not Exhaustive, IBM Corporation, Google LLC, Nuance Communications, Salesforce com Inc, Microsoft Corporation, Affectiva Inc, Amazon Web Services Inc, Fetch ai, Oracle Corporation, Intel Corporation, SAP SE.
3. What are the main segments of the Autonomous Agents Market?
The market segments include Deployment Type, Organization Size, Industry Vertical.
4. Can you provide details about the market size?
The market size is estimated to be USD XX Million as of 2022.
5. What are some drivers contributing to market growth?
; Rising Number of AI Applications; Growing Presence of Parallel Computational Resources.
6. What are the notable trends driving market growth?
Transportation and Mobility Segments to Dominate the Market.
7. Are there any restraints impacting market growth?
Maintaining the Privacy and Integrity of Patient Data.
8. Can you provide examples of recent developments in the market?
N/A
9. What pricing options are available for accessing the report?
Pricing options include single-user, multi-user, and enterprise licenses priced at USD 4750, USD 5250, and USD 8750 respectively.
10. Is the market size provided in terms of value or volume?
The market size is provided in terms of value, measured in Million.
11. Are there any specific market keywords associated with the report?
Yes, the market keyword associated with the report is "Autonomous Agents Market," which aids in identifying and referencing the specific market segment covered.
12. How do I determine which pricing option suits my needs best?
The pricing options vary based on user requirements and access needs. Individual users may opt for single-user licenses, while businesses requiring broader access may choose multi-user or enterprise licenses for cost-effective access to the report.
13. Are there any additional resources or data provided in the Autonomous Agents Market report?
While the report offers comprehensive insights, it's advisable to review the specific contents or supplementary materials provided to ascertain if additional resources or data are available.
14. How can I stay updated on further developments or reports in the Autonomous Agents Market?
To stay informed about further developments, trends, and reports in the Autonomous Agents Market, consider subscribing to industry newsletters, following relevant companies and organizations, or regularly checking reputable industry news sources and publications.
Methodology
Step 1 - Identification of Relevant Samples Size from Population Database


Step 2 - Approaches for Defining Global Market Size (Value, Volume* & Price*)

Note*: In applicable scenarios
Step 3 - Data Sources
Primary Research
- Web Analytics
- Survey Reports
- Research Institute
- Latest Research Reports
- Opinion Leaders
Secondary Research
- Annual Reports
- White Paper
- Latest Press Release
- Industry Association
- Paid Database
- Investor Presentations

Step 4 - Data Triangulation
Involves using different sources of information in order to increase the validity of a study
These sources are likely to be stakeholders in a program - participants, other researchers, program staff, other community members, and so on.
Then we put all data in single framework & apply various statistical tools to find out the dynamic on the market.
During the analysis stage, feedback from the stakeholder groups would be compared to determine areas of agreement as well as areas of divergence


