
Key Insights
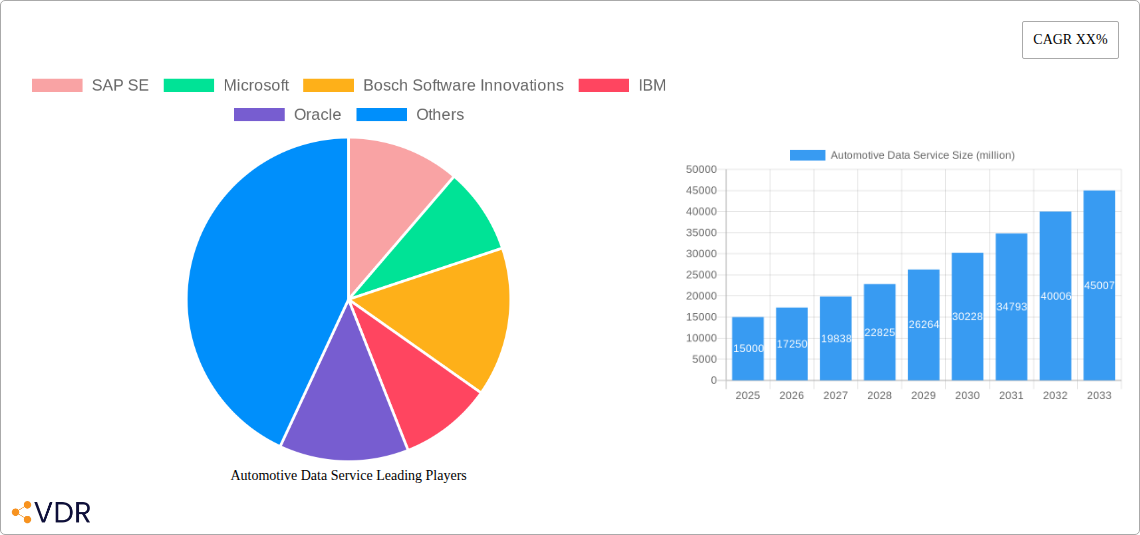
The automotive data services market is experiencing robust growth, driven by the increasing adoption of connected vehicles, the proliferation of advanced driver-assistance systems (ADAS), and the expanding demand for data-driven insights within the automotive industry. The market's value, estimated at $15 billion in 2025, is projected to grow at a Compound Annual Growth Rate (CAGR) of 15% from 2025 to 2033, reaching approximately $50 billion by 2033. This significant expansion is fueled by several key trends, including the rise of data monetization strategies by automakers, the development of innovative data analytics solutions for predictive maintenance and enhanced safety features, and the growing integration of telematics and IoT technologies within vehicles. Major players like SAP, Microsoft, and IBM are actively shaping the market landscape through strategic partnerships, acquisitions, and the development of comprehensive data platforms. The market segmentation reflects a diverse range of services, encompassing data collection, processing, analytics, and application development, catering to various stakeholders across the automotive value chain. However, challenges remain, including data security and privacy concerns, the need for robust data standardization and interoperability protocols, and regulatory hurdles around data ownership and usage.
The competitive landscape is characterized by a mix of established technology providers, automotive manufacturers, and specialized data service companies. The competitive intensity is expected to increase as more players enter the market. Successful players will need to focus on developing secure and scalable data platforms, fostering strong partnerships within the ecosystem, and leveraging advanced AI and machine learning capabilities to extract valuable insights from the ever-growing volume of automotive data. Geographic expansion into developing markets, especially in Asia-Pacific, presents significant opportunities. Continuous innovation and adaptation to evolving technological advancements and evolving regulatory frameworks will be crucial for long-term success within this dynamic market.
Automotive Data Service Market Report: 2019-2033
This comprehensive report provides a detailed analysis of the Automotive Data Service market, encompassing market dynamics, growth trends, regional dominance, product landscape, key players, and future outlook. The study period covers 2019-2033, with a base year of 2025 and a forecast period of 2025-2033. The report utilizes data from the historical period (2019-2024) and leverages proprietary research methodologies to provide actionable insights for industry professionals. This report focuses on the parent market of Automotive Technology and the child market of Automotive Data Services. The market size is predicted to reach xx million units by 2033.
Automotive Data Service Market Dynamics & Structure
The Automotive Data Service market exhibits a moderately concentrated structure, with key players like SAP SE, Microsoft, and Bosch Software Innovations holding significant market share. Technological innovation, particularly in areas like AI and IoT, is a primary driver, while regulatory frameworks concerning data privacy and security are significant shaping factors. The market faces competition from substitute services offering similar functionalities, though their impact is currently limited. End-user demographics, primarily automotive manufacturers and fleet operators, are pivotal. The last five years have seen xx M&A deals, indicating significant consolidation within the sector.
- Market Concentration: Moderately concentrated, with the top 5 players holding approximately 60% market share in 2025.
- Innovation Drivers: AI, IoT, 5G connectivity, edge computing.
- Regulatory Frameworks: GDPR, CCPA, and regional data privacy regulations.
- Competitive Substitutes: Traditional data management solutions, in-house development.
- End-User Demographics: Automotive OEMs (60%), Fleet Management Companies (25%), Aftermarket service providers (15%).
- M&A Trends: xx million-dollar deals in the last 5 years, with a focus on acquiring specialized technology and expanding geographic reach.
- Innovation Barriers: High initial investment costs, data security concerns, integration complexities.
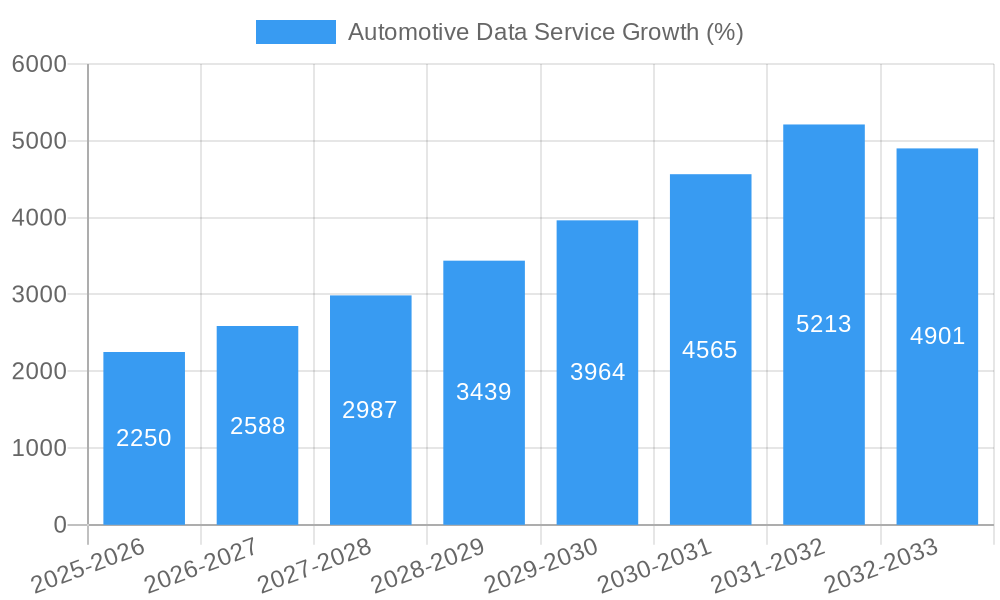
Automotive Data Service Growth Trends & Insights
The Automotive Data Service market experienced robust growth during the historical period (2019-2024), with a CAGR of xx%. This growth is primarily attributed to increasing vehicle connectivity, the proliferation of connected car features, and the growing demand for data-driven insights in fleet management and automotive manufacturing. Adoption rates have increased significantly, particularly among large OEMs. Technological disruptions like the rise of cloud computing and edge computing have further fuelled market expansion. Consumer behavior shifts towards data-driven personalization and enhanced safety are also major contributing factors. The market is projected to maintain a CAGR of xx% during the forecast period (2025-2033), reaching xx million units by 2033. Market penetration is expected to reach xx% by 2033.
Dominant Regions, Countries, or Segments in Automotive Data Service
North America currently dominates the Automotive Data Service market, driven by strong technological advancements, early adoption of connected car technologies, and a robust regulatory framework. This region accounts for approximately xx% of the global market share in 2025. Europe and Asia-Pacific are also significant markets, experiencing rapid growth due to increasing government initiatives promoting data-driven transportation and infrastructure development.
- North America: Strong technological innovation, early adoption, substantial investment.
- Europe: Stringent data privacy regulations driving data security innovation, growing adoption in fleet management.
- Asia-Pacific: Rapid economic growth, increasing vehicle ownership, government initiatives promoting connected infrastructure.
- Market Share: North America (xx%), Europe (xx%), Asia-Pacific (xx%), Rest of World (xx%).
- Growth Potential: Highest growth potential in Asia-Pacific due to expanding market size and increasing vehicle connectivity.
Automotive Data Service Product Landscape
The Automotive Data Service market offers a diverse range of products and solutions, including data acquisition platforms, data analytics tools, and cloud-based data management systems. Key product innovations include real-time data streaming, predictive maintenance analytics, and AI-powered anomaly detection. These advancements enable enhanced operational efficiency, improved safety, and personalized user experiences. Unique selling propositions focus on data security, scalability, and ease of integration with existing automotive systems.
Key Drivers, Barriers & Challenges in Automotive Data Service
Key Drivers:
- Increased vehicle connectivity and the proliferation of connected car features.
- Growing demand for data-driven insights in fleet management and automotive manufacturing.
- Technological advancements in AI, IoT, and cloud computing.
- Government regulations promoting data-driven transportation systems.
Key Challenges & Restraints:
- Data security and privacy concerns, resulting in increased regulatory hurdles.
- High initial investment costs for implementing data acquisition and analysis systems.
- Integration complexities with existing automotive systems, leading to potential implementation delays.
- Competition from established technology providers and new entrants, creating price pressure. This is predicted to reduce profit margins by xx% by 2033.
Emerging Opportunities in Automotive Data Service
- Expanding use cases for data in autonomous driving and advanced driver-assistance systems (ADAS).
- Growth in the demand for predictive maintenance analytics to reduce operational costs and downtime.
- Increasing adoption of data-driven services in the aftermarket and repair sector.
- Development of new data monetization models, such as offering data-as-a-service (DaaS) platforms.
Growth Accelerators in the Automotive Data Service Industry
Strategic partnerships between automotive manufacturers, technology providers, and data analytics firms are accelerating market growth. Technological breakthroughs in AI and machine learning are enabling advanced data analytics capabilities. Expansion into new geographical markets, particularly in developing economies with rapidly growing vehicle ownership, presents significant growth potential.
Key Players Shaping the Automotive Data Service Market
- SAP SE
- Microsoft
- Bosch Software Innovations
- IBM
- Oracle
- ZenDrive
- Carfit
- Ford Commercial Solutions
- Cloudera
- Otonomo
- Autodata Solutions
- Vehicle Data Services
- V12
- Eclar
- Cyzone
- Zebrai
- Wenfeng
- So.Car
- Jingzhengu
- WAYS
- Jingyou Times
Notable Milestones in Automotive Data Service Sector
- 2020: Increased adoption of cloud-based data management solutions by major OEMs.
- 2021: Several significant M&A transactions involving key players in the Automotive Data Service market.
- 2022: Introduction of new data analytics tools powered by AI and machine learning.
- 2023: Launch of several data-as-a-service (DaaS) platforms by technology providers.
- 2024: Growing adoption of edge computing for real-time data processing in vehicles.
In-Depth Automotive Data Service Market Outlook
The Automotive Data Service market is poised for significant growth over the next decade, driven by continuous technological advancements, increasing vehicle connectivity, and expanding data monetization opportunities. Strategic partnerships and investments in innovative data solutions will play a crucial role in shaping the future of this dynamic market. The market is expected to continue its strong growth trajectory, presenting significant opportunities for established players and new entrants alike.
Automotive Data Service Segmentation
-
1. Application
- 1.1. Traffic Management
- 1.2. Safety and Security Management
- 1.3. Driver and User Behavior Analysis
- 1.4. Warranty Analytics
- 1.5. Others
-
2. Types
- 2.1. On-premises
- 2.2. Cloud-based
Automotive Data Service Segmentation By Geography
-
1. North America
- 1.1. United States
- 1.2. Canada
- 1.3. Mexico
-
2. South America
- 2.1. Brazil
- 2.2. Argentina
- 2.3. Rest of South America
-
3. Europe
- 3.1. United Kingdom
- 3.2. Germany
- 3.3. France
- 3.4. Italy
- 3.5. Spain
- 3.6. Russia
- 3.7. Benelux
- 3.8. Nordics
- 3.9. Rest of Europe
-
4. Middle East & Africa
- 4.1. Turkey
- 4.2. Israel
- 4.3. GCC
- 4.4. North Africa
- 4.5. South Africa
- 4.6. Rest of Middle East & Africa
-
5. Asia Pacific
- 5.1. China
- 5.2. India
- 5.3. Japan
- 5.4. South Korea
- 5.5. ASEAN
- 5.6. Oceania
- 5.7. Rest of Asia Pacific

Automotive Data Service REPORT HIGHLIGHTS
| Aspects | Details |
|---|---|
| Study Period | 2019-2033 |
| Base Year | 2024 |
| Estimated Year | 2025 |
| Forecast Period | 2025-2033 |
| Historical Period | 2019-2024 |
| Growth Rate | CAGR of XX% from 2019-2033 |
| Segmentation |
|
Table of Contents
- 1. Introduction
- 1.1. Research Scope
- 1.2. Market Segmentation
- 1.3. Research Methodology
- 1.4. Definitions and Assumptions
- 2. Executive Summary
- 2.1. Introduction
- 3. Market Dynamics
- 3.1. Introduction
- 3.2. Market Drivers
- 3.3. Market Restrains
- 3.4. Market Trends
- 4. Market Factor Analysis
- 4.1. Porters Five Forces
- 4.2. Supply/Value Chain
- 4.3. PESTEL analysis
- 4.4. Market Entropy
- 4.5. Patent/Trademark Analysis
- 5. Global Automotive Data Service Analysis, Insights and Forecast, 2019-2031
- 5.1. Market Analysis, Insights and Forecast - by Application
- 5.1.1. Traffic Management
- 5.1.2. Safety and Security Management
- 5.1.3. Driver and User Behavior Analysis
- 5.1.4. Warranty Analytics
- 5.1.5. Others
- 5.2. Market Analysis, Insights and Forecast - by Types
- 5.2.1. On-premises
- 5.2.2. Cloud-based
- 5.3. Market Analysis, Insights and Forecast - by Region
- 5.3.1. North America
- 5.3.2. South America
- 5.3.3. Europe
- 5.3.4. Middle East & Africa
- 5.3.5. Asia Pacific
- 5.1. Market Analysis, Insights and Forecast - by Application
- 6. North America Automotive Data Service Analysis, Insights and Forecast, 2019-2031
- 6.1. Market Analysis, Insights and Forecast - by Application
- 6.1.1. Traffic Management
- 6.1.2. Safety and Security Management
- 6.1.3. Driver and User Behavior Analysis
- 6.1.4. Warranty Analytics
- 6.1.5. Others
- 6.2. Market Analysis, Insights and Forecast - by Types
- 6.2.1. On-premises
- 6.2.2. Cloud-based
- 6.1. Market Analysis, Insights and Forecast - by Application
- 7. South America Automotive Data Service Analysis, Insights and Forecast, 2019-2031
- 7.1. Market Analysis, Insights and Forecast - by Application
- 7.1.1. Traffic Management
- 7.1.2. Safety and Security Management
- 7.1.3. Driver and User Behavior Analysis
- 7.1.4. Warranty Analytics
- 7.1.5. Others
- 7.2. Market Analysis, Insights and Forecast - by Types
- 7.2.1. On-premises
- 7.2.2. Cloud-based
- 7.1. Market Analysis, Insights and Forecast - by Application
- 8. Europe Automotive Data Service Analysis, Insights and Forecast, 2019-2031
- 8.1. Market Analysis, Insights and Forecast - by Application
- 8.1.1. Traffic Management
- 8.1.2. Safety and Security Management
- 8.1.3. Driver and User Behavior Analysis
- 8.1.4. Warranty Analytics
- 8.1.5. Others
- 8.2. Market Analysis, Insights and Forecast - by Types
- 8.2.1. On-premises
- 8.2.2. Cloud-based
- 8.1. Market Analysis, Insights and Forecast - by Application
- 9. Middle East & Africa Automotive Data Service Analysis, Insights and Forecast, 2019-2031
- 9.1. Market Analysis, Insights and Forecast - by Application
- 9.1.1. Traffic Management
- 9.1.2. Safety and Security Management
- 9.1.3. Driver and User Behavior Analysis
- 9.1.4. Warranty Analytics
- 9.1.5. Others
- 9.2. Market Analysis, Insights and Forecast - by Types
- 9.2.1. On-premises
- 9.2.2. Cloud-based
- 9.1. Market Analysis, Insights and Forecast - by Application
- 10. Asia Pacific Automotive Data Service Analysis, Insights and Forecast, 2019-2031
- 10.1. Market Analysis, Insights and Forecast - by Application
- 10.1.1. Traffic Management
- 10.1.2. Safety and Security Management
- 10.1.3. Driver and User Behavior Analysis
- 10.1.4. Warranty Analytics
- 10.1.5. Others
- 10.2. Market Analysis, Insights and Forecast - by Types
- 10.2.1. On-premises
- 10.2.2. Cloud-based
- 10.1. Market Analysis, Insights and Forecast - by Application
- 11. Competitive Analysis
- 11.1. Global Market Share Analysis 2024
- 11.2. Company Profiles
- 11.2.1 SAP SE
- 11.2.1.1. Overview
- 11.2.1.2. Products
- 11.2.1.3. SWOT Analysis
- 11.2.1.4. Recent Developments
- 11.2.1.5. Financials (Based on Availability)
- 11.2.2 Microsoft
- 11.2.2.1. Overview
- 11.2.2.2. Products
- 11.2.2.3. SWOT Analysis
- 11.2.2.4. Recent Developments
- 11.2.2.5. Financials (Based on Availability)
- 11.2.3 Bosch Software Innovations
- 11.2.3.1. Overview
- 11.2.3.2. Products
- 11.2.3.3. SWOT Analysis
- 11.2.3.4. Recent Developments
- 11.2.3.5. Financials (Based on Availability)
- 11.2.4 IBM
- 11.2.4.1. Overview
- 11.2.4.2. Products
- 11.2.4.3. SWOT Analysis
- 11.2.4.4. Recent Developments
- 11.2.4.5. Financials (Based on Availability)
- 11.2.5 Oracle
- 11.2.5.1. Overview
- 11.2.5.2. Products
- 11.2.5.3. SWOT Analysis
- 11.2.5.4. Recent Developments
- 11.2.5.5. Financials (Based on Availability)
- 11.2.6 ZenDrive
- 11.2.6.1. Overview
- 11.2.6.2. Products
- 11.2.6.3. SWOT Analysis
- 11.2.6.4. Recent Developments
- 11.2.6.5. Financials (Based on Availability)
- 11.2.7 Carfit
- 11.2.7.1. Overview
- 11.2.7.2. Products
- 11.2.7.3. SWOT Analysis
- 11.2.7.4. Recent Developments
- 11.2.7.5. Financials (Based on Availability)
- 11.2.8 Ford Commercial Solutions
- 11.2.8.1. Overview
- 11.2.8.2. Products
- 11.2.8.3. SWOT Analysis
- 11.2.8.4. Recent Developments
- 11.2.8.5. Financials (Based on Availability)
- 11.2.9 Cloudera
- 11.2.9.1. Overview
- 11.2.9.2. Products
- 11.2.9.3. SWOT Analysis
- 11.2.9.4. Recent Developments
- 11.2.9.5. Financials (Based on Availability)
- 11.2.10 Otonomo
- 11.2.10.1. Overview
- 11.2.10.2. Products
- 11.2.10.3. SWOT Analysis
- 11.2.10.4. Recent Developments
- 11.2.10.5. Financials (Based on Availability)
- 11.2.11 Autodata Solutions
- 11.2.11.1. Overview
- 11.2.11.2. Products
- 11.2.11.3. SWOT Analysis
- 11.2.11.4. Recent Developments
- 11.2.11.5. Financials (Based on Availability)
- 11.2.12 Vehicle Data Services
- 11.2.12.1. Overview
- 11.2.12.2. Products
- 11.2.12.3. SWOT Analysis
- 11.2.12.4. Recent Developments
- 11.2.12.5. Financials (Based on Availability)
- 11.2.13 V12
- 11.2.13.1. Overview
- 11.2.13.2. Products
- 11.2.13.3. SWOT Analysis
- 11.2.13.4. Recent Developments
- 11.2.13.5. Financials (Based on Availability)
- 11.2.14 Eclar
- 11.2.14.1. Overview
- 11.2.14.2. Products
- 11.2.14.3. SWOT Analysis
- 11.2.14.4. Recent Developments
- 11.2.14.5. Financials (Based on Availability)
- 11.2.15 Cyzone
- 11.2.15.1. Overview
- 11.2.15.2. Products
- 11.2.15.3. SWOT Analysis
- 11.2.15.4. Recent Developments
- 11.2.15.5. Financials (Based on Availability)
- 11.2.16 Zebrai
- 11.2.16.1. Overview
- 11.2.16.2. Products
- 11.2.16.3. SWOT Analysis
- 11.2.16.4. Recent Developments
- 11.2.16.5. Financials (Based on Availability)
- 11.2.17 Wenfeng
- 11.2.17.1. Overview
- 11.2.17.2. Products
- 11.2.17.3. SWOT Analysis
- 11.2.17.4. Recent Developments
- 11.2.17.5. Financials (Based on Availability)
- 11.2.18 So.Car
- 11.2.18.1. Overview
- 11.2.18.2. Products
- 11.2.18.3. SWOT Analysis
- 11.2.18.4. Recent Developments
- 11.2.18.5. Financials (Based on Availability)
- 11.2.19 Jingzhengu
- 11.2.19.1. Overview
- 11.2.19.2. Products
- 11.2.19.3. SWOT Analysis
- 11.2.19.4. Recent Developments
- 11.2.19.5. Financials (Based on Availability)
- 11.2.20 WAYS
- 11.2.20.1. Overview
- 11.2.20.2. Products
- 11.2.20.3. SWOT Analysis
- 11.2.20.4. Recent Developments
- 11.2.20.5. Financials (Based on Availability)
- 11.2.21 Jingyou Times
- 11.2.21.1. Overview
- 11.2.21.2. Products
- 11.2.21.3. SWOT Analysis
- 11.2.21.4. Recent Developments
- 11.2.21.5. Financials (Based on Availability)
- 11.2.1 SAP SE
List of Figures
- Figure 1: Global Automotive Data Service Revenue Breakdown (million, %) by Region 2024 & 2032
- Figure 2: North America Automotive Data Service Revenue (million), by Application 2024 & 2032
- Figure 3: North America Automotive Data Service Revenue Share (%), by Application 2024 & 2032
- Figure 4: North America Automotive Data Service Revenue (million), by Types 2024 & 2032
- Figure 5: North America Automotive Data Service Revenue Share (%), by Types 2024 & 2032
- Figure 6: North America Automotive Data Service Revenue (million), by Country 2024 & 2032
- Figure 7: North America Automotive Data Service Revenue Share (%), by Country 2024 & 2032
- Figure 8: South America Automotive Data Service Revenue (million), by Application 2024 & 2032
- Figure 9: South America Automotive Data Service Revenue Share (%), by Application 2024 & 2032
- Figure 10: South America Automotive Data Service Revenue (million), by Types 2024 & 2032
- Figure 11: South America Automotive Data Service Revenue Share (%), by Types 2024 & 2032
- Figure 12: South America Automotive Data Service Revenue (million), by Country 2024 & 2032
- Figure 13: South America Automotive Data Service Revenue Share (%), by Country 2024 & 2032
- Figure 14: Europe Automotive Data Service Revenue (million), by Application 2024 & 2032
- Figure 15: Europe Automotive Data Service Revenue Share (%), by Application 2024 & 2032
- Figure 16: Europe Automotive Data Service Revenue (million), by Types 2024 & 2032
- Figure 17: Europe Automotive Data Service Revenue Share (%), by Types 2024 & 2032
- Figure 18: Europe Automotive Data Service Revenue (million), by Country 2024 & 2032
- Figure 19: Europe Automotive Data Service Revenue Share (%), by Country 2024 & 2032
- Figure 20: Middle East & Africa Automotive Data Service Revenue (million), by Application 2024 & 2032
- Figure 21: Middle East & Africa Automotive Data Service Revenue Share (%), by Application 2024 & 2032
- Figure 22: Middle East & Africa Automotive Data Service Revenue (million), by Types 2024 & 2032
- Figure 23: Middle East & Africa Automotive Data Service Revenue Share (%), by Types 2024 & 2032
- Figure 24: Middle East & Africa Automotive Data Service Revenue (million), by Country 2024 & 2032
- Figure 25: Middle East & Africa Automotive Data Service Revenue Share (%), by Country 2024 & 2032
- Figure 26: Asia Pacific Automotive Data Service Revenue (million), by Application 2024 & 2032
- Figure 27: Asia Pacific Automotive Data Service Revenue Share (%), by Application 2024 & 2032
- Figure 28: Asia Pacific Automotive Data Service Revenue (million), by Types 2024 & 2032
- Figure 29: Asia Pacific Automotive Data Service Revenue Share (%), by Types 2024 & 2032
- Figure 30: Asia Pacific Automotive Data Service Revenue (million), by Country 2024 & 2032
- Figure 31: Asia Pacific Automotive Data Service Revenue Share (%), by Country 2024 & 2032
List of Tables
- Table 1: Global Automotive Data Service Revenue million Forecast, by Region 2019 & 2032
- Table 2: Global Automotive Data Service Revenue million Forecast, by Application 2019 & 2032
- Table 3: Global Automotive Data Service Revenue million Forecast, by Types 2019 & 2032
- Table 4: Global Automotive Data Service Revenue million Forecast, by Region 2019 & 2032
- Table 5: Global Automotive Data Service Revenue million Forecast, by Application 2019 & 2032
- Table 6: Global Automotive Data Service Revenue million Forecast, by Types 2019 & 2032
- Table 7: Global Automotive Data Service Revenue million Forecast, by Country 2019 & 2032
- Table 8: United States Automotive Data Service Revenue (million) Forecast, by Application 2019 & 2032
- Table 9: Canada Automotive Data Service Revenue (million) Forecast, by Application 2019 & 2032
- Table 10: Mexico Automotive Data Service Revenue (million) Forecast, by Application 2019 & 2032
- Table 11: Global Automotive Data Service Revenue million Forecast, by Application 2019 & 2032
- Table 12: Global Automotive Data Service Revenue million Forecast, by Types 2019 & 2032
- Table 13: Global Automotive Data Service Revenue million Forecast, by Country 2019 & 2032
- Table 14: Brazil Automotive Data Service Revenue (million) Forecast, by Application 2019 & 2032
- Table 15: Argentina Automotive Data Service Revenue (million) Forecast, by Application 2019 & 2032
- Table 16: Rest of South America Automotive Data Service Revenue (million) Forecast, by Application 2019 & 2032
- Table 17: Global Automotive Data Service Revenue million Forecast, by Application 2019 & 2032
- Table 18: Global Automotive Data Service Revenue million Forecast, by Types 2019 & 2032
- Table 19: Global Automotive Data Service Revenue million Forecast, by Country 2019 & 2032
- Table 20: United Kingdom Automotive Data Service Revenue (million) Forecast, by Application 2019 & 2032
- Table 21: Germany Automotive Data Service Revenue (million) Forecast, by Application 2019 & 2032
- Table 22: France Automotive Data Service Revenue (million) Forecast, by Application 2019 & 2032
- Table 23: Italy Automotive Data Service Revenue (million) Forecast, by Application 2019 & 2032
- Table 24: Spain Automotive Data Service Revenue (million) Forecast, by Application 2019 & 2032
- Table 25: Russia Automotive Data Service Revenue (million) Forecast, by Application 2019 & 2032
- Table 26: Benelux Automotive Data Service Revenue (million) Forecast, by Application 2019 & 2032
- Table 27: Nordics Automotive Data Service Revenue (million) Forecast, by Application 2019 & 2032
- Table 28: Rest of Europe Automotive Data Service Revenue (million) Forecast, by Application 2019 & 2032
- Table 29: Global Automotive Data Service Revenue million Forecast, by Application 2019 & 2032
- Table 30: Global Automotive Data Service Revenue million Forecast, by Types 2019 & 2032
- Table 31: Global Automotive Data Service Revenue million Forecast, by Country 2019 & 2032
- Table 32: Turkey Automotive Data Service Revenue (million) Forecast, by Application 2019 & 2032
- Table 33: Israel Automotive Data Service Revenue (million) Forecast, by Application 2019 & 2032
- Table 34: GCC Automotive Data Service Revenue (million) Forecast, by Application 2019 & 2032
- Table 35: North Africa Automotive Data Service Revenue (million) Forecast, by Application 2019 & 2032
- Table 36: South Africa Automotive Data Service Revenue (million) Forecast, by Application 2019 & 2032
- Table 37: Rest of Middle East & Africa Automotive Data Service Revenue (million) Forecast, by Application 2019 & 2032
- Table 38: Global Automotive Data Service Revenue million Forecast, by Application 2019 & 2032
- Table 39: Global Automotive Data Service Revenue million Forecast, by Types 2019 & 2032
- Table 40: Global Automotive Data Service Revenue million Forecast, by Country 2019 & 2032
- Table 41: China Automotive Data Service Revenue (million) Forecast, by Application 2019 & 2032
- Table 42: India Automotive Data Service Revenue (million) Forecast, by Application 2019 & 2032
- Table 43: Japan Automotive Data Service Revenue (million) Forecast, by Application 2019 & 2032
- Table 44: South Korea Automotive Data Service Revenue (million) Forecast, by Application 2019 & 2032
- Table 45: ASEAN Automotive Data Service Revenue (million) Forecast, by Application 2019 & 2032
- Table 46: Oceania Automotive Data Service Revenue (million) Forecast, by Application 2019 & 2032
- Table 47: Rest of Asia Pacific Automotive Data Service Revenue (million) Forecast, by Application 2019 & 2032
Frequently Asked Questions
1. What is the projected Compound Annual Growth Rate (CAGR) of the Automotive Data Service?
The projected CAGR is approximately XX%.
2. Which companies are prominent players in the Automotive Data Service?
Key companies in the market include SAP SE, Microsoft, Bosch Software Innovations, IBM, Oracle, ZenDrive, Carfit, Ford Commercial Solutions, Cloudera, Otonomo, Autodata Solutions, Vehicle Data Services, V12, Eclar, Cyzone, Zebrai, Wenfeng, So.Car, Jingzhengu, WAYS, Jingyou Times.
3. What are the main segments of the Automotive Data Service?
The market segments include Application, Types.
4. Can you provide details about the market size?
The market size is estimated to be USD XXX million as of 2022.
5. What are some drivers contributing to market growth?
N/A
6. What are the notable trends driving market growth?
N/A
7. Are there any restraints impacting market growth?
N/A
8. Can you provide examples of recent developments in the market?
N/A
9. What pricing options are available for accessing the report?
Pricing options include single-user, multi-user, and enterprise licenses priced at USD 2900.00, USD 4350.00, and USD 5800.00 respectively.
10. Is the market size provided in terms of value or volume?
The market size is provided in terms of value, measured in million.
11. Are there any specific market keywords associated with the report?
Yes, the market keyword associated with the report is "Automotive Data Service," which aids in identifying and referencing the specific market segment covered.
12. How do I determine which pricing option suits my needs best?
The pricing options vary based on user requirements and access needs. Individual users may opt for single-user licenses, while businesses requiring broader access may choose multi-user or enterprise licenses for cost-effective access to the report.
13. Are there any additional resources or data provided in the Automotive Data Service report?
While the report offers comprehensive insights, it's advisable to review the specific contents or supplementary materials provided to ascertain if additional resources or data are available.
14. How can I stay updated on further developments or reports in the Automotive Data Service?
To stay informed about further developments, trends, and reports in the Automotive Data Service, consider subscribing to industry newsletters, following relevant companies and organizations, or regularly checking reputable industry news sources and publications.
Methodology
Step 1 - Identification of Relevant Samples Size from Population Database


Step 2 - Approaches for Defining Global Market Size (Value, Volume* & Price*)

Note*: In applicable scenarios
Step 3 - Data Sources
Primary Research
- Web Analytics
- Survey Reports
- Research Institute
- Latest Research Reports
- Opinion Leaders
Secondary Research
- Annual Reports
- White Paper
- Latest Press Release
- Industry Association
- Paid Database
- Investor Presentations

Step 4 - Data Triangulation
Involves using different sources of information in order to increase the validity of a study
These sources are likely to be stakeholders in a program - participants, other researchers, program staff, other community members, and so on.
Then we put all data in single framework & apply various statistical tools to find out the dynamic on the market.
During the analysis stage, feedback from the stakeholder groups would be compared to determine areas of agreement as well as areas of divergence


