
Key Insights
The Asia Pacific chemical sensors market, exhibiting a robust Compound Annual Growth Rate (CAGR) of 6.10%, is poised for significant expansion throughout the forecast period (2025-2033). Driven by burgeoning industrial automation, stringent environmental regulations, and the increasing demand for advanced healthcare technologies across the region, the market is witnessing a surge in adoption across diverse applications. Key growth drivers include the expanding manufacturing sector in China and India, coupled with the rising adoption of sophisticated environmental monitoring systems in response to growing pollution concerns. The increasing prevalence of chronic diseases is further fueling demand within the medical diagnostics segment. Technological advancements, particularly in miniaturization, improved sensitivity, and wireless connectivity, are enhancing the capabilities and appeal of chemical sensors, driving market penetration. While challenges remain in terms of high initial investment costs and the need for specialized expertise, these are being mitigated by continuous innovation and the availability of cost-effective solutions. Segmentation by product type reveals a strong preference for electrochemical and optical sensors, owing to their versatility and reliability. The dominance of China, India, Japan, and South Korea in the regional market underscores the importance of localized production and distribution strategies. Future growth is anticipated to be influenced by government initiatives supporting technological advancement, robust infrastructure development, and the rising awareness of environmental protection and public health.
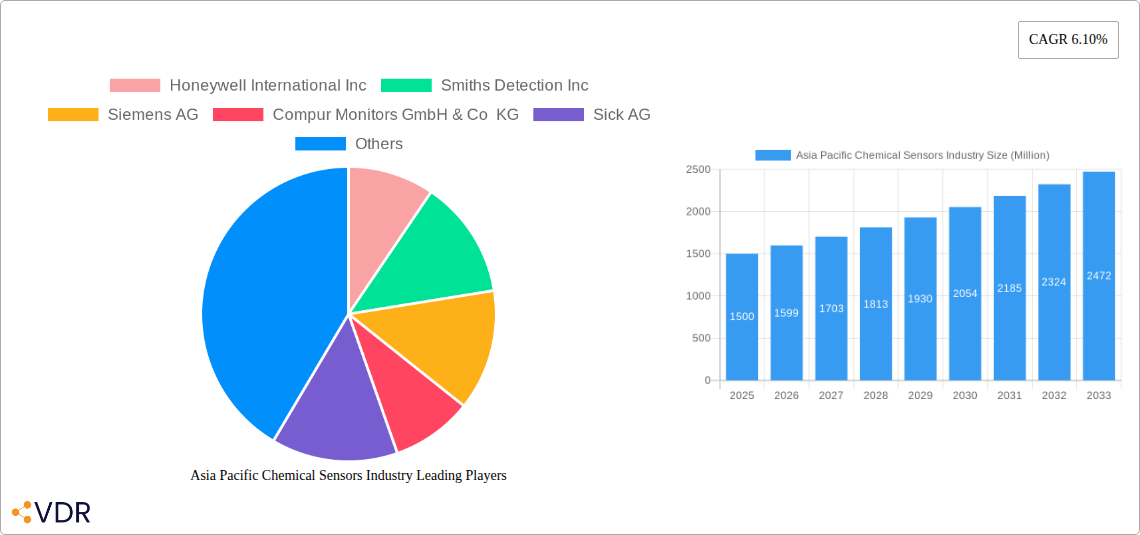
The market's segmentation by application highlights the crucial role of chemical sensors in various sectors. Industrial applications, particularly in process control and monitoring, constitute a substantial market share. Medical applications are experiencing strong growth, driven by the development of point-of-care diagnostics and wearable health monitoring devices. Environmental monitoring, propelled by increasing environmental awareness and regulatory pressure, showcases significant potential. The defense and homeland security sector contributes to the overall market demand, leveraging chemical sensors for threat detection and security applications. Further growth will be influenced by factors such as the expanding digital economy, the rise of smart cities, and the increasing integration of sensor technologies in Internet of Things (IoT) applications. Companies like Honeywell International Inc., Smiths Detection Inc., and Siemens AG are leading players, shaping market trends through continuous innovation and strategic partnerships. The Asia-Pacific region's economic growth, technological progress, and rising consumer demand will continue to propel the chemical sensors market towards substantial future expansion.
Asia Pacific Chemical Sensors Industry: 2019-2033 Market Report
This comprehensive report provides an in-depth analysis of the Asia Pacific chemical sensors industry, covering market dynamics, growth trends, key players, and future outlook from 2019 to 2033. With a focus on key segments – by product type (electrochemical, optical, pellistor/catalytic bead, others), application (industrial, medical, environmental monitoring, defense & homeland security, others), and country (China, India, Japan, South Korea, others) – this report offers invaluable insights for industry professionals, investors, and strategic decision-makers. The report uses 2025 as its base year and provides forecasts until 2033, with historical data from 2019-2024. Market sizes are presented in million units.
Asia Pacific Chemical Sensors Industry Market Dynamics & Structure
The Asia Pacific chemical sensors market is characterized by moderate concentration, with a few major players holding significant market share. Technological innovation, driven by advancements in miniaturization, improved sensitivity, and wireless connectivity, is a key growth driver. Stringent environmental regulations across the region, particularly in China and India, are further boosting demand. However, the market faces challenges from the availability of competitive substitutes and high initial investment costs for advanced sensor technologies. Mergers and acquisitions (M&A) activity has been relatively low in recent years (xx deals in 2024), but is expected to increase as larger players seek to consolidate their market positions.
- Market Concentration: Moderately concentrated, with top 5 players holding approximately xx% market share in 2024.
- Technological Innovation: Focus on miniaturization, improved sensitivity, and wireless connectivity. Major barriers include high R&D costs and integration challenges.
- Regulatory Framework: Stringent environmental regulations in China and India are driving demand.
- Competitive Substitutes: Presence of alternative technologies limits market growth for certain applications.
- End-User Demographics: Rapid industrialization and urbanization in developing economies drive significant demand.
- M&A Trends: Low M&A activity historically, with potential for increased activity in the forecast period.
Asia Pacific Chemical Sensors Industry Growth Trends & Insights
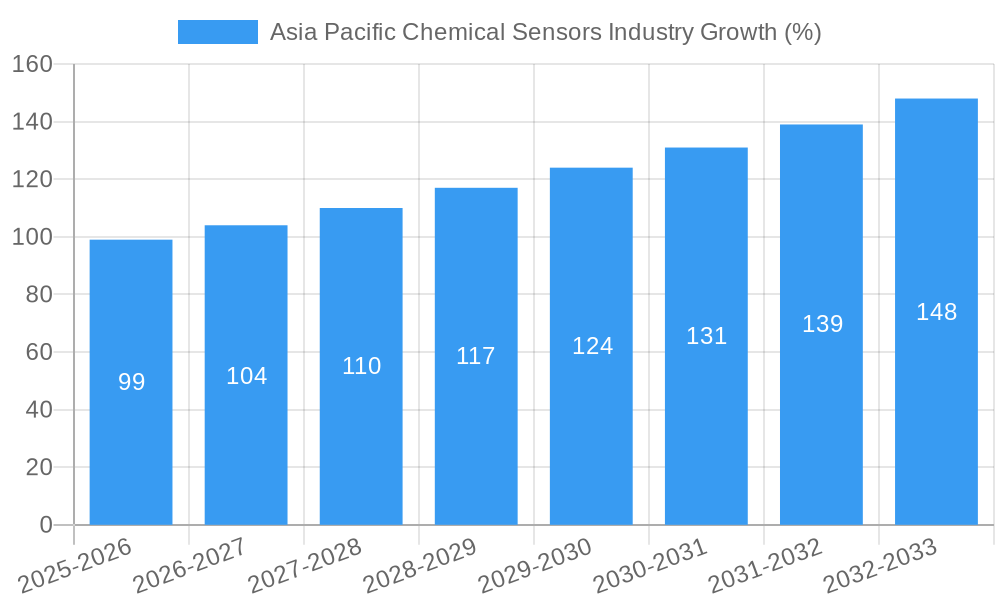
The Asia Pacific chemical sensors market experienced significant growth during the historical period (2019-2024), with a CAGR of xx%. This growth is attributed to several factors, including rising industrialization, increasing environmental concerns, and advancements in healthcare infrastructure. The industrial segment dominates the market, accounting for xx% of total demand in 2024. However, the medical and environmental monitoring segments are projected to exhibit faster growth rates in the forecast period, driven by increasing healthcare expenditure and stricter environmental regulations. The adoption rate of advanced sensor technologies is gradually increasing, particularly in developed economies like Japan and South Korea. Consumer behavior is shifting towards preference for more accurate, reliable, and cost-effective sensors.
Market size evolution, adoption rates, and technological disruption are all interlinked factors driving the significant market growth in this region.
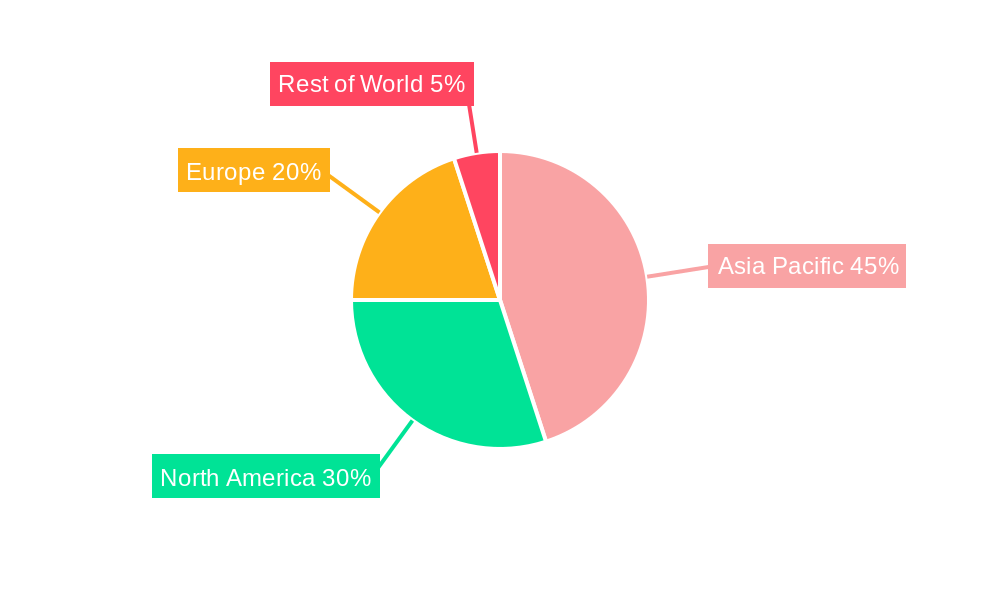
Dominant Regions, Countries, or Segments in Asia Pacific Chemical Sensors Industry
China is the dominant market for chemical sensors in the Asia Pacific region, accounting for xx% of the total market in 2024. This dominance is attributed to its large and rapidly growing industrial sector, coupled with supportive government policies promoting technological advancement and environmental protection. India is another key market, exhibiting high growth potential driven by rising industrialization and increasing government investments in infrastructure development. Within product types, electrochemical sensors hold the largest market share (xx%), followed by optical sensors (xx%). The industrial application segment accounts for the majority of demand (xx%), while the medical and environmental monitoring segments are projected to witness significant growth in the coming years.
- China: Largest market driven by industrial growth and supportive government policies.
- India: High growth potential due to rising industrialization and infrastructure investments.
- Japan & South Korea: High technological advancement and adoption rates of advanced sensor technology.
- Electrochemical Sensors: Largest market share due to cost-effectiveness and wide applicability.
- Industrial Applications: Dominant segment driven by high demand from various industries.
Asia Pacific Chemical Sensors Industry Product Landscape
The Asia Pacific chemical sensor market showcases continuous product innovation, with a focus on enhancing accuracy, sensitivity, and miniaturization. Miniaturized sensors, integrated with wireless communication capabilities, are gaining popularity for real-time monitoring applications. Advancements in materials science have led to the development of sensors with improved durability and longer lifespans. Unique selling propositions include improved signal-to-noise ratios, faster response times, and wider operating temperature ranges.
Key Drivers, Barriers & Challenges in Asia Pacific Chemical Sensors Industry
Key Drivers:
- Rising industrialization and urbanization.
- Increasing environmental regulations and monitoring needs.
- Advancements in sensor technology and miniaturization.
- Growing demand for accurate and reliable data in various applications.
Key Challenges:
- High initial investment costs for advanced sensor technologies.
- Complex integration requirements for some applications.
- Supply chain disruptions, particularly for certain raw materials.
- Intense competition from both domestic and international players. This competition has resulted in a price pressure of approximately xx% in 2024.
Emerging Opportunities in Asia Pacific Chemical Sensors Industry
- Growing demand for portable and wearable sensors for healthcare applications.
- Expansion into emerging applications, such as smart agriculture and environmental monitoring.
- Development of sensors for detecting specific pollutants and gases.
- Increased focus on data analytics and sensor networking for improved decision-making.
Growth Accelerators in the Asia Pacific Chemical Sensors Industry
Technological advancements, strategic partnerships and collaborations, and market expansion into niche applications are key catalysts driving long-term growth in the Asia Pacific chemical sensors industry. Investments in R&D are crucial for developing more efficient and cost-effective sensor technologies. Furthermore, strategic alliances between sensor manufacturers and end-users will enable better integration and adoption of advanced sensor technologies. Finally, exploring new applications, such as in smart agriculture and environmental monitoring, will lead to new market opportunities.
Key Players Shaping the Asia Pacific Chemical Sensors Industry Market
- Honeywell International Inc
- Smiths Detection Inc
- Siemens AG
- Compur Monitors GmbH & Co KG
- Sick AG
- Ocean Insight (Halma PLC)
- General Electric Company
- Pepperl+Fuchs Group
- AirTest Technologies Inc
- SenseAir AB
Notable Milestones in Asia Pacific Chemical Sensors Industry Sector
- 2021 Q3: Launch of a new miniaturized electrochemical sensor by Honeywell International Inc.
- 2022 Q1: Siemens AG announced a strategic partnership with a leading chemical manufacturer in China.
- 2023 Q2: Introduction of a new optical sensor with improved sensitivity by Ocean Insight (Halma PLC).
- 2024 Q4: Acquisition of a smaller sensor company by Sick AG. (Details of this acquisition are not available for inclusion in this section.)
In-Depth Asia Pacific Chemical Sensors Industry Market Outlook
The Asia Pacific chemical sensors market is poised for continued growth in the forecast period (2025-2033), driven by technological advancements, increasing industrialization, and growing environmental concerns. Strategic investments in R&D, focusing on miniaturization, improved accuracy, and wireless connectivity, will be crucial for success. Expansion into new applications, such as smart agriculture and the Internet of Things (IoT), will offer significant growth opportunities. Companies that effectively leverage technological advancements and establish strategic partnerships will be best positioned to capture market share and drive long-term growth in this dynamic industry.
Asia Pacific Chemical Sensors Industry Segmentation
-
1. Product Type
- 1.1. Electrochemical
- 1.2. Optical
- 1.3. Pellistor/Catalytic Bead
- 1.4. Other Product Types
-
2. Application
- 2.1. Industrial
- 2.2. Medical
- 2.3. Environmental Monitoring
- 2.4. Defense and Homeland Security
- 2.5. Other Applications
Asia Pacific Chemical Sensors Industry Segmentation By Geography
-
1. Asia Pacific
- 1.1. China
- 1.2. Japan
- 1.3. South Korea
- 1.4. India
- 1.5. Australia
- 1.6. New Zealand
- 1.7. Indonesia
- 1.8. Malaysia
- 1.9. Singapore
- 1.10. Thailand
- 1.11. Vietnam
- 1.12. Philippines
Asia Pacific Chemical Sensors Industry REPORT HIGHLIGHTS
| Aspects | Details |
|---|---|
| Study Period | 2019-2033 |
| Base Year | 2024 |
| Estimated Year | 2025 |
| Forecast Period | 2025-2033 |
| Historical Period | 2019-2024 |
| Growth Rate | CAGR of 6.10% from 2019-2033 |
| Segmentation |
|
Table of Contents
- 1. Introduction
- 1.1. Research Scope
- 1.2. Market Segmentation
- 1.3. Research Methodology
- 1.4. Definitions and Assumptions
- 2. Executive Summary
- 2.1. Introduction
- 3. Market Dynamics
- 3.1. Introduction
- 3.2. Market Drivers
- 3.2.1. ; Growing Developments in Miniaturised and Portable Electrochemical Sensors; Increased Investments in New Plants in Oil and Gas
- 3.3. Market Restrains
- 3.3.1. Lower Awareness of Facility Management Services
- 3.4. Market Trends
- 3.4.1. Defense Security to Register the Fastest Growth
- 4. Market Factor Analysis
- 4.1. Porters Five Forces
- 4.2. Supply/Value Chain
- 4.3. PESTEL analysis
- 4.4. Market Entropy
- 4.5. Patent/Trademark Analysis
- 5. Asia Pacific Chemical Sensors Industry Analysis, Insights and Forecast, 2019-2031
- 5.1. Market Analysis, Insights and Forecast - by Product Type
- 5.1.1. Electrochemical
- 5.1.2. Optical
- 5.1.3. Pellistor/Catalytic Bead
- 5.1.4. Other Product Types
- 5.2. Market Analysis, Insights and Forecast - by Application
- 5.2.1. Industrial
- 5.2.2. Medical
- 5.2.3. Environmental Monitoring
- 5.2.4. Defense and Homeland Security
- 5.2.5. Other Applications
- 5.3. Market Analysis, Insights and Forecast - by Region
- 5.3.1. Asia Pacific
- 5.1. Market Analysis, Insights and Forecast - by Product Type
- 6. China Asia Pacific Chemical Sensors Industry Analysis, Insights and Forecast, 2019-2031
- 7. Japan Asia Pacific Chemical Sensors Industry Analysis, Insights and Forecast, 2019-2031
- 8. India Asia Pacific Chemical Sensors Industry Analysis, Insights and Forecast, 2019-2031
- 9. South Korea Asia Pacific Chemical Sensors Industry Analysis, Insights and Forecast, 2019-2031
- 10. Taiwan Asia Pacific Chemical Sensors Industry Analysis, Insights and Forecast, 2019-2031
- 11. Australia Asia Pacific Chemical Sensors Industry Analysis, Insights and Forecast, 2019-2031
- 12. Rest of Asia-Pacific Asia Pacific Chemical Sensors Industry Analysis, Insights and Forecast, 2019-2031
- 13. Competitive Analysis
- 13.1. Market Share Analysis 2024
- 13.2. Company Profiles
- 13.2.1 Honeywell International Inc
- 13.2.1.1. Overview
- 13.2.1.2. Products
- 13.2.1.3. SWOT Analysis
- 13.2.1.4. Recent Developments
- 13.2.1.5. Financials (Based on Availability)
- 13.2.2 Smiths Detection Inc
- 13.2.2.1. Overview
- 13.2.2.2. Products
- 13.2.2.3. SWOT Analysis
- 13.2.2.4. Recent Developments
- 13.2.2.5. Financials (Based on Availability)
- 13.2.3 Siemens AG
- 13.2.3.1. Overview
- 13.2.3.2. Products
- 13.2.3.3. SWOT Analysis
- 13.2.3.4. Recent Developments
- 13.2.3.5. Financials (Based on Availability)
- 13.2.4 Compur Monitors GmbH & Co KG
- 13.2.4.1. Overview
- 13.2.4.2. Products
- 13.2.4.3. SWOT Analysis
- 13.2.4.4. Recent Developments
- 13.2.4.5. Financials (Based on Availability)
- 13.2.5 Sick AG
- 13.2.5.1. Overview
- 13.2.5.2. Products
- 13.2.5.3. SWOT Analysis
- 13.2.5.4. Recent Developments
- 13.2.5.5. Financials (Based on Availability)
- 13.2.6 Ocean Insight (Halma PLC)
- 13.2.6.1. Overview
- 13.2.6.2. Products
- 13.2.6.3. SWOT Analysis
- 13.2.6.4. Recent Developments
- 13.2.6.5. Financials (Based on Availability)
- 13.2.7 General Electric Company
- 13.2.7.1. Overview
- 13.2.7.2. Products
- 13.2.7.3. SWOT Analysis
- 13.2.7.4. Recent Developments
- 13.2.7.5. Financials (Based on Availability)
- 13.2.8 Pepperl+Fuchs Group
- 13.2.8.1. Overview
- 13.2.8.2. Products
- 13.2.8.3. SWOT Analysis
- 13.2.8.4. Recent Developments
- 13.2.8.5. Financials (Based on Availability)
- 13.2.9 AirTest Technologies Inc
- 13.2.9.1. Overview
- 13.2.9.2. Products
- 13.2.9.3. SWOT Analysis
- 13.2.9.4. Recent Developments
- 13.2.9.5. Financials (Based on Availability)
- 13.2.10 SenseAir AB
- 13.2.10.1. Overview
- 13.2.10.2. Products
- 13.2.10.3. SWOT Analysis
- 13.2.10.4. Recent Developments
- 13.2.10.5. Financials (Based on Availability)
- 13.2.1 Honeywell International Inc
List of Figures
- Figure 1: Asia Pacific Chemical Sensors Industry Revenue Breakdown (Million, %) by Product 2024 & 2032
- Figure 2: Asia Pacific Chemical Sensors Industry Share (%) by Company 2024
List of Tables
- Table 1: Asia Pacific Chemical Sensors Industry Revenue Million Forecast, by Region 2019 & 2032
- Table 2: Asia Pacific Chemical Sensors Industry Volume K Unit Forecast, by Region 2019 & 2032
- Table 3: Asia Pacific Chemical Sensors Industry Revenue Million Forecast, by Product Type 2019 & 2032
- Table 4: Asia Pacific Chemical Sensors Industry Volume K Unit Forecast, by Product Type 2019 & 2032
- Table 5: Asia Pacific Chemical Sensors Industry Revenue Million Forecast, by Application 2019 & 2032
- Table 6: Asia Pacific Chemical Sensors Industry Volume K Unit Forecast, by Application 2019 & 2032
- Table 7: Asia Pacific Chemical Sensors Industry Revenue Million Forecast, by Region 2019 & 2032
- Table 8: Asia Pacific Chemical Sensors Industry Volume K Unit Forecast, by Region 2019 & 2032
- Table 9: Asia Pacific Chemical Sensors Industry Revenue Million Forecast, by Country 2019 & 2032
- Table 10: Asia Pacific Chemical Sensors Industry Volume K Unit Forecast, by Country 2019 & 2032
- Table 11: China Asia Pacific Chemical Sensors Industry Revenue (Million) Forecast, by Application 2019 & 2032
- Table 12: China Asia Pacific Chemical Sensors Industry Volume (K Unit) Forecast, by Application 2019 & 2032
- Table 13: Japan Asia Pacific Chemical Sensors Industry Revenue (Million) Forecast, by Application 2019 & 2032
- Table 14: Japan Asia Pacific Chemical Sensors Industry Volume (K Unit) Forecast, by Application 2019 & 2032
- Table 15: India Asia Pacific Chemical Sensors Industry Revenue (Million) Forecast, by Application 2019 & 2032
- Table 16: India Asia Pacific Chemical Sensors Industry Volume (K Unit) Forecast, by Application 2019 & 2032
- Table 17: South Korea Asia Pacific Chemical Sensors Industry Revenue (Million) Forecast, by Application 2019 & 2032
- Table 18: South Korea Asia Pacific Chemical Sensors Industry Volume (K Unit) Forecast, by Application 2019 & 2032
- Table 19: Taiwan Asia Pacific Chemical Sensors Industry Revenue (Million) Forecast, by Application 2019 & 2032
- Table 20: Taiwan Asia Pacific Chemical Sensors Industry Volume (K Unit) Forecast, by Application 2019 & 2032
- Table 21: Australia Asia Pacific Chemical Sensors Industry Revenue (Million) Forecast, by Application 2019 & 2032
- Table 22: Australia Asia Pacific Chemical Sensors Industry Volume (K Unit) Forecast, by Application 2019 & 2032
- Table 23: Rest of Asia-Pacific Asia Pacific Chemical Sensors Industry Revenue (Million) Forecast, by Application 2019 & 2032
- Table 24: Rest of Asia-Pacific Asia Pacific Chemical Sensors Industry Volume (K Unit) Forecast, by Application 2019 & 2032
- Table 25: Asia Pacific Chemical Sensors Industry Revenue Million Forecast, by Product Type 2019 & 2032
- Table 26: Asia Pacific Chemical Sensors Industry Volume K Unit Forecast, by Product Type 2019 & 2032
- Table 27: Asia Pacific Chemical Sensors Industry Revenue Million Forecast, by Application 2019 & 2032
- Table 28: Asia Pacific Chemical Sensors Industry Volume K Unit Forecast, by Application 2019 & 2032
- Table 29: Asia Pacific Chemical Sensors Industry Revenue Million Forecast, by Country 2019 & 2032
- Table 30: Asia Pacific Chemical Sensors Industry Volume K Unit Forecast, by Country 2019 & 2032
- Table 31: China Asia Pacific Chemical Sensors Industry Revenue (Million) Forecast, by Application 2019 & 2032
- Table 32: China Asia Pacific Chemical Sensors Industry Volume (K Unit) Forecast, by Application 2019 & 2032
- Table 33: Japan Asia Pacific Chemical Sensors Industry Revenue (Million) Forecast, by Application 2019 & 2032
- Table 34: Japan Asia Pacific Chemical Sensors Industry Volume (K Unit) Forecast, by Application 2019 & 2032
- Table 35: South Korea Asia Pacific Chemical Sensors Industry Revenue (Million) Forecast, by Application 2019 & 2032
- Table 36: South Korea Asia Pacific Chemical Sensors Industry Volume (K Unit) Forecast, by Application 2019 & 2032
- Table 37: India Asia Pacific Chemical Sensors Industry Revenue (Million) Forecast, by Application 2019 & 2032
- Table 38: India Asia Pacific Chemical Sensors Industry Volume (K Unit) Forecast, by Application 2019 & 2032
- Table 39: Australia Asia Pacific Chemical Sensors Industry Revenue (Million) Forecast, by Application 2019 & 2032
- Table 40: Australia Asia Pacific Chemical Sensors Industry Volume (K Unit) Forecast, by Application 2019 & 2032
- Table 41: New Zealand Asia Pacific Chemical Sensors Industry Revenue (Million) Forecast, by Application 2019 & 2032
- Table 42: New Zealand Asia Pacific Chemical Sensors Industry Volume (K Unit) Forecast, by Application 2019 & 2032
- Table 43: Indonesia Asia Pacific Chemical Sensors Industry Revenue (Million) Forecast, by Application 2019 & 2032
- Table 44: Indonesia Asia Pacific Chemical Sensors Industry Volume (K Unit) Forecast, by Application 2019 & 2032
- Table 45: Malaysia Asia Pacific Chemical Sensors Industry Revenue (Million) Forecast, by Application 2019 & 2032
- Table 46: Malaysia Asia Pacific Chemical Sensors Industry Volume (K Unit) Forecast, by Application 2019 & 2032
- Table 47: Singapore Asia Pacific Chemical Sensors Industry Revenue (Million) Forecast, by Application 2019 & 2032
- Table 48: Singapore Asia Pacific Chemical Sensors Industry Volume (K Unit) Forecast, by Application 2019 & 2032
- Table 49: Thailand Asia Pacific Chemical Sensors Industry Revenue (Million) Forecast, by Application 2019 & 2032
- Table 50: Thailand Asia Pacific Chemical Sensors Industry Volume (K Unit) Forecast, by Application 2019 & 2032
- Table 51: Vietnam Asia Pacific Chemical Sensors Industry Revenue (Million) Forecast, by Application 2019 & 2032
- Table 52: Vietnam Asia Pacific Chemical Sensors Industry Volume (K Unit) Forecast, by Application 2019 & 2032
- Table 53: Philippines Asia Pacific Chemical Sensors Industry Revenue (Million) Forecast, by Application 2019 & 2032
- Table 54: Philippines Asia Pacific Chemical Sensors Industry Volume (K Unit) Forecast, by Application 2019 & 2032
Frequently Asked Questions
1. What is the projected Compound Annual Growth Rate (CAGR) of the Asia Pacific Chemical Sensors Industry?
The projected CAGR is approximately 6.10%.
2. Which companies are prominent players in the Asia Pacific Chemical Sensors Industry?
Key companies in the market include Honeywell International Inc, Smiths Detection Inc, Siemens AG, Compur Monitors GmbH & Co KG, Sick AG, Ocean Insight (Halma PLC), General Electric Company, Pepperl+Fuchs Group, AirTest Technologies Inc, SenseAir AB.
3. What are the main segments of the Asia Pacific Chemical Sensors Industry?
The market segments include Product Type, Application.
4. Can you provide details about the market size?
The market size is estimated to be USD XX Million as of 2022.
5. What are some drivers contributing to market growth?
; Growing Developments in Miniaturised and Portable Electrochemical Sensors; Increased Investments in New Plants in Oil and Gas.
6. What are the notable trends driving market growth?
Defense Security to Register the Fastest Growth.
7. Are there any restraints impacting market growth?
Lower Awareness of Facility Management Services.
8. Can you provide examples of recent developments in the market?
N/A
9. What pricing options are available for accessing the report?
Pricing options include single-user, multi-user, and enterprise licenses priced at USD 3800, USD 4500, and USD 5800 respectively.
10. Is the market size provided in terms of value or volume?
The market size is provided in terms of value, measured in Million and volume, measured in K Unit.
11. Are there any specific market keywords associated with the report?
Yes, the market keyword associated with the report is "Asia Pacific Chemical Sensors Industry," which aids in identifying and referencing the specific market segment covered.
12. How do I determine which pricing option suits my needs best?
The pricing options vary based on user requirements and access needs. Individual users may opt for single-user licenses, while businesses requiring broader access may choose multi-user or enterprise licenses for cost-effective access to the report.
13. Are there any additional resources or data provided in the Asia Pacific Chemical Sensors Industry report?
While the report offers comprehensive insights, it's advisable to review the specific contents or supplementary materials provided to ascertain if additional resources or data are available.
14. How can I stay updated on further developments or reports in the Asia Pacific Chemical Sensors Industry?
To stay informed about further developments, trends, and reports in the Asia Pacific Chemical Sensors Industry, consider subscribing to industry newsletters, following relevant companies and organizations, or regularly checking reputable industry news sources and publications.
Methodology
Step 1 - Identification of Relevant Samples Size from Population Database


Step 2 - Approaches for Defining Global Market Size (Value, Volume* & Price*)

Note*: In applicable scenarios
Step 3 - Data Sources
Primary Research
- Web Analytics
- Survey Reports
- Research Institute
- Latest Research Reports
- Opinion Leaders
Secondary Research
- Annual Reports
- White Paper
- Latest Press Release
- Industry Association
- Paid Database
- Investor Presentations

Step 4 - Data Triangulation
Involves using different sources of information in order to increase the validity of a study
These sources are likely to be stakeholders in a program - participants, other researchers, program staff, other community members, and so on.
Then we put all data in single framework & apply various statistical tools to find out the dynamic on the market.
During the analysis stage, feedback from the stakeholder groups would be compared to determine areas of agreement as well as areas of divergence


