
Key Insights
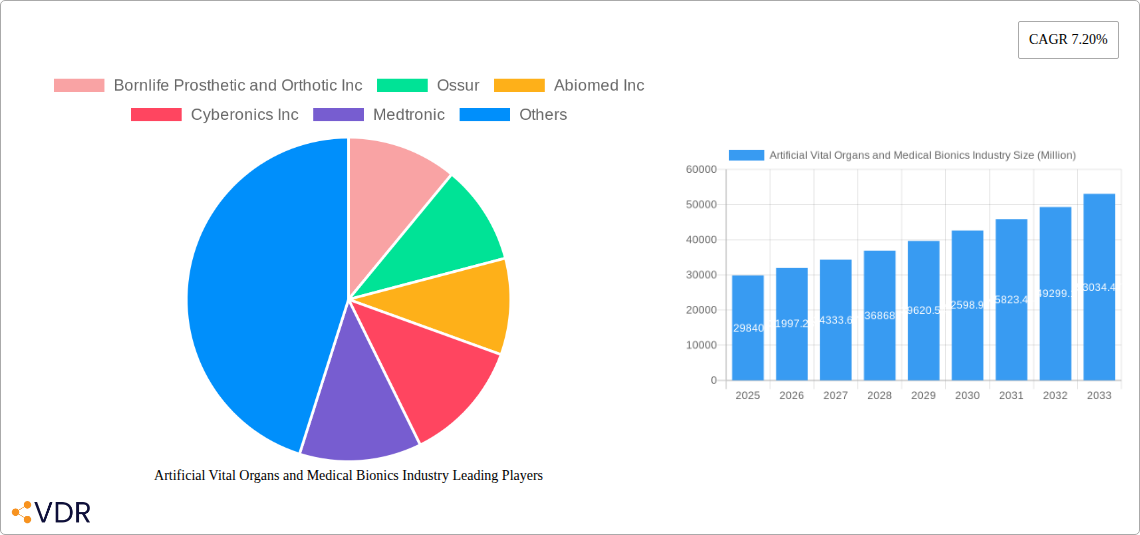
The global artificial vital organs and medical bionics market is experiencing robust growth, projected to reach a substantial size driven by several key factors. The market's Compound Annual Growth Rate (CAGR) of 7.20% from 2019-2033 indicates a significant expansion, with a market value of $29.84 billion in 2025. This growth is fueled by increasing prevalence of chronic diseases like heart failure and diabetes necessitating artificial organs, coupled with advancements in biomaterials, miniaturization technologies, and surgical techniques leading to improved outcomes and patient acceptance. The rising geriatric population, particularly in developed regions like North America and Europe, further contributes to heightened demand for these life-enhancing technologies. Technological innovations within bionics, such as advanced prosthetics with improved functionality and brain-computer interfaces, are expanding the application areas and propelling market expansion. While regulatory hurdles and high costs associated with these advanced technologies remain challenges, ongoing research and development, coupled with increasing healthcare expenditure, are expected to mitigate these restraints and stimulate market growth across diverse segments including artificial hearts, artificial kidneys, bionic limbs, and vision bionics.
Specific segments like artificial hearts and bionic limbs are anticipated to show particularly strong growth due to technological breakthroughs and rising demand. North America is projected to maintain a dominant market share due to robust healthcare infrastructure and high adoption rates. However, the Asia Pacific region, particularly China and India, is poised for significant growth fueled by increasing disposable incomes, improving healthcare access, and a growing awareness of these life-altering technologies. Competitive landscape analysis suggests a mix of established players like Medtronic and Boston Scientific, along with emerging companies specializing in niche segments. The overall market is characterized by continuous innovation, strategic partnerships, and mergers & acquisitions, signifying the promising outlook and attracting considerable investment in research and development. Future growth hinges on further technological advancements, improved affordability, and enhanced accessibility to these life-saving solutions.
Artificial Vital Organs and Medical Bionics Industry Market Report: 2019-2033
This comprehensive report provides an in-depth analysis of the Artificial Vital Organs and Medical Bionics industry, encompassing market dynamics, growth trends, regional dominance, product landscape, and key players. The study period spans from 2019 to 2033, with 2025 serving as both the base and estimated year. The report forecasts market performance from 2025 to 2033, leveraging data from the historical period of 2019-2024. The market is segmented by Type (Artificial Organs and Bionics) and further categorized into specific organ types (Artificial Heart, Kidney, Liver, Pancreas, Lungs) and bionic applications (Ear, Vision, Exoskeletons, Limbs, Brain, Cardiac). Key companies analyzed include Bornlife Prosthetic and Orthotic Inc, Ossur, Abiomed Inc, Cyberonics Inc, Medtronic, Baxter, Asahi Kasei Medical Co Ltd, Getinge AB, Ekso Bionics Holdings Inc, Boston Scientific Corporation, Sonova, Berlin Heart GmbH (list not exhaustive). The total market value is projected to reach xx Million by 2033.
Artificial Vital Organs and Medical Bionics Industry Market Dynamics & Structure
The Artificial Vital Organs and Medical Bionics market is characterized by moderate concentration, with a few large players dominating specific segments. Technological innovation, driven by advancements in materials science, bioengineering, and AI, is a key growth driver. Stringent regulatory frameworks and approvals pose a challenge, while the market also faces competition from traditional treatments and substitute therapies. The end-user demographic primarily consists of patients with organ failure or disabilities, encompassing a wide age range and diverse healthcare needs. M&A activity has been moderate, with strategic acquisitions aimed at expanding product portfolios and geographic reach.
- Market Concentration: Moderately concentrated, with top 5 players holding approximately xx% market share (2024).
- Technological Innovation: Significant advancements in biocompatibility, miniaturization, and power sources are driving innovation.
- Regulatory Framework: Stringent regulatory approvals (e.g., FDA, CE mark) create barriers to entry and slow down product launch timelines.
- Competitive Substitutes: Traditional treatments (e.g., dialysis, transplants) and emerging therapies compete with artificial organs and bionics.
- End-User Demographics: Growing geriatric population and increasing prevalence of chronic diseases drive demand.
- M&A Trends: Moderate level of M&A activity focused on expanding product portfolios and geographical footprint. Approximately xx M&A deals were recorded between 2019 and 2024.
Artificial Vital Organs and Medical Bionics Industry Growth Trends & Insights
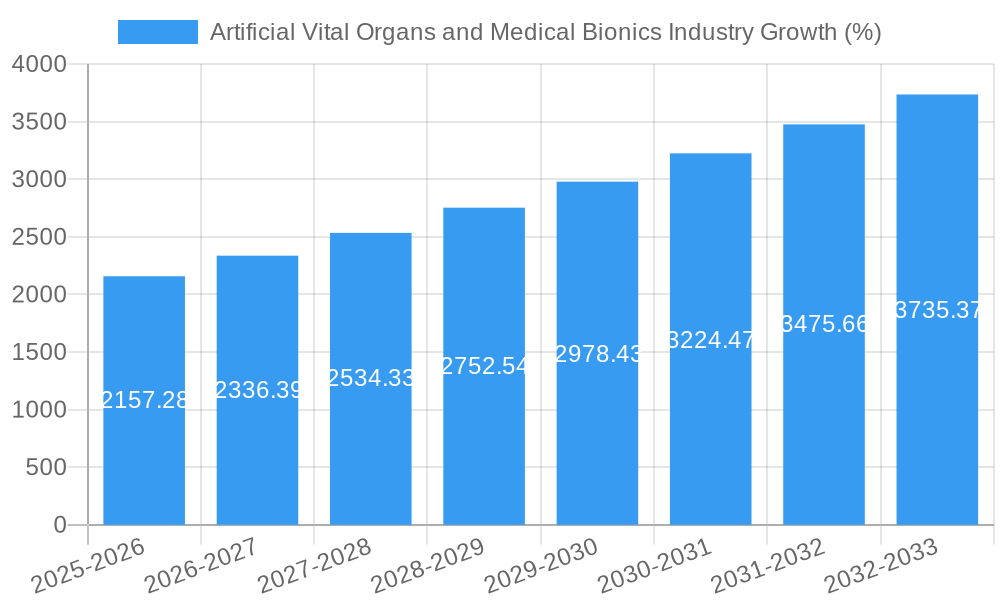
The Artificial Vital Organs and Medical Bionics market experienced significant growth from 2019 to 2024, with a CAGR of xx%. This growth is attributed to several factors including the rising prevalence of chronic diseases, technological advancements, increasing healthcare spending, and growing awareness among patients. Adoption rates are increasing steadily, particularly for less invasive and more sophisticated devices. Technological disruptions, such as the integration of AI and machine learning, are streamlining operations and enhancing product performance. Consumer behavior is shifting towards personalized medicine and minimally invasive procedures, favoring adoption of advanced bionic devices. The market is projected to maintain its strong growth trajectory during the forecast period (2025-2033), achieving a CAGR of xx%, driven by continuous innovation, expanding applications, and increased market penetration. By 2033, the market is expected to reach xx Million.
Dominant Regions, Countries, or Segments in Artificial Vital Organs and Medical Bionics Industry
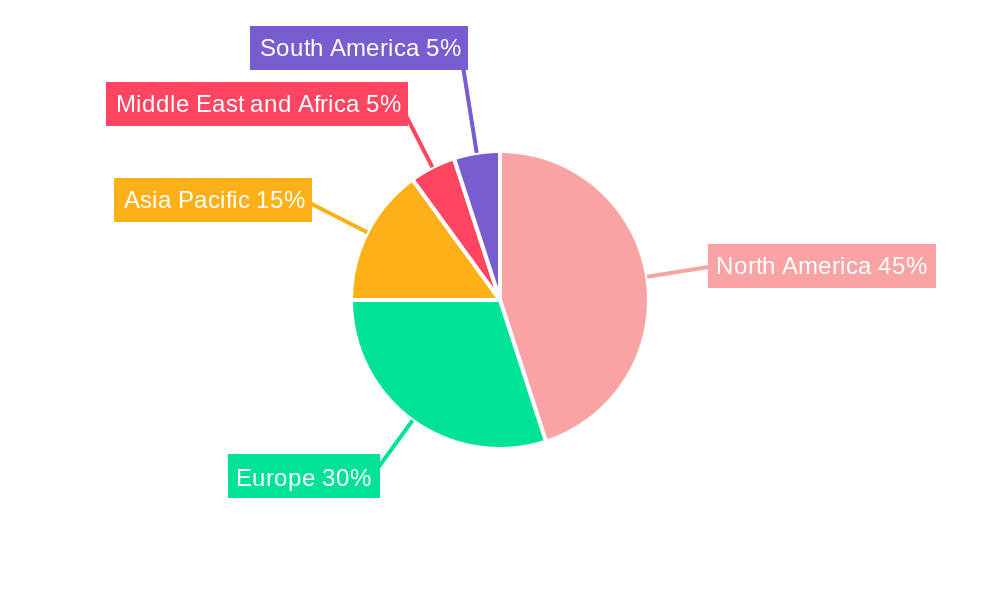
North America currently dominates the global Artificial Vital Organs and Medical Bionics market, holding the largest market share (approximately xx% in 2024), driven by high healthcare expenditure, advanced medical infrastructure, and a robust regulatory environment. Europe is the second-largest market, with significant growth potential in emerging economies within the region. The Artificial Heart segment holds a significant share within the Artificial Organs category, followed by the Artificial Kidney segment. Within Bionics, Exoskeletons and Bionic Limbs are witnessing considerable growth due to advancements and rising demand.
- Key Drivers (North America): High healthcare spending, advanced medical infrastructure, strong regulatory framework, favorable reimbursement policies.
- Key Drivers (Europe): Increasing prevalence of chronic diseases, growing adoption of minimally invasive procedures, government initiatives promoting technological advancement.
- Segment Dominance: Artificial Heart and Kidney within Artificial Organs; Exoskeletons and Bionic Limbs within Bionics.
- Growth Potential: Emerging economies in Asia-Pacific and Latin America show high growth potential due to increasing healthcare investments and rising prevalence of chronic diseases.
Artificial Vital Organs and Medical Bionics Industry Product Landscape
The product landscape is characterized by innovative designs, improved biocompatibility, and enhanced functionality. Artificial organs are increasingly incorporating advanced materials and technologies to improve longevity and minimize rejection rates. Bionic devices are becoming more sophisticated, incorporating AI-powered control systems and advanced sensors for improved precision and responsiveness. Unique selling propositions include miniaturization, improved power sources, enhanced durability, and seamless integration with the human body. Technological advancements in areas like nanotechnology, bioprinting, and 3D-printing are further shaping the product landscape.
Key Drivers, Barriers & Challenges in Artificial Vital Organs and Medical Bionics Industry
Key Drivers:
- Rising prevalence of chronic diseases requiring organ replacement or functional restoration.
- Technological advancements leading to improved biocompatibility, miniaturization, and functionality.
- Increasing healthcare expenditure and government initiatives supporting medical technology.
Challenges & Restraints:
- High cost of devices, limiting accessibility, particularly in low- and middle-income countries.
- Stringent regulatory requirements, extending product development and approval times.
- Potential for device malfunctions, complications, and immune rejection. Approximately xx% of artificial organ implants experience rejection in the first 5 years.
- Supply chain disruptions impacting raw materials and manufacturing.
Emerging Opportunities in Artificial Vital Organs and Medical Bionics Industry
- Development of bioartificial organs using patient-specific cells to reduce rejection rates.
- Expansion into underserved markets with high prevalence of organ failure and disabilities.
- Growing demand for personalized and minimally invasive procedures drives the need for further innovation.
- Integration of AI and machine learning for improved diagnostic capabilities and personalized treatment plans.
Growth Accelerators in the Artificial Vital Organs and Medical Bionics Industry Industry
Technological breakthroughs, particularly in bioprinting and nanotechnology, promise to revolutionize the manufacturing of artificial organs, reducing costs and improving efficiency. Strategic partnerships between medical device companies, research institutions, and healthcare providers are crucial for fostering innovation and accelerating product development. Expansion into new markets through strategic alliances and distribution partnerships will broaden accessibility to these life-saving technologies.
Key Players Shaping the Artificial Vital Organs and Medical Bionics Industry Market
- Bornlife Prosthetic and Orthotic Inc
- Ossur
- Abiomed Inc
- Cyberonics Inc
- Medtronic
- Baxter
- Asahi Kasei Medical Co Ltd
- Getinge AB
- Ekso Bionics Holdings Inc
- Boston Scientific Corporation
- Sonova
- Berlin Heart GmbH
Notable Milestones in Artificial Vital Organs and Medical Bionics Industry Sector
- August 2022: USD 10.5 million offered for Phase 2 of the Artificial Kidney Prize competition by ASN and US Department of Health and Human Services.
- January 2022: IIT-Kanpur launches a project to develop an advanced artificial heart in collaboration with Indian hospitals.
In-Depth Artificial Vital Organs and Medical Bionics Industry Market Outlook
The Artificial Vital Organs and Medical Bionics market is poised for sustained growth over the forecast period, driven by technological advancements, increasing prevalence of chronic diseases, and rising healthcare expenditure. Strategic partnerships, expansion into untapped markets, and continuous innovation will shape the future of the industry. The market presents significant opportunities for companies that can deliver cost-effective, high-performance, and biocompatible solutions. The focus on personalized medicine and minimally invasive procedures will further accelerate market growth and drive the development of innovative products.
Artificial Vital Organs and Medical Bionics Industry Segmentation
-
1. Type
-
1.1. Artificial Organ
- 1.1.1. Artificial Heart
- 1.1.2. Artificial Kidney
- 1.1.3. Artificial Lungs
- 1.1.4. Cochlear Implants
- 1.1.5. Other Organ Types
-
1.2. Bionics
- 1.2.1. Vision Bionics
- 1.2.2. Ear Bionics
- 1.2.3. Orthopedic Bionic
- 1.2.4. Cardiac Bionics
-
1.1. Artificial Organ
Artificial Vital Organs and Medical Bionics Industry Segmentation By Geography
-
1. North America
- 1.1. United States
- 1.2. Canada
- 1.3. Mexico
-
2. Europe
- 2.1. Germany
- 2.2. United Kingdom
- 2.3. France
- 2.4. Italy
- 2.5. Spain
- 2.6. Rest of Europe
-
3. Asia Pacific
- 3.1. China
- 3.2. Japan
- 3.3. India
- 3.4. Australia
- 3.5. South Korea
- 3.6. Rest of Asia Pacific
-
4. Middle East and Africa
- 4.1. GCC
- 4.2. South Africa
- 4.3. Rest of Middle East and Africa
-
5. South America
- 5.1. Brazil
- 5.2. Argentina
- 5.3. Rest of South America
Artificial Vital Organs and Medical Bionics Industry REPORT HIGHLIGHTS
| Aspects | Details |
|---|---|
| Study Period | 2019-2033 |
| Base Year | 2024 |
| Estimated Year | 2025 |
| Forecast Period | 2025-2033 |
| Historical Period | 2019-2024 |
| Growth Rate | CAGR of 7.20% from 2019-2033 |
| Segmentation |
|
Table of Contents
- 1. Introduction
- 1.1. Research Scope
- 1.2. Market Segmentation
- 1.3. Research Methodology
- 1.4. Definitions and Assumptions
- 2. Executive Summary
- 2.1. Introduction
- 3. Market Dynamics
- 3.1. Introduction
- 3.2. Market Drivers
- 3.2.1. Increased Incidence of Disabilities and Organ Failures; High Incidence of Road Accidents Leading to Amputations; Scarcity of Donor Organs; Technological Advancements in the Artificial Organ and Bionics
- 3.3. Market Restrains
- 3.3.1. Expensive Procedures; Compatibility Issues and Malfunctions
- 3.4. Market Trends
- 3.4.1. Artificial Kidney by Artificial Organ Segment is anticipated to Grow Over the Forecast Period
- 4. Market Factor Analysis
- 4.1. Porters Five Forces
- 4.2. Supply/Value Chain
- 4.3. PESTEL analysis
- 4.4. Market Entropy
- 4.5. Patent/Trademark Analysis
- 5. Global Artificial Vital Organs and Medical Bionics Industry Analysis, Insights and Forecast, 2019-2031
- 5.1. Market Analysis, Insights and Forecast - by Type
- 5.1.1. Artificial Organ
- 5.1.1.1. Artificial Heart
- 5.1.1.2. Artificial Kidney
- 5.1.1.3. Artificial Lungs
- 5.1.1.4. Cochlear Implants
- 5.1.1.5. Other Organ Types
- 5.1.2. Bionics
- 5.1.2.1. Vision Bionics
- 5.1.2.2. Ear Bionics
- 5.1.2.3. Orthopedic Bionic
- 5.1.2.4. Cardiac Bionics
- 5.1.1. Artificial Organ
- 5.2. Market Analysis, Insights and Forecast - by Region
- 5.2.1. North America
- 5.2.2. Europe
- 5.2.3. Asia Pacific
- 5.2.4. Middle East and Africa
- 5.2.5. South America
- 5.1. Market Analysis, Insights and Forecast - by Type
- 6. North America Artificial Vital Organs and Medical Bionics Industry Analysis, Insights and Forecast, 2019-2031
- 6.1. Market Analysis, Insights and Forecast - by Type
- 6.1.1. Artificial Organ
- 6.1.1.1. Artificial Heart
- 6.1.1.2. Artificial Kidney
- 6.1.1.3. Artificial Lungs
- 6.1.1.4. Cochlear Implants
- 6.1.1.5. Other Organ Types
- 6.1.2. Bionics
- 6.1.2.1. Vision Bionics
- 6.1.2.2. Ear Bionics
- 6.1.2.3. Orthopedic Bionic
- 6.1.2.4. Cardiac Bionics
- 6.1.1. Artificial Organ
- 6.1. Market Analysis, Insights and Forecast - by Type
- 7. Europe Artificial Vital Organs and Medical Bionics Industry Analysis, Insights and Forecast, 2019-2031
- 7.1. Market Analysis, Insights and Forecast - by Type
- 7.1.1. Artificial Organ
- 7.1.1.1. Artificial Heart
- 7.1.1.2. Artificial Kidney
- 7.1.1.3. Artificial Lungs
- 7.1.1.4. Cochlear Implants
- 7.1.1.5. Other Organ Types
- 7.1.2. Bionics
- 7.1.2.1. Vision Bionics
- 7.1.2.2. Ear Bionics
- 7.1.2.3. Orthopedic Bionic
- 7.1.2.4. Cardiac Bionics
- 7.1.1. Artificial Organ
- 7.1. Market Analysis, Insights and Forecast - by Type
- 8. Asia Pacific Artificial Vital Organs and Medical Bionics Industry Analysis, Insights and Forecast, 2019-2031
- 8.1. Market Analysis, Insights and Forecast - by Type
- 8.1.1. Artificial Organ
- 8.1.1.1. Artificial Heart
- 8.1.1.2. Artificial Kidney
- 8.1.1.3. Artificial Lungs
- 8.1.1.4. Cochlear Implants
- 8.1.1.5. Other Organ Types
- 8.1.2. Bionics
- 8.1.2.1. Vision Bionics
- 8.1.2.2. Ear Bionics
- 8.1.2.3. Orthopedic Bionic
- 8.1.2.4. Cardiac Bionics
- 8.1.1. Artificial Organ
- 8.1. Market Analysis, Insights and Forecast - by Type
- 9. Middle East and Africa Artificial Vital Organs and Medical Bionics Industry Analysis, Insights and Forecast, 2019-2031
- 9.1. Market Analysis, Insights and Forecast - by Type
- 9.1.1. Artificial Organ
- 9.1.1.1. Artificial Heart
- 9.1.1.2. Artificial Kidney
- 9.1.1.3. Artificial Lungs
- 9.1.1.4. Cochlear Implants
- 9.1.1.5. Other Organ Types
- 9.1.2. Bionics
- 9.1.2.1. Vision Bionics
- 9.1.2.2. Ear Bionics
- 9.1.2.3. Orthopedic Bionic
- 9.1.2.4. Cardiac Bionics
- 9.1.1. Artificial Organ
- 9.1. Market Analysis, Insights and Forecast - by Type
- 10. South America Artificial Vital Organs and Medical Bionics Industry Analysis, Insights and Forecast, 2019-2031
- 10.1. Market Analysis, Insights and Forecast - by Type
- 10.1.1. Artificial Organ
- 10.1.1.1. Artificial Heart
- 10.1.1.2. Artificial Kidney
- 10.1.1.3. Artificial Lungs
- 10.1.1.4. Cochlear Implants
- 10.1.1.5. Other Organ Types
- 10.1.2. Bionics
- 10.1.2.1. Vision Bionics
- 10.1.2.2. Ear Bionics
- 10.1.2.3. Orthopedic Bionic
- 10.1.2.4. Cardiac Bionics
- 10.1.1. Artificial Organ
- 10.1. Market Analysis, Insights and Forecast - by Type
- 11. North America Artificial Vital Organs and Medical Bionics Industry Analysis, Insights and Forecast, 2019-2031
- 11.1. Market Analysis, Insights and Forecast - By Country/Sub-region
- 11.1.1 United States
- 11.1.2 Canada
- 11.1.3 Mexico
- 12. Europe Artificial Vital Organs and Medical Bionics Industry Analysis, Insights and Forecast, 2019-2031
- 12.1. Market Analysis, Insights and Forecast - By Country/Sub-region
- 12.1.1 Germany
- 12.1.2 United Kingdom
- 12.1.3 France
- 12.1.4 Italy
- 12.1.5 Spain
- 12.1.6 Rest of Europe
- 13. Asia Pacific Artificial Vital Organs and Medical Bionics Industry Analysis, Insights and Forecast, 2019-2031
- 13.1. Market Analysis, Insights and Forecast - By Country/Sub-region
- 13.1.1 China
- 13.1.2 Japan
- 13.1.3 India
- 13.1.4 Australia
- 13.1.5 South Korea
- 13.1.6 Rest of Asia Pacific
- 14. Middle East and Africa Artificial Vital Organs and Medical Bionics Industry Analysis, Insights and Forecast, 2019-2031
- 14.1. Market Analysis, Insights and Forecast - By Country/Sub-region
- 14.1.1 GCC
- 14.1.2 South Africa
- 14.1.3 Rest of Middle East and Africa
- 15. South America Artificial Vital Organs and Medical Bionics Industry Analysis, Insights and Forecast, 2019-2031
- 15.1. Market Analysis, Insights and Forecast - By Country/Sub-region
- 15.1.1 Brazil
- 15.1.2 Argentina
- 15.1.3 Rest of South America
- 16. Competitive Analysis
- 16.1. Global Market Share Analysis 2024
- 16.2. Company Profiles
- 16.2.1 Bornlife Prosthetic and Orthotic Inc
- 16.2.1.1. Overview
- 16.2.1.2. Products
- 16.2.1.3. SWOT Analysis
- 16.2.1.4. Recent Developments
- 16.2.1.5. Financials (Based on Availability)
- 16.2.2 Ossur
- 16.2.2.1. Overview
- 16.2.2.2. Products
- 16.2.2.3. SWOT Analysis
- 16.2.2.4. Recent Developments
- 16.2.2.5. Financials (Based on Availability)
- 16.2.3 Abiomed Inc
- 16.2.3.1. Overview
- 16.2.3.2. Products
- 16.2.3.3. SWOT Analysis
- 16.2.3.4. Recent Developments
- 16.2.3.5. Financials (Based on Availability)
- 16.2.4 Cyberonics Inc
- 16.2.4.1. Overview
- 16.2.4.2. Products
- 16.2.4.3. SWOT Analysis
- 16.2.4.4. Recent Developments
- 16.2.4.5. Financials (Based on Availability)
- 16.2.5 Medtronic
- 16.2.5.1. Overview
- 16.2.5.2. Products
- 16.2.5.3. SWOT Analysis
- 16.2.5.4. Recent Developments
- 16.2.5.5. Financials (Based on Availability)
- 16.2.6 Baxter
- 16.2.6.1. Overview
- 16.2.6.2. Products
- 16.2.6.3. SWOT Analysis
- 16.2.6.4. Recent Developments
- 16.2.6.5. Financials (Based on Availability)
- 16.2.7 Asahi Kasei Medical Co Ltd
- 16.2.7.1. Overview
- 16.2.7.2. Products
- 16.2.7.3. SWOT Analysis
- 16.2.7.4. Recent Developments
- 16.2.7.5. Financials (Based on Availability)
- 16.2.8 Getinge AB
- 16.2.8.1. Overview
- 16.2.8.2. Products
- 16.2.8.3. SWOT Analysis
- 16.2.8.4. Recent Developments
- 16.2.8.5. Financials (Based on Availability)
- 16.2.9 Ekso Bionics Holdings Inc
- 16.2.9.1. Overview
- 16.2.9.2. Products
- 16.2.9.3. SWOT Analysis
- 16.2.9.4. Recent Developments
- 16.2.9.5. Financials (Based on Availability)
- 16.2.10 Boston Scientific Corporation
- 16.2.10.1. Overview
- 16.2.10.2. Products
- 16.2.10.3. SWOT Analysis
- 16.2.10.4. Recent Developments
- 16.2.10.5. Financials (Based on Availability)
- 16.2.11 Sonova*List Not Exhaustive
- 16.2.11.1. Overview
- 16.2.11.2. Products
- 16.2.11.3. SWOT Analysis
- 16.2.11.4. Recent Developments
- 16.2.11.5. Financials (Based on Availability)
- 16.2.12 Berlin Heart GmbH
- 16.2.12.1. Overview
- 16.2.12.2. Products
- 16.2.12.3. SWOT Analysis
- 16.2.12.4. Recent Developments
- 16.2.12.5. Financials (Based on Availability)
- 16.2.1 Bornlife Prosthetic and Orthotic Inc
List of Figures
- Figure 1: Global Artificial Vital Organs and Medical Bionics Industry Revenue Breakdown (Million, %) by Region 2024 & 2032
- Figure 2: Global Artificial Vital Organs and Medical Bionics Industry Volume Breakdown (Piece, %) by Region 2024 & 2032
- Figure 3: North America Artificial Vital Organs and Medical Bionics Industry Revenue (Million), by Country 2024 & 2032
- Figure 4: North America Artificial Vital Organs and Medical Bionics Industry Volume (Piece), by Country 2024 & 2032
- Figure 5: North America Artificial Vital Organs and Medical Bionics Industry Revenue Share (%), by Country 2024 & 2032
- Figure 6: North America Artificial Vital Organs and Medical Bionics Industry Volume Share (%), by Country 2024 & 2032
- Figure 7: Europe Artificial Vital Organs and Medical Bionics Industry Revenue (Million), by Country 2024 & 2032
- Figure 8: Europe Artificial Vital Organs and Medical Bionics Industry Volume (Piece), by Country 2024 & 2032
- Figure 9: Europe Artificial Vital Organs and Medical Bionics Industry Revenue Share (%), by Country 2024 & 2032
- Figure 10: Europe Artificial Vital Organs and Medical Bionics Industry Volume Share (%), by Country 2024 & 2032
- Figure 11: Asia Pacific Artificial Vital Organs and Medical Bionics Industry Revenue (Million), by Country 2024 & 2032
- Figure 12: Asia Pacific Artificial Vital Organs and Medical Bionics Industry Volume (Piece), by Country 2024 & 2032
- Figure 13: Asia Pacific Artificial Vital Organs and Medical Bionics Industry Revenue Share (%), by Country 2024 & 2032
- Figure 14: Asia Pacific Artificial Vital Organs and Medical Bionics Industry Volume Share (%), by Country 2024 & 2032
- Figure 15: Middle East and Africa Artificial Vital Organs and Medical Bionics Industry Revenue (Million), by Country 2024 & 2032
- Figure 16: Middle East and Africa Artificial Vital Organs and Medical Bionics Industry Volume (Piece), by Country 2024 & 2032
- Figure 17: Middle East and Africa Artificial Vital Organs and Medical Bionics Industry Revenue Share (%), by Country 2024 & 2032
- Figure 18: Middle East and Africa Artificial Vital Organs and Medical Bionics Industry Volume Share (%), by Country 2024 & 2032
- Figure 19: South America Artificial Vital Organs and Medical Bionics Industry Revenue (Million), by Country 2024 & 2032
- Figure 20: South America Artificial Vital Organs and Medical Bionics Industry Volume (Piece), by Country 2024 & 2032
- Figure 21: South America Artificial Vital Organs and Medical Bionics Industry Revenue Share (%), by Country 2024 & 2032
- Figure 22: South America Artificial Vital Organs and Medical Bionics Industry Volume Share (%), by Country 2024 & 2032
- Figure 23: North America Artificial Vital Organs and Medical Bionics Industry Revenue (Million), by Type 2024 & 2032
- Figure 24: North America Artificial Vital Organs and Medical Bionics Industry Volume (Piece), by Type 2024 & 2032
- Figure 25: North America Artificial Vital Organs and Medical Bionics Industry Revenue Share (%), by Type 2024 & 2032
- Figure 26: North America Artificial Vital Organs and Medical Bionics Industry Volume Share (%), by Type 2024 & 2032
- Figure 27: North America Artificial Vital Organs and Medical Bionics Industry Revenue (Million), by Country 2024 & 2032
- Figure 28: North America Artificial Vital Organs and Medical Bionics Industry Volume (Piece), by Country 2024 & 2032
- Figure 29: North America Artificial Vital Organs and Medical Bionics Industry Revenue Share (%), by Country 2024 & 2032
- Figure 30: North America Artificial Vital Organs and Medical Bionics Industry Volume Share (%), by Country 2024 & 2032
- Figure 31: Europe Artificial Vital Organs and Medical Bionics Industry Revenue (Million), by Type 2024 & 2032
- Figure 32: Europe Artificial Vital Organs and Medical Bionics Industry Volume (Piece), by Type 2024 & 2032
- Figure 33: Europe Artificial Vital Organs and Medical Bionics Industry Revenue Share (%), by Type 2024 & 2032
- Figure 34: Europe Artificial Vital Organs and Medical Bionics Industry Volume Share (%), by Type 2024 & 2032
- Figure 35: Europe Artificial Vital Organs and Medical Bionics Industry Revenue (Million), by Country 2024 & 2032
- Figure 36: Europe Artificial Vital Organs and Medical Bionics Industry Volume (Piece), by Country 2024 & 2032
- Figure 37: Europe Artificial Vital Organs and Medical Bionics Industry Revenue Share (%), by Country 2024 & 2032
- Figure 38: Europe Artificial Vital Organs and Medical Bionics Industry Volume Share (%), by Country 2024 & 2032
- Figure 39: Asia Pacific Artificial Vital Organs and Medical Bionics Industry Revenue (Million), by Type 2024 & 2032
- Figure 40: Asia Pacific Artificial Vital Organs and Medical Bionics Industry Volume (Piece), by Type 2024 & 2032
- Figure 41: Asia Pacific Artificial Vital Organs and Medical Bionics Industry Revenue Share (%), by Type 2024 & 2032
- Figure 42: Asia Pacific Artificial Vital Organs and Medical Bionics Industry Volume Share (%), by Type 2024 & 2032
- Figure 43: Asia Pacific Artificial Vital Organs and Medical Bionics Industry Revenue (Million), by Country 2024 & 2032
- Figure 44: Asia Pacific Artificial Vital Organs and Medical Bionics Industry Volume (Piece), by Country 2024 & 2032
- Figure 45: Asia Pacific Artificial Vital Organs and Medical Bionics Industry Revenue Share (%), by Country 2024 & 2032
- Figure 46: Asia Pacific Artificial Vital Organs and Medical Bionics Industry Volume Share (%), by Country 2024 & 2032
- Figure 47: Middle East and Africa Artificial Vital Organs and Medical Bionics Industry Revenue (Million), by Type 2024 & 2032
- Figure 48: Middle East and Africa Artificial Vital Organs and Medical Bionics Industry Volume (Piece), by Type 2024 & 2032
- Figure 49: Middle East and Africa Artificial Vital Organs and Medical Bionics Industry Revenue Share (%), by Type 2024 & 2032
- Figure 50: Middle East and Africa Artificial Vital Organs and Medical Bionics Industry Volume Share (%), by Type 2024 & 2032
- Figure 51: Middle East and Africa Artificial Vital Organs and Medical Bionics Industry Revenue (Million), by Country 2024 & 2032
- Figure 52: Middle East and Africa Artificial Vital Organs and Medical Bionics Industry Volume (Piece), by Country 2024 & 2032
- Figure 53: Middle East and Africa Artificial Vital Organs and Medical Bionics Industry Revenue Share (%), by Country 2024 & 2032
- Figure 54: Middle East and Africa Artificial Vital Organs and Medical Bionics Industry Volume Share (%), by Country 2024 & 2032
- Figure 55: South America Artificial Vital Organs and Medical Bionics Industry Revenue (Million), by Type 2024 & 2032
- Figure 56: South America Artificial Vital Organs and Medical Bionics Industry Volume (Piece), by Type 2024 & 2032
- Figure 57: South America Artificial Vital Organs and Medical Bionics Industry Revenue Share (%), by Type 2024 & 2032
- Figure 58: South America Artificial Vital Organs and Medical Bionics Industry Volume Share (%), by Type 2024 & 2032
- Figure 59: South America Artificial Vital Organs and Medical Bionics Industry Revenue (Million), by Country 2024 & 2032
- Figure 60: South America Artificial Vital Organs and Medical Bionics Industry Volume (Piece), by Country 2024 & 2032
- Figure 61: South America Artificial Vital Organs and Medical Bionics Industry Revenue Share (%), by Country 2024 & 2032
- Figure 62: South America Artificial Vital Organs and Medical Bionics Industry Volume Share (%), by Country 2024 & 2032
List of Tables
- Table 1: Global Artificial Vital Organs and Medical Bionics Industry Revenue Million Forecast, by Region 2019 & 2032
- Table 2: Global Artificial Vital Organs and Medical Bionics Industry Volume Piece Forecast, by Region 2019 & 2032
- Table 3: Global Artificial Vital Organs and Medical Bionics Industry Revenue Million Forecast, by Type 2019 & 2032
- Table 4: Global Artificial Vital Organs and Medical Bionics Industry Volume Piece Forecast, by Type 2019 & 2032
- Table 5: Global Artificial Vital Organs and Medical Bionics Industry Revenue Million Forecast, by Region 2019 & 2032
- Table 6: Global Artificial Vital Organs and Medical Bionics Industry Volume Piece Forecast, by Region 2019 & 2032
- Table 7: Global Artificial Vital Organs and Medical Bionics Industry Revenue Million Forecast, by Country 2019 & 2032
- Table 8: Global Artificial Vital Organs and Medical Bionics Industry Volume Piece Forecast, by Country 2019 & 2032
- Table 9: United States Artificial Vital Organs and Medical Bionics Industry Revenue (Million) Forecast, by Application 2019 & 2032
- Table 10: United States Artificial Vital Organs and Medical Bionics Industry Volume (Piece) Forecast, by Application 2019 & 2032
- Table 11: Canada Artificial Vital Organs and Medical Bionics Industry Revenue (Million) Forecast, by Application 2019 & 2032
- Table 12: Canada Artificial Vital Organs and Medical Bionics Industry Volume (Piece) Forecast, by Application 2019 & 2032
- Table 13: Mexico Artificial Vital Organs and Medical Bionics Industry Revenue (Million) Forecast, by Application 2019 & 2032
- Table 14: Mexico Artificial Vital Organs and Medical Bionics Industry Volume (Piece) Forecast, by Application 2019 & 2032
- Table 15: Global Artificial Vital Organs and Medical Bionics Industry Revenue Million Forecast, by Country 2019 & 2032
- Table 16: Global Artificial Vital Organs and Medical Bionics Industry Volume Piece Forecast, by Country 2019 & 2032
- Table 17: Germany Artificial Vital Organs and Medical Bionics Industry Revenue (Million) Forecast, by Application 2019 & 2032
- Table 18: Germany Artificial Vital Organs and Medical Bionics Industry Volume (Piece) Forecast, by Application 2019 & 2032
- Table 19: United Kingdom Artificial Vital Organs and Medical Bionics Industry Revenue (Million) Forecast, by Application 2019 & 2032
- Table 20: United Kingdom Artificial Vital Organs and Medical Bionics Industry Volume (Piece) Forecast, by Application 2019 & 2032
- Table 21: France Artificial Vital Organs and Medical Bionics Industry Revenue (Million) Forecast, by Application 2019 & 2032
- Table 22: France Artificial Vital Organs and Medical Bionics Industry Volume (Piece) Forecast, by Application 2019 & 2032
- Table 23: Italy Artificial Vital Organs and Medical Bionics Industry Revenue (Million) Forecast, by Application 2019 & 2032
- Table 24: Italy Artificial Vital Organs and Medical Bionics Industry Volume (Piece) Forecast, by Application 2019 & 2032
- Table 25: Spain Artificial Vital Organs and Medical Bionics Industry Revenue (Million) Forecast, by Application 2019 & 2032
- Table 26: Spain Artificial Vital Organs and Medical Bionics Industry Volume (Piece) Forecast, by Application 2019 & 2032
- Table 27: Rest of Europe Artificial Vital Organs and Medical Bionics Industry Revenue (Million) Forecast, by Application 2019 & 2032
- Table 28: Rest of Europe Artificial Vital Organs and Medical Bionics Industry Volume (Piece) Forecast, by Application 2019 & 2032
- Table 29: Global Artificial Vital Organs and Medical Bionics Industry Revenue Million Forecast, by Country 2019 & 2032
- Table 30: Global Artificial Vital Organs and Medical Bionics Industry Volume Piece Forecast, by Country 2019 & 2032
- Table 31: China Artificial Vital Organs and Medical Bionics Industry Revenue (Million) Forecast, by Application 2019 & 2032
- Table 32: China Artificial Vital Organs and Medical Bionics Industry Volume (Piece) Forecast, by Application 2019 & 2032
- Table 33: Japan Artificial Vital Organs and Medical Bionics Industry Revenue (Million) Forecast, by Application 2019 & 2032
- Table 34: Japan Artificial Vital Organs and Medical Bionics Industry Volume (Piece) Forecast, by Application 2019 & 2032
- Table 35: India Artificial Vital Organs and Medical Bionics Industry Revenue (Million) Forecast, by Application 2019 & 2032
- Table 36: India Artificial Vital Organs and Medical Bionics Industry Volume (Piece) Forecast, by Application 2019 & 2032
- Table 37: Australia Artificial Vital Organs and Medical Bionics Industry Revenue (Million) Forecast, by Application 2019 & 2032
- Table 38: Australia Artificial Vital Organs and Medical Bionics Industry Volume (Piece) Forecast, by Application 2019 & 2032
- Table 39: South Korea Artificial Vital Organs and Medical Bionics Industry Revenue (Million) Forecast, by Application 2019 & 2032
- Table 40: South Korea Artificial Vital Organs and Medical Bionics Industry Volume (Piece) Forecast, by Application 2019 & 2032
- Table 41: Rest of Asia Pacific Artificial Vital Organs and Medical Bionics Industry Revenue (Million) Forecast, by Application 2019 & 2032
- Table 42: Rest of Asia Pacific Artificial Vital Organs and Medical Bionics Industry Volume (Piece) Forecast, by Application 2019 & 2032
- Table 43: Global Artificial Vital Organs and Medical Bionics Industry Revenue Million Forecast, by Country 2019 & 2032
- Table 44: Global Artificial Vital Organs and Medical Bionics Industry Volume Piece Forecast, by Country 2019 & 2032
- Table 45: GCC Artificial Vital Organs and Medical Bionics Industry Revenue (Million) Forecast, by Application 2019 & 2032
- Table 46: GCC Artificial Vital Organs and Medical Bionics Industry Volume (Piece) Forecast, by Application 2019 & 2032
- Table 47: South Africa Artificial Vital Organs and Medical Bionics Industry Revenue (Million) Forecast, by Application 2019 & 2032
- Table 48: South Africa Artificial Vital Organs and Medical Bionics Industry Volume (Piece) Forecast, by Application 2019 & 2032
- Table 49: Rest of Middle East and Africa Artificial Vital Organs and Medical Bionics Industry Revenue (Million) Forecast, by Application 2019 & 2032
- Table 50: Rest of Middle East and Africa Artificial Vital Organs and Medical Bionics Industry Volume (Piece) Forecast, by Application 2019 & 2032
- Table 51: Global Artificial Vital Organs and Medical Bionics Industry Revenue Million Forecast, by Country 2019 & 2032
- Table 52: Global Artificial Vital Organs and Medical Bionics Industry Volume Piece Forecast, by Country 2019 & 2032
- Table 53: Brazil Artificial Vital Organs and Medical Bionics Industry Revenue (Million) Forecast, by Application 2019 & 2032
- Table 54: Brazil Artificial Vital Organs and Medical Bionics Industry Volume (Piece) Forecast, by Application 2019 & 2032
- Table 55: Argentina Artificial Vital Organs and Medical Bionics Industry Revenue (Million) Forecast, by Application 2019 & 2032
- Table 56: Argentina Artificial Vital Organs and Medical Bionics Industry Volume (Piece) Forecast, by Application 2019 & 2032
- Table 57: Rest of South America Artificial Vital Organs and Medical Bionics Industry Revenue (Million) Forecast, by Application 2019 & 2032
- Table 58: Rest of South America Artificial Vital Organs and Medical Bionics Industry Volume (Piece) Forecast, by Application 2019 & 2032
- Table 59: Global Artificial Vital Organs and Medical Bionics Industry Revenue Million Forecast, by Type 2019 & 2032
- Table 60: Global Artificial Vital Organs and Medical Bionics Industry Volume Piece Forecast, by Type 2019 & 2032
- Table 61: Global Artificial Vital Organs and Medical Bionics Industry Revenue Million Forecast, by Country 2019 & 2032
- Table 62: Global Artificial Vital Organs and Medical Bionics Industry Volume Piece Forecast, by Country 2019 & 2032
- Table 63: United States Artificial Vital Organs and Medical Bionics Industry Revenue (Million) Forecast, by Application 2019 & 2032
- Table 64: United States Artificial Vital Organs and Medical Bionics Industry Volume (Piece) Forecast, by Application 2019 & 2032
- Table 65: Canada Artificial Vital Organs and Medical Bionics Industry Revenue (Million) Forecast, by Application 2019 & 2032
- Table 66: Canada Artificial Vital Organs and Medical Bionics Industry Volume (Piece) Forecast, by Application 2019 & 2032
- Table 67: Mexico Artificial Vital Organs and Medical Bionics Industry Revenue (Million) Forecast, by Application 2019 & 2032
- Table 68: Mexico Artificial Vital Organs and Medical Bionics Industry Volume (Piece) Forecast, by Application 2019 & 2032
- Table 69: Global Artificial Vital Organs and Medical Bionics Industry Revenue Million Forecast, by Type 2019 & 2032
- Table 70: Global Artificial Vital Organs and Medical Bionics Industry Volume Piece Forecast, by Type 2019 & 2032
- Table 71: Global Artificial Vital Organs and Medical Bionics Industry Revenue Million Forecast, by Country 2019 & 2032
- Table 72: Global Artificial Vital Organs and Medical Bionics Industry Volume Piece Forecast, by Country 2019 & 2032
- Table 73: Germany Artificial Vital Organs and Medical Bionics Industry Revenue (Million) Forecast, by Application 2019 & 2032
- Table 74: Germany Artificial Vital Organs and Medical Bionics Industry Volume (Piece) Forecast, by Application 2019 & 2032
- Table 75: United Kingdom Artificial Vital Organs and Medical Bionics Industry Revenue (Million) Forecast, by Application 2019 & 2032
- Table 76: United Kingdom Artificial Vital Organs and Medical Bionics Industry Volume (Piece) Forecast, by Application 2019 & 2032
- Table 77: France Artificial Vital Organs and Medical Bionics Industry Revenue (Million) Forecast, by Application 2019 & 2032
- Table 78: France Artificial Vital Organs and Medical Bionics Industry Volume (Piece) Forecast, by Application 2019 & 2032
- Table 79: Italy Artificial Vital Organs and Medical Bionics Industry Revenue (Million) Forecast, by Application 2019 & 2032
- Table 80: Italy Artificial Vital Organs and Medical Bionics Industry Volume (Piece) Forecast, by Application 2019 & 2032
- Table 81: Spain Artificial Vital Organs and Medical Bionics Industry Revenue (Million) Forecast, by Application 2019 & 2032
- Table 82: Spain Artificial Vital Organs and Medical Bionics Industry Volume (Piece) Forecast, by Application 2019 & 2032
- Table 83: Rest of Europe Artificial Vital Organs and Medical Bionics Industry Revenue (Million) Forecast, by Application 2019 & 2032
- Table 84: Rest of Europe Artificial Vital Organs and Medical Bionics Industry Volume (Piece) Forecast, by Application 2019 & 2032
- Table 85: Global Artificial Vital Organs and Medical Bionics Industry Revenue Million Forecast, by Type 2019 & 2032
- Table 86: Global Artificial Vital Organs and Medical Bionics Industry Volume Piece Forecast, by Type 2019 & 2032
- Table 87: Global Artificial Vital Organs and Medical Bionics Industry Revenue Million Forecast, by Country 2019 & 2032
- Table 88: Global Artificial Vital Organs and Medical Bionics Industry Volume Piece Forecast, by Country 2019 & 2032
- Table 89: China Artificial Vital Organs and Medical Bionics Industry Revenue (Million) Forecast, by Application 2019 & 2032
- Table 90: China Artificial Vital Organs and Medical Bionics Industry Volume (Piece) Forecast, by Application 2019 & 2032
- Table 91: Japan Artificial Vital Organs and Medical Bionics Industry Revenue (Million) Forecast, by Application 2019 & 2032
- Table 92: Japan Artificial Vital Organs and Medical Bionics Industry Volume (Piece) Forecast, by Application 2019 & 2032
- Table 93: India Artificial Vital Organs and Medical Bionics Industry Revenue (Million) Forecast, by Application 2019 & 2032
- Table 94: India Artificial Vital Organs and Medical Bionics Industry Volume (Piece) Forecast, by Application 2019 & 2032
- Table 95: Australia Artificial Vital Organs and Medical Bionics Industry Revenue (Million) Forecast, by Application 2019 & 2032
- Table 96: Australia Artificial Vital Organs and Medical Bionics Industry Volume (Piece) Forecast, by Application 2019 & 2032
- Table 97: South Korea Artificial Vital Organs and Medical Bionics Industry Revenue (Million) Forecast, by Application 2019 & 2032
- Table 98: South Korea Artificial Vital Organs and Medical Bionics Industry Volume (Piece) Forecast, by Application 2019 & 2032
- Table 99: Rest of Asia Pacific Artificial Vital Organs and Medical Bionics Industry Revenue (Million) Forecast, by Application 2019 & 2032
- Table 100: Rest of Asia Pacific Artificial Vital Organs and Medical Bionics Industry Volume (Piece) Forecast, by Application 2019 & 2032
- Table 101: Global Artificial Vital Organs and Medical Bionics Industry Revenue Million Forecast, by Type 2019 & 2032
- Table 102: Global Artificial Vital Organs and Medical Bionics Industry Volume Piece Forecast, by Type 2019 & 2032
- Table 103: Global Artificial Vital Organs and Medical Bionics Industry Revenue Million Forecast, by Country 2019 & 2032
- Table 104: Global Artificial Vital Organs and Medical Bionics Industry Volume Piece Forecast, by Country 2019 & 2032
- Table 105: GCC Artificial Vital Organs and Medical Bionics Industry Revenue (Million) Forecast, by Application 2019 & 2032
- Table 106: GCC Artificial Vital Organs and Medical Bionics Industry Volume (Piece) Forecast, by Application 2019 & 2032
- Table 107: South Africa Artificial Vital Organs and Medical Bionics Industry Revenue (Million) Forecast, by Application 2019 & 2032
- Table 108: South Africa Artificial Vital Organs and Medical Bionics Industry Volume (Piece) Forecast, by Application 2019 & 2032
- Table 109: Rest of Middle East and Africa Artificial Vital Organs and Medical Bionics Industry Revenue (Million) Forecast, by Application 2019 & 2032
- Table 110: Rest of Middle East and Africa Artificial Vital Organs and Medical Bionics Industry Volume (Piece) Forecast, by Application 2019 & 2032
- Table 111: Global Artificial Vital Organs and Medical Bionics Industry Revenue Million Forecast, by Type 2019 & 2032
- Table 112: Global Artificial Vital Organs and Medical Bionics Industry Volume Piece Forecast, by Type 2019 & 2032
- Table 113: Global Artificial Vital Organs and Medical Bionics Industry Revenue Million Forecast, by Country 2019 & 2032
- Table 114: Global Artificial Vital Organs and Medical Bionics Industry Volume Piece Forecast, by Country 2019 & 2032
- Table 115: Brazil Artificial Vital Organs and Medical Bionics Industry Revenue (Million) Forecast, by Application 2019 & 2032
- Table 116: Brazil Artificial Vital Organs and Medical Bionics Industry Volume (Piece) Forecast, by Application 2019 & 2032
- Table 117: Argentina Artificial Vital Organs and Medical Bionics Industry Revenue (Million) Forecast, by Application 2019 & 2032
- Table 118: Argentina Artificial Vital Organs and Medical Bionics Industry Volume (Piece) Forecast, by Application 2019 & 2032
- Table 119: Rest of South America Artificial Vital Organs and Medical Bionics Industry Revenue (Million) Forecast, by Application 2019 & 2032
- Table 120: Rest of South America Artificial Vital Organs and Medical Bionics Industry Volume (Piece) Forecast, by Application 2019 & 2032
Frequently Asked Questions
1. What is the projected Compound Annual Growth Rate (CAGR) of the Artificial Vital Organs and Medical Bionics Industry?
The projected CAGR is approximately 7.20%.
2. Which companies are prominent players in the Artificial Vital Organs and Medical Bionics Industry?
Key companies in the market include Bornlife Prosthetic and Orthotic Inc, Ossur, Abiomed Inc, Cyberonics Inc, Medtronic, Baxter, Asahi Kasei Medical Co Ltd, Getinge AB, Ekso Bionics Holdings Inc, Boston Scientific Corporation, Sonova*List Not Exhaustive, Berlin Heart GmbH.
3. What are the main segments of the Artificial Vital Organs and Medical Bionics Industry?
The market segments include Type.
4. Can you provide details about the market size?
The market size is estimated to be USD 29.84 Million as of 2022.
5. What are some drivers contributing to market growth?
Increased Incidence of Disabilities and Organ Failures; High Incidence of Road Accidents Leading to Amputations; Scarcity of Donor Organs; Technological Advancements in the Artificial Organ and Bionics.
6. What are the notable trends driving market growth?
Artificial Kidney by Artificial Organ Segment is anticipated to Grow Over the Forecast Period.
7. Are there any restraints impacting market growth?
Expensive Procedures; Compatibility Issues and Malfunctions.
8. Can you provide examples of recent developments in the market?
In August 2022, the American Society of Nephrology and the United States Department of Health and Human Services offered USD 10.5 million for a new prize competition from the Kidney Innovation Accelerator. Phase 2 of the Artificial Kidney Prize competition is looking for suggestions for creating prototype bioartificial kidneys, as well as any novel equipment or parts that would make them possible.
9. What pricing options are available for accessing the report?
Pricing options include single-user, multi-user, and enterprise licenses priced at USD 4750, USD 5250, and USD 8750 respectively.
10. Is the market size provided in terms of value or volume?
The market size is provided in terms of value, measured in Million and volume, measured in Piece.
11. Are there any specific market keywords associated with the report?
Yes, the market keyword associated with the report is "Artificial Vital Organs and Medical Bionics Industry," which aids in identifying and referencing the specific market segment covered.
12. How do I determine which pricing option suits my needs best?
The pricing options vary based on user requirements and access needs. Individual users may opt for single-user licenses, while businesses requiring broader access may choose multi-user or enterprise licenses for cost-effective access to the report.
13. Are there any additional resources or data provided in the Artificial Vital Organs and Medical Bionics Industry report?
While the report offers comprehensive insights, it's advisable to review the specific contents or supplementary materials provided to ascertain if additional resources or data are available.
14. How can I stay updated on further developments or reports in the Artificial Vital Organs and Medical Bionics Industry?
To stay informed about further developments, trends, and reports in the Artificial Vital Organs and Medical Bionics Industry, consider subscribing to industry newsletters, following relevant companies and organizations, or regularly checking reputable industry news sources and publications.
Methodology
Step 1 - Identification of Relevant Samples Size from Population Database


Step 2 - Approaches for Defining Global Market Size (Value, Volume* & Price*)

Note*: In applicable scenarios
Step 3 - Data Sources
Primary Research
- Web Analytics
- Survey Reports
- Research Institute
- Latest Research Reports
- Opinion Leaders
Secondary Research
- Annual Reports
- White Paper
- Latest Press Release
- Industry Association
- Paid Database
- Investor Presentations

Step 4 - Data Triangulation
Involves using different sources of information in order to increase the validity of a study
These sources are likely to be stakeholders in a program - participants, other researchers, program staff, other community members, and so on.
Then we put all data in single framework & apply various statistical tools to find out the dynamic on the market.
During the analysis stage, feedback from the stakeholder groups would be compared to determine areas of agreement as well as areas of divergence


