
Key Insights
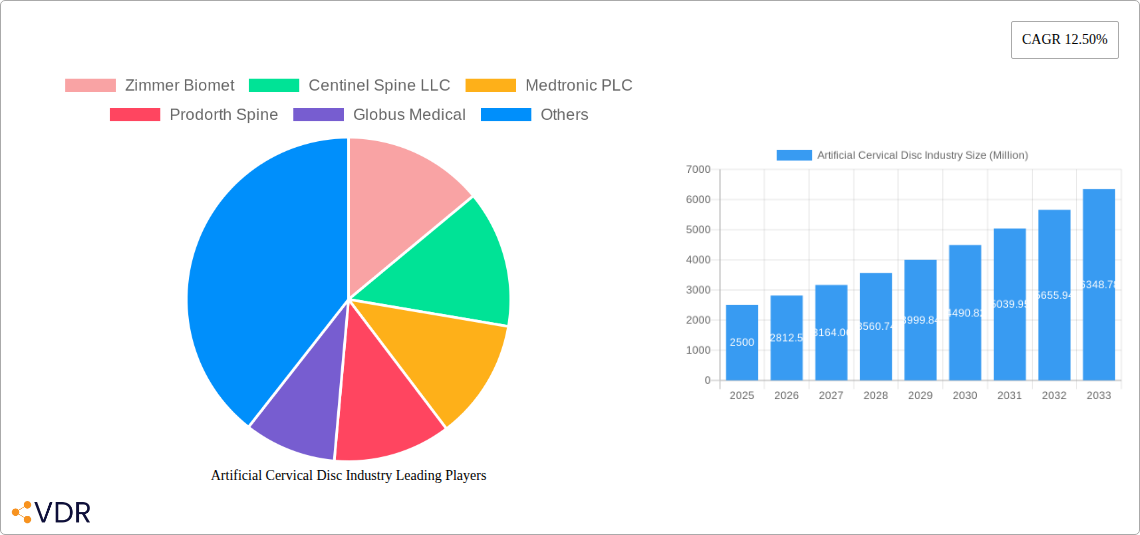
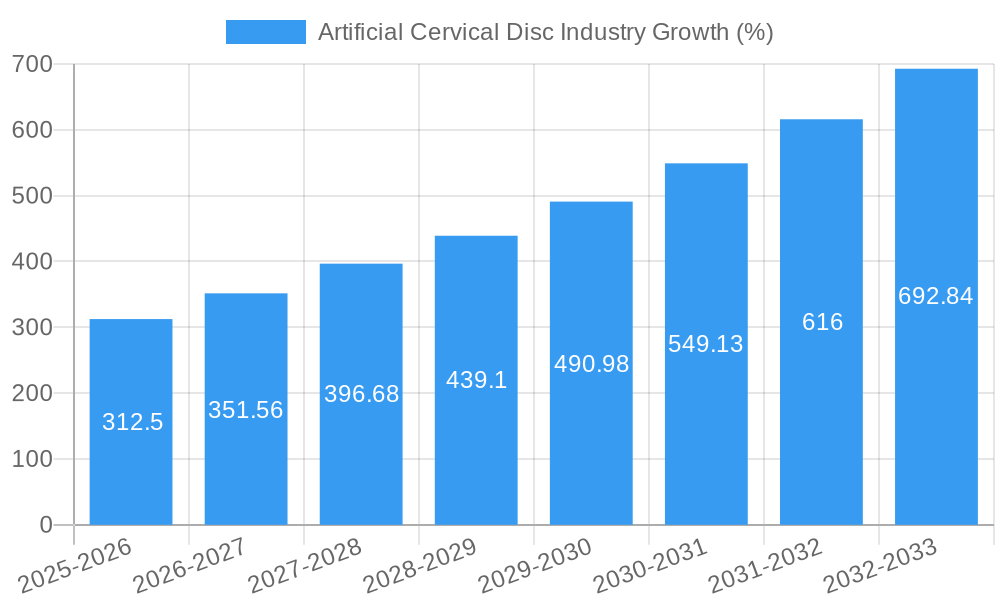
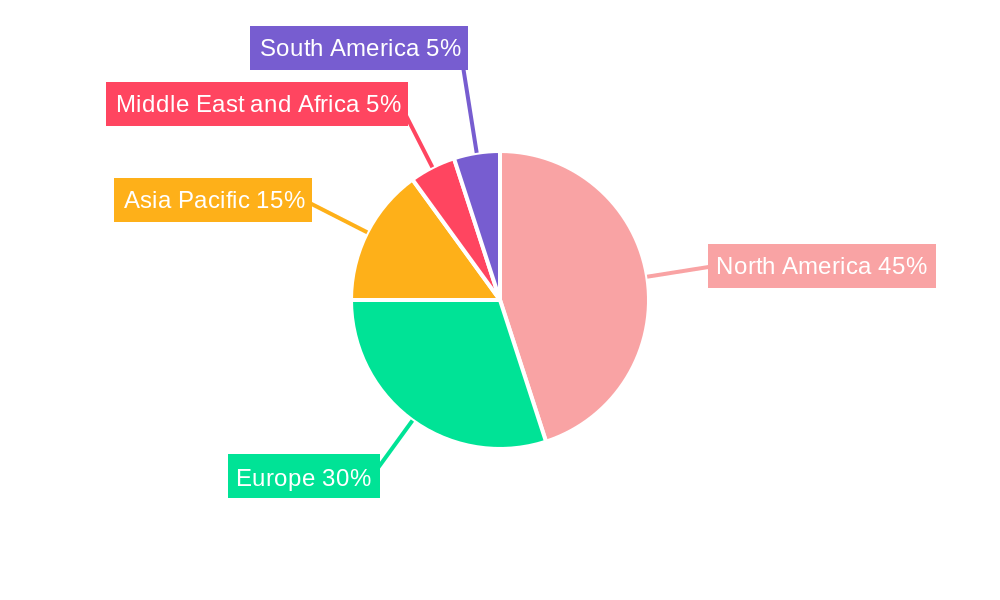
The global artificial cervical disc market is experiencing robust growth, driven by a rising geriatric population, increasing prevalence of degenerative disc disease, and a growing preference for minimally invasive surgical procedures. The market's compound annual growth rate (CAGR) of 12.50% from 2019 to 2024 suggests a significant expansion, projecting substantial market value by 2033. Key market segments include cervical and lumbar artificial discs, with metal-on-metal and metal-on-polymer materials dominating. Leading companies like Zimmer Biomet, Medtronic, and Globus Medical are strategically investing in research and development to enhance product features and expand their market share. The North American region currently holds a significant portion of the market due to advanced healthcare infrastructure and high adoption rates, but the Asia-Pacific region is anticipated to witness faster growth in the coming years fueled by rising disposable incomes and improving healthcare access. The market, however, faces certain restraints, including the relatively high cost of artificial cervical disc surgeries, potential complications associated with the procedure, and the availability of alternative treatment options. The ongoing innovation in material science and surgical techniques is expected to mitigate these limitations and drive further market expansion.
The forecast period (2025-2033) is poised for significant expansion, building upon the established growth trajectory. Continuous technological advancements, coupled with favorable regulatory landscapes in major markets, will fuel innovation in artificial disc design and materials, leading to improved patient outcomes and increased market penetration. The ongoing demand for less invasive surgical options and improved long-term efficacy will remain key drivers throughout the forecast period. Competition among market leaders is expected to intensify, further driving innovation and potentially influencing pricing strategies. Geographic expansion, particularly in emerging markets with growing healthcare infrastructure, will also contribute to substantial market growth in the long term. While the market is driven by substantial positive factors, a keen awareness of potential risks and regulatory challenges will be essential for players to sustain and capitalize on market growth opportunities.
Artificial Cervical Disc Industry: A Comprehensive Market Report (2019-2033)
This comprehensive report provides a detailed analysis of the Artificial Cervical Disc market, encompassing market dynamics, growth trends, regional analysis, product landscape, key players, and future outlook. The study period covers 2019-2033, with 2025 as the base and estimated year, and the forecast period spanning 2025-2033. The historical period analyzed is 2019-2024. This report is crucial for industry professionals, investors, and stakeholders seeking to understand and capitalize on opportunities within this dynamic sector. The parent market is the broader Spine Surgery Devices market, and the child market is specifically Artificial Cervical Discs.
Artificial Cervical Disc Industry Market Dynamics & Structure
The Artificial Cervical Disc market is characterized by moderate concentration, with key players holding significant market share. Technological innovation, driven by advancements in materials science and surgical techniques, is a primary growth driver. Stringent regulatory frameworks, including FDA approvals in the US and CE markings in Europe, shape product development and market access. Competitive substitutes, such as traditional fusion surgery, continue to exert pressure, albeit with artificial discs offering advantages in preserving motion and improving patient outcomes. The end-user demographic primarily comprises individuals with degenerative disc disease or other cervical spine pathologies. The market has witnessed several M&A activities recently, consolidating the industry landscape.
- Market Concentration: Moderately concentrated, with top 5 players holding approximately xx% market share in 2024.
- Technological Innovation Drivers: Advancements in biocompatible materials (Metal on Metal, Metal on Polymer), minimally invasive surgical techniques, and improved disc designs.
- Regulatory Frameworks: FDA approvals (US), CE markings (Europe), and other regional regulatory requirements significantly impact market entry and growth.
- Competitive Product Substitutes: Traditional spinal fusion surgery.
- End-User Demographics: Aging population, increasing prevalence of degenerative disc disease.
- M&A Trends: xx M&A deals recorded between 2019 and 2024, indicating industry consolidation.
Artificial Cervical Disc Industry Growth Trends & Insights
The Artificial Cervical Disc market experienced significant growth during the historical period (2019-2024), driven by factors such as the increasing prevalence of degenerative disc disease, technological advancements, and rising healthcare expenditure. The market size is projected to reach xx Million units by 2025 and is expected to grow at a CAGR of xx% during the forecast period (2025-2033). This growth is fueled by the increasing adoption of minimally invasive surgical techniques, improved patient outcomes, and expanding awareness among both patients and healthcare professionals. Technological disruptions, such as the development of new biomaterials and enhanced imaging technologies, will further accelerate market growth. Shifting consumer behavior toward less invasive procedures and improved quality of life contributes significantly to the market's expansion.
Dominant Regions, Countries, or Segments in Artificial Cervical Disc Industry
North America currently dominates the Artificial Cervical Disc market, driven by high healthcare expenditure, advanced healthcare infrastructure, and a large patient pool. Europe holds a significant share, with Germany, France, and the UK leading the regional growth. Within segments, Cervical Artificial Discs constitute the larger market share compared to Lumbar Artificial Discs, with Metal on Polymer materials gaining traction over Metal on Metal due to reduced wear and improved biocompatibility.
- Key Drivers (North America): High healthcare expenditure, advanced medical infrastructure, strong regulatory support, high prevalence of degenerative disc disease.
- Key Drivers (Europe): Increasing healthcare investments, rising awareness among healthcare professionals, technological advancements.
- Segment Dominance: Cervical Artificial Discs, Metal on Polymer.
Artificial Cervical Disc Industry Product Landscape
The Artificial Cervical Disc market offers a range of products with varying designs, materials, and features. Products are designed to mimic the natural biomechanics of the cervical spine, aiming for improved range of motion and reduced pain compared to traditional fusion surgery. Key features include biocompatibility, durability, and ease of implantation. Manufacturers are focusing on developing minimally invasive implants and incorporating advanced technologies to enhance surgical precision and post-operative recovery. Unique selling propositions include improved patient outcomes, reduced surgical time, and shorter hospital stays.
Key Drivers, Barriers & Challenges in Artificial Cervical Disc Industry
Key Drivers:
- Growing prevalence of degenerative disc disease and cervical spondylosis.
- Technological advancements leading to safer and more effective implants.
- Increasing demand for minimally invasive surgical procedures.
- Rising healthcare expenditure and improved insurance coverage.
Key Challenges & Restraints:
- High cost of the procedure, limiting accessibility for certain patient populations.
- Potential for complications such as implant failure or subsidence.
- Stringent regulatory approvals and lengthy clinical trials.
- Intense competition among existing and emerging players. The market is estimated to experience a xx% decrease in growth if regulatory hurdles are not addressed effectively.
Emerging Opportunities in Artificial Cervical Disc Industry
- Expanding into untapped markets in developing economies.
- Development of innovative materials and designs to improve implant performance and longevity.
- Focus on personalized medicine approaches to tailor treatments to individual patient needs.
- Leveraging telehealth and remote patient monitoring to improve post-operative care.
Growth Accelerators in the Artificial Cervical Disc Industry
Long-term growth in the Artificial Cervical Disc market will be driven by several factors, including continuous technological advancements in implant materials and designs, strategic partnerships and collaborations between medical device companies and research institutions, expansion into new geographical markets, and increased awareness among healthcare professionals and patients about the benefits of artificial disc replacement.
Key Players Shaping the Artificial Cervical Disc Industry Market
- Zimmer Biomet
- Centinel Spine LLC
- Medtronic PLC
- Prodorth Spine
- Globus Medical
- Orthofix Medical Inc
- B Braun Melsungen
- Synergy Spine Solutions Inc
- Spineart SA
- NuVasive Inc
- AxioMed LLC
Notable Milestones in Artificial Cervical Disc Industry Sector
- November 2022: Centinel Spine, LLC announced the first implantation of its prodisc C SK, a cervical artificial disc.
- October 2022: Orthofix and SeaSpine announced a definitive merger agreement.
In-Depth Artificial Cervical Disc Industry Market Outlook
The Artificial Cervical Disc market is poised for sustained growth over the forecast period, driven by the aforementioned growth accelerators. Strategic opportunities exist for companies focusing on innovation, strategic partnerships, and market expansion into underserved regions. The increasing demand for minimally invasive procedures and improved patient outcomes will continue to drive market expansion. The market is projected to reach xx Million units by 2033, presenting significant opportunities for players in the industry.
Artificial Cervical Disc Industry Segmentation
-
1. Disc Type
- 1.1. Cervical Artificial Disc
- 1.2. Lumbar Artificial Disc
-
2. Material Type
- 2.1. Metal on Metal
- 2.2. Metal on Polymer
Artificial Cervical Disc Industry Segmentation By Geography
-
1. North America
- 1.1. United States
- 1.2. Canada
- 1.3. Mexico
-
2. Europe
- 2.1. Germany
- 2.2. United Kingdom
- 2.3. France
- 2.4. Italy
- 2.5. Spain
- 2.6. Rest of Europe
-
3. Asia Pacific
- 3.1. China
- 3.2. Japan
- 3.3. India
- 3.4. Australia
- 3.5. South Korea
- 3.6. Rest of Asia Pacific
-
4. Middle East and Africa
- 4.1. GCC
- 4.2. South Africa
- 4.3. Rest of Middle East and Africa
-
5. South America
- 5.1. Brazil
- 5.2. Argentina
- 5.3. Rest of South America
Artificial Cervical Disc Industry REPORT HIGHLIGHTS
| Aspects | Details |
|---|---|
| Study Period | 2019-2033 |
| Base Year | 2024 |
| Estimated Year | 2025 |
| Forecast Period | 2025-2033 |
| Historical Period | 2019-2024 |
| Growth Rate | CAGR of 12.50% from 2019-2033 |
| Segmentation |
|
Table of Contents
- 1. Introduction
- 1.1. Research Scope
- 1.2. Market Segmentation
- 1.3. Research Methodology
- 1.4. Definitions and Assumptions
- 2. Executive Summary
- 2.1. Introduction
- 3. Market Dynamics
- 3.1. Introduction
- 3.2. Market Drivers
- 3.2.1. Growing Burden of Spine Related Diseases; Increasing Research and Development Activities in Relation to Spine Technologies; Growing Geriatric Population and Increasing Preference for Minimally Invasive Surgeries
- 3.3. Market Restrains
- 3.3.1. Reimbursement Issues; High Cost of Procedures
- 3.4. Market Trends
- 3.4.1. Cervical Artificial Disc Segment is Expected to Hold a Significant Market Share Over the Forecast Period
- 4. Market Factor Analysis
- 4.1. Porters Five Forces
- 4.2. Supply/Value Chain
- 4.3. PESTEL analysis
- 4.4. Market Entropy
- 4.5. Patent/Trademark Analysis
- 5. Global Artificial Cervical Disc Industry Analysis, Insights and Forecast, 2019-2031
- 5.1. Market Analysis, Insights and Forecast - by Disc Type
- 5.1.1. Cervical Artificial Disc
- 5.1.2. Lumbar Artificial Disc
- 5.2. Market Analysis, Insights and Forecast - by Material Type
- 5.2.1. Metal on Metal
- 5.2.2. Metal on Polymer
- 5.3. Market Analysis, Insights and Forecast - by Region
- 5.3.1. North America
- 5.3.2. Europe
- 5.3.3. Asia Pacific
- 5.3.4. Middle East and Africa
- 5.3.5. South America
- 5.1. Market Analysis, Insights and Forecast - by Disc Type
- 6. North America Artificial Cervical Disc Industry Analysis, Insights and Forecast, 2019-2031
- 6.1. Market Analysis, Insights and Forecast - by Disc Type
- 6.1.1. Cervical Artificial Disc
- 6.1.2. Lumbar Artificial Disc
- 6.2. Market Analysis, Insights and Forecast - by Material Type
- 6.2.1. Metal on Metal
- 6.2.2. Metal on Polymer
- 6.1. Market Analysis, Insights and Forecast - by Disc Type
- 7. Europe Artificial Cervical Disc Industry Analysis, Insights and Forecast, 2019-2031
- 7.1. Market Analysis, Insights and Forecast - by Disc Type
- 7.1.1. Cervical Artificial Disc
- 7.1.2. Lumbar Artificial Disc
- 7.2. Market Analysis, Insights and Forecast - by Material Type
- 7.2.1. Metal on Metal
- 7.2.2. Metal on Polymer
- 7.1. Market Analysis, Insights and Forecast - by Disc Type
- 8. Asia Pacific Artificial Cervical Disc Industry Analysis, Insights and Forecast, 2019-2031
- 8.1. Market Analysis, Insights and Forecast - by Disc Type
- 8.1.1. Cervical Artificial Disc
- 8.1.2. Lumbar Artificial Disc
- 8.2. Market Analysis, Insights and Forecast - by Material Type
- 8.2.1. Metal on Metal
- 8.2.2. Metal on Polymer
- 8.1. Market Analysis, Insights and Forecast - by Disc Type
- 9. Middle East and Africa Artificial Cervical Disc Industry Analysis, Insights and Forecast, 2019-2031
- 9.1. Market Analysis, Insights and Forecast - by Disc Type
- 9.1.1. Cervical Artificial Disc
- 9.1.2. Lumbar Artificial Disc
- 9.2. Market Analysis, Insights and Forecast - by Material Type
- 9.2.1. Metal on Metal
- 9.2.2. Metal on Polymer
- 9.1. Market Analysis, Insights and Forecast - by Disc Type
- 10. South America Artificial Cervical Disc Industry Analysis, Insights and Forecast, 2019-2031
- 10.1. Market Analysis, Insights and Forecast - by Disc Type
- 10.1.1. Cervical Artificial Disc
- 10.1.2. Lumbar Artificial Disc
- 10.2. Market Analysis, Insights and Forecast - by Material Type
- 10.2.1. Metal on Metal
- 10.2.2. Metal on Polymer
- 10.1. Market Analysis, Insights and Forecast - by Disc Type
- 11. North America Artificial Cervical Disc Industry Analysis, Insights and Forecast, 2019-2031
- 11.1. Market Analysis, Insights and Forecast - By Country/Sub-region
- 11.1.1. undefined
- 12. Europe Artificial Cervical Disc Industry Analysis, Insights and Forecast, 2019-2031
- 12.1. Market Analysis, Insights and Forecast - By Country/Sub-region
- 12.1.1. undefined
- 13. Asia Pacific Artificial Cervical Disc Industry Analysis, Insights and Forecast, 2019-2031
- 13.1. Market Analysis, Insights and Forecast - By Country/Sub-region
- 13.1.1. undefined
- 14. Middle East and Africa Artificial Cervical Disc Industry Analysis, Insights and Forecast, 2019-2031
- 14.1. Market Analysis, Insights and Forecast - By Country/Sub-region
- 14.1.1. undefined
- 15. South America Artificial Cervical Disc Industry Analysis, Insights and Forecast, 2019-2031
- 15.1. Market Analysis, Insights and Forecast - By Country/Sub-region
- 15.1.1. undefined
- 16. Competitive Analysis
- 16.1. Global Market Share Analysis 2024
- 16.2. Company Profiles
- 16.2.1 Zimmer Biomet
- 16.2.1.1. Overview
- 16.2.1.2. Products
- 16.2.1.3. SWOT Analysis
- 16.2.1.4. Recent Developments
- 16.2.1.5. Financials (Based on Availability)
- 16.2.2 Centinel Spine LLC
- 16.2.2.1. Overview
- 16.2.2.2. Products
- 16.2.2.3. SWOT Analysis
- 16.2.2.4. Recent Developments
- 16.2.2.5. Financials (Based on Availability)
- 16.2.3 Medtronic PLC
- 16.2.3.1. Overview
- 16.2.3.2. Products
- 16.2.3.3. SWOT Analysis
- 16.2.3.4. Recent Developments
- 16.2.3.5. Financials (Based on Availability)
- 16.2.4 Prodorth Spine
- 16.2.4.1. Overview
- 16.2.4.2. Products
- 16.2.4.3. SWOT Analysis
- 16.2.4.4. Recent Developments
- 16.2.4.5. Financials (Based on Availability)
- 16.2.5 Globus Medical
- 16.2.5.1. Overview
- 16.2.5.2. Products
- 16.2.5.3. SWOT Analysis
- 16.2.5.4. Recent Developments
- 16.2.5.5. Financials (Based on Availability)
- 16.2.6 Orthofix Medical Inc
- 16.2.6.1. Overview
- 16.2.6.2. Products
- 16.2.6.3. SWOT Analysis
- 16.2.6.4. Recent Developments
- 16.2.6.5. Financials (Based on Availability)
- 16.2.7 B Braun Melsungen
- 16.2.7.1. Overview
- 16.2.7.2. Products
- 16.2.7.3. SWOT Analysis
- 16.2.7.4. Recent Developments
- 16.2.7.5. Financials (Based on Availability)
- 16.2.8 Synergy Spine Solutions Inc
- 16.2.8.1. Overview
- 16.2.8.2. Products
- 16.2.8.3. SWOT Analysis
- 16.2.8.4. Recent Developments
- 16.2.8.5. Financials (Based on Availability)
- 16.2.9 Spineart SA
- 16.2.9.1. Overview
- 16.2.9.2. Products
- 16.2.9.3. SWOT Analysis
- 16.2.9.4. Recent Developments
- 16.2.9.5. Financials (Based on Availability)
- 16.2.10 NuVasive Inc
- 16.2.10.1. Overview
- 16.2.10.2. Products
- 16.2.10.3. SWOT Analysis
- 16.2.10.4. Recent Developments
- 16.2.10.5. Financials (Based on Availability)
- 16.2.11 AxioMed LLC
- 16.2.11.1. Overview
- 16.2.11.2. Products
- 16.2.11.3. SWOT Analysis
- 16.2.11.4. Recent Developments
- 16.2.11.5. Financials (Based on Availability)
- 16.2.1 Zimmer Biomet
List of Figures
- Figure 1: Global Artificial Cervical Disc Industry Revenue Breakdown (Million, %) by Region 2024 & 2032
- Figure 2: Global Artificial Cervical Disc Industry Volume Breakdown (K Unit, %) by Region 2024 & 2032
- Figure 3: North America Artificial Cervical Disc Industry Revenue (Million), by Country 2024 & 2032
- Figure 4: North America Artificial Cervical Disc Industry Volume (K Unit), by Country 2024 & 2032
- Figure 5: North America Artificial Cervical Disc Industry Revenue Share (%), by Country 2024 & 2032
- Figure 6: North America Artificial Cervical Disc Industry Volume Share (%), by Country 2024 & 2032
- Figure 7: Europe Artificial Cervical Disc Industry Revenue (Million), by Country 2024 & 2032
- Figure 8: Europe Artificial Cervical Disc Industry Volume (K Unit), by Country 2024 & 2032
- Figure 9: Europe Artificial Cervical Disc Industry Revenue Share (%), by Country 2024 & 2032
- Figure 10: Europe Artificial Cervical Disc Industry Volume Share (%), by Country 2024 & 2032
- Figure 11: Asia Pacific Artificial Cervical Disc Industry Revenue (Million), by Country 2024 & 2032
- Figure 12: Asia Pacific Artificial Cervical Disc Industry Volume (K Unit), by Country 2024 & 2032
- Figure 13: Asia Pacific Artificial Cervical Disc Industry Revenue Share (%), by Country 2024 & 2032
- Figure 14: Asia Pacific Artificial Cervical Disc Industry Volume Share (%), by Country 2024 & 2032
- Figure 15: Middle East and Africa Artificial Cervical Disc Industry Revenue (Million), by Country 2024 & 2032
- Figure 16: Middle East and Africa Artificial Cervical Disc Industry Volume (K Unit), by Country 2024 & 2032
- Figure 17: Middle East and Africa Artificial Cervical Disc Industry Revenue Share (%), by Country 2024 & 2032
- Figure 18: Middle East and Africa Artificial Cervical Disc Industry Volume Share (%), by Country 2024 & 2032
- Figure 19: South America Artificial Cervical Disc Industry Revenue (Million), by Country 2024 & 2032
- Figure 20: South America Artificial Cervical Disc Industry Volume (K Unit), by Country 2024 & 2032
- Figure 21: South America Artificial Cervical Disc Industry Revenue Share (%), by Country 2024 & 2032
- Figure 22: South America Artificial Cervical Disc Industry Volume Share (%), by Country 2024 & 2032
- Figure 23: North America Artificial Cervical Disc Industry Revenue (Million), by Disc Type 2024 & 2032
- Figure 24: North America Artificial Cervical Disc Industry Volume (K Unit), by Disc Type 2024 & 2032
- Figure 25: North America Artificial Cervical Disc Industry Revenue Share (%), by Disc Type 2024 & 2032
- Figure 26: North America Artificial Cervical Disc Industry Volume Share (%), by Disc Type 2024 & 2032
- Figure 27: North America Artificial Cervical Disc Industry Revenue (Million), by Material Type 2024 & 2032
- Figure 28: North America Artificial Cervical Disc Industry Volume (K Unit), by Material Type 2024 & 2032
- Figure 29: North America Artificial Cervical Disc Industry Revenue Share (%), by Material Type 2024 & 2032
- Figure 30: North America Artificial Cervical Disc Industry Volume Share (%), by Material Type 2024 & 2032
- Figure 31: North America Artificial Cervical Disc Industry Revenue (Million), by Country 2024 & 2032
- Figure 32: North America Artificial Cervical Disc Industry Volume (K Unit), by Country 2024 & 2032
- Figure 33: North America Artificial Cervical Disc Industry Revenue Share (%), by Country 2024 & 2032
- Figure 34: North America Artificial Cervical Disc Industry Volume Share (%), by Country 2024 & 2032
- Figure 35: Europe Artificial Cervical Disc Industry Revenue (Million), by Disc Type 2024 & 2032
- Figure 36: Europe Artificial Cervical Disc Industry Volume (K Unit), by Disc Type 2024 & 2032
- Figure 37: Europe Artificial Cervical Disc Industry Revenue Share (%), by Disc Type 2024 & 2032
- Figure 38: Europe Artificial Cervical Disc Industry Volume Share (%), by Disc Type 2024 & 2032
- Figure 39: Europe Artificial Cervical Disc Industry Revenue (Million), by Material Type 2024 & 2032
- Figure 40: Europe Artificial Cervical Disc Industry Volume (K Unit), by Material Type 2024 & 2032
- Figure 41: Europe Artificial Cervical Disc Industry Revenue Share (%), by Material Type 2024 & 2032
- Figure 42: Europe Artificial Cervical Disc Industry Volume Share (%), by Material Type 2024 & 2032
- Figure 43: Europe Artificial Cervical Disc Industry Revenue (Million), by Country 2024 & 2032
- Figure 44: Europe Artificial Cervical Disc Industry Volume (K Unit), by Country 2024 & 2032
- Figure 45: Europe Artificial Cervical Disc Industry Revenue Share (%), by Country 2024 & 2032
- Figure 46: Europe Artificial Cervical Disc Industry Volume Share (%), by Country 2024 & 2032
- Figure 47: Asia Pacific Artificial Cervical Disc Industry Revenue (Million), by Disc Type 2024 & 2032
- Figure 48: Asia Pacific Artificial Cervical Disc Industry Volume (K Unit), by Disc Type 2024 & 2032
- Figure 49: Asia Pacific Artificial Cervical Disc Industry Revenue Share (%), by Disc Type 2024 & 2032
- Figure 50: Asia Pacific Artificial Cervical Disc Industry Volume Share (%), by Disc Type 2024 & 2032
- Figure 51: Asia Pacific Artificial Cervical Disc Industry Revenue (Million), by Material Type 2024 & 2032
- Figure 52: Asia Pacific Artificial Cervical Disc Industry Volume (K Unit), by Material Type 2024 & 2032
- Figure 53: Asia Pacific Artificial Cervical Disc Industry Revenue Share (%), by Material Type 2024 & 2032
- Figure 54: Asia Pacific Artificial Cervical Disc Industry Volume Share (%), by Material Type 2024 & 2032
- Figure 55: Asia Pacific Artificial Cervical Disc Industry Revenue (Million), by Country 2024 & 2032
- Figure 56: Asia Pacific Artificial Cervical Disc Industry Volume (K Unit), by Country 2024 & 2032
- Figure 57: Asia Pacific Artificial Cervical Disc Industry Revenue Share (%), by Country 2024 & 2032
- Figure 58: Asia Pacific Artificial Cervical Disc Industry Volume Share (%), by Country 2024 & 2032
- Figure 59: Middle East and Africa Artificial Cervical Disc Industry Revenue (Million), by Disc Type 2024 & 2032
- Figure 60: Middle East and Africa Artificial Cervical Disc Industry Volume (K Unit), by Disc Type 2024 & 2032
- Figure 61: Middle East and Africa Artificial Cervical Disc Industry Revenue Share (%), by Disc Type 2024 & 2032
- Figure 62: Middle East and Africa Artificial Cervical Disc Industry Volume Share (%), by Disc Type 2024 & 2032
- Figure 63: Middle East and Africa Artificial Cervical Disc Industry Revenue (Million), by Material Type 2024 & 2032
- Figure 64: Middle East and Africa Artificial Cervical Disc Industry Volume (K Unit), by Material Type 2024 & 2032
- Figure 65: Middle East and Africa Artificial Cervical Disc Industry Revenue Share (%), by Material Type 2024 & 2032
- Figure 66: Middle East and Africa Artificial Cervical Disc Industry Volume Share (%), by Material Type 2024 & 2032
- Figure 67: Middle East and Africa Artificial Cervical Disc Industry Revenue (Million), by Country 2024 & 2032
- Figure 68: Middle East and Africa Artificial Cervical Disc Industry Volume (K Unit), by Country 2024 & 2032
- Figure 69: Middle East and Africa Artificial Cervical Disc Industry Revenue Share (%), by Country 2024 & 2032
- Figure 70: Middle East and Africa Artificial Cervical Disc Industry Volume Share (%), by Country 2024 & 2032
- Figure 71: South America Artificial Cervical Disc Industry Revenue (Million), by Disc Type 2024 & 2032
- Figure 72: South America Artificial Cervical Disc Industry Volume (K Unit), by Disc Type 2024 & 2032
- Figure 73: South America Artificial Cervical Disc Industry Revenue Share (%), by Disc Type 2024 & 2032
- Figure 74: South America Artificial Cervical Disc Industry Volume Share (%), by Disc Type 2024 & 2032
- Figure 75: South America Artificial Cervical Disc Industry Revenue (Million), by Material Type 2024 & 2032
- Figure 76: South America Artificial Cervical Disc Industry Volume (K Unit), by Material Type 2024 & 2032
- Figure 77: South America Artificial Cervical Disc Industry Revenue Share (%), by Material Type 2024 & 2032
- Figure 78: South America Artificial Cervical Disc Industry Volume Share (%), by Material Type 2024 & 2032
- Figure 79: South America Artificial Cervical Disc Industry Revenue (Million), by Country 2024 & 2032
- Figure 80: South America Artificial Cervical Disc Industry Volume (K Unit), by Country 2024 & 2032
- Figure 81: South America Artificial Cervical Disc Industry Revenue Share (%), by Country 2024 & 2032
- Figure 82: South America Artificial Cervical Disc Industry Volume Share (%), by Country 2024 & 2032
List of Tables
- Table 1: Global Artificial Cervical Disc Industry Revenue Million Forecast, by Region 2019 & 2032
- Table 2: Global Artificial Cervical Disc Industry Volume K Unit Forecast, by Region 2019 & 2032
- Table 3: Global Artificial Cervical Disc Industry Revenue Million Forecast, by Disc Type 2019 & 2032
- Table 4: Global Artificial Cervical Disc Industry Volume K Unit Forecast, by Disc Type 2019 & 2032
- Table 5: Global Artificial Cervical Disc Industry Revenue Million Forecast, by Material Type 2019 & 2032
- Table 6: Global Artificial Cervical Disc Industry Volume K Unit Forecast, by Material Type 2019 & 2032
- Table 7: Global Artificial Cervical Disc Industry Revenue Million Forecast, by Region 2019 & 2032
- Table 8: Global Artificial Cervical Disc Industry Volume K Unit Forecast, by Region 2019 & 2032
- Table 9: Global Artificial Cervical Disc Industry Revenue Million Forecast, by Country 2019 & 2032
- Table 10: Global Artificial Cervical Disc Industry Volume K Unit Forecast, by Country 2019 & 2032
- Table 11: Global Artificial Cervical Disc Industry Revenue Million Forecast, by Country 2019 & 2032
- Table 12: Global Artificial Cervical Disc Industry Volume K Unit Forecast, by Country 2019 & 2032
- Table 13: Global Artificial Cervical Disc Industry Revenue Million Forecast, by Country 2019 & 2032
- Table 14: Global Artificial Cervical Disc Industry Volume K Unit Forecast, by Country 2019 & 2032
- Table 15: Global Artificial Cervical Disc Industry Revenue Million Forecast, by Country 2019 & 2032
- Table 16: Global Artificial Cervical Disc Industry Volume K Unit Forecast, by Country 2019 & 2032
- Table 17: Global Artificial Cervical Disc Industry Revenue Million Forecast, by Country 2019 & 2032
- Table 18: Global Artificial Cervical Disc Industry Volume K Unit Forecast, by Country 2019 & 2032
- Table 19: Global Artificial Cervical Disc Industry Revenue Million Forecast, by Disc Type 2019 & 2032
- Table 20: Global Artificial Cervical Disc Industry Volume K Unit Forecast, by Disc Type 2019 & 2032
- Table 21: Global Artificial Cervical Disc Industry Revenue Million Forecast, by Material Type 2019 & 2032
- Table 22: Global Artificial Cervical Disc Industry Volume K Unit Forecast, by Material Type 2019 & 2032
- Table 23: Global Artificial Cervical Disc Industry Revenue Million Forecast, by Country 2019 & 2032
- Table 24: Global Artificial Cervical Disc Industry Volume K Unit Forecast, by Country 2019 & 2032
- Table 25: United States Artificial Cervical Disc Industry Revenue (Million) Forecast, by Application 2019 & 2032
- Table 26: United States Artificial Cervical Disc Industry Volume (K Unit) Forecast, by Application 2019 & 2032
- Table 27: Canada Artificial Cervical Disc Industry Revenue (Million) Forecast, by Application 2019 & 2032
- Table 28: Canada Artificial Cervical Disc Industry Volume (K Unit) Forecast, by Application 2019 & 2032
- Table 29: Mexico Artificial Cervical Disc Industry Revenue (Million) Forecast, by Application 2019 & 2032
- Table 30: Mexico Artificial Cervical Disc Industry Volume (K Unit) Forecast, by Application 2019 & 2032
- Table 31: Global Artificial Cervical Disc Industry Revenue Million Forecast, by Disc Type 2019 & 2032
- Table 32: Global Artificial Cervical Disc Industry Volume K Unit Forecast, by Disc Type 2019 & 2032
- Table 33: Global Artificial Cervical Disc Industry Revenue Million Forecast, by Material Type 2019 & 2032
- Table 34: Global Artificial Cervical Disc Industry Volume K Unit Forecast, by Material Type 2019 & 2032
- Table 35: Global Artificial Cervical Disc Industry Revenue Million Forecast, by Country 2019 & 2032
- Table 36: Global Artificial Cervical Disc Industry Volume K Unit Forecast, by Country 2019 & 2032
- Table 37: Germany Artificial Cervical Disc Industry Revenue (Million) Forecast, by Application 2019 & 2032
- Table 38: Germany Artificial Cervical Disc Industry Volume (K Unit) Forecast, by Application 2019 & 2032
- Table 39: United Kingdom Artificial Cervical Disc Industry Revenue (Million) Forecast, by Application 2019 & 2032
- Table 40: United Kingdom Artificial Cervical Disc Industry Volume (K Unit) Forecast, by Application 2019 & 2032
- Table 41: France Artificial Cervical Disc Industry Revenue (Million) Forecast, by Application 2019 & 2032
- Table 42: France Artificial Cervical Disc Industry Volume (K Unit) Forecast, by Application 2019 & 2032
- Table 43: Italy Artificial Cervical Disc Industry Revenue (Million) Forecast, by Application 2019 & 2032
- Table 44: Italy Artificial Cervical Disc Industry Volume (K Unit) Forecast, by Application 2019 & 2032
- Table 45: Spain Artificial Cervical Disc Industry Revenue (Million) Forecast, by Application 2019 & 2032
- Table 46: Spain Artificial Cervical Disc Industry Volume (K Unit) Forecast, by Application 2019 & 2032
- Table 47: Rest of Europe Artificial Cervical Disc Industry Revenue (Million) Forecast, by Application 2019 & 2032
- Table 48: Rest of Europe Artificial Cervical Disc Industry Volume (K Unit) Forecast, by Application 2019 & 2032
- Table 49: Global Artificial Cervical Disc Industry Revenue Million Forecast, by Disc Type 2019 & 2032
- Table 50: Global Artificial Cervical Disc Industry Volume K Unit Forecast, by Disc Type 2019 & 2032
- Table 51: Global Artificial Cervical Disc Industry Revenue Million Forecast, by Material Type 2019 & 2032
- Table 52: Global Artificial Cervical Disc Industry Volume K Unit Forecast, by Material Type 2019 & 2032
- Table 53: Global Artificial Cervical Disc Industry Revenue Million Forecast, by Country 2019 & 2032
- Table 54: Global Artificial Cervical Disc Industry Volume K Unit Forecast, by Country 2019 & 2032
- Table 55: China Artificial Cervical Disc Industry Revenue (Million) Forecast, by Application 2019 & 2032
- Table 56: China Artificial Cervical Disc Industry Volume (K Unit) Forecast, by Application 2019 & 2032
- Table 57: Japan Artificial Cervical Disc Industry Revenue (Million) Forecast, by Application 2019 & 2032
- Table 58: Japan Artificial Cervical Disc Industry Volume (K Unit) Forecast, by Application 2019 & 2032
- Table 59: India Artificial Cervical Disc Industry Revenue (Million) Forecast, by Application 2019 & 2032
- Table 60: India Artificial Cervical Disc Industry Volume (K Unit) Forecast, by Application 2019 & 2032
- Table 61: Australia Artificial Cervical Disc Industry Revenue (Million) Forecast, by Application 2019 & 2032
- Table 62: Australia Artificial Cervical Disc Industry Volume (K Unit) Forecast, by Application 2019 & 2032
- Table 63: South Korea Artificial Cervical Disc Industry Revenue (Million) Forecast, by Application 2019 & 2032
- Table 64: South Korea Artificial Cervical Disc Industry Volume (K Unit) Forecast, by Application 2019 & 2032
- Table 65: Rest of Asia Pacific Artificial Cervical Disc Industry Revenue (Million) Forecast, by Application 2019 & 2032
- Table 66: Rest of Asia Pacific Artificial Cervical Disc Industry Volume (K Unit) Forecast, by Application 2019 & 2032
- Table 67: Global Artificial Cervical Disc Industry Revenue Million Forecast, by Disc Type 2019 & 2032
- Table 68: Global Artificial Cervical Disc Industry Volume K Unit Forecast, by Disc Type 2019 & 2032
- Table 69: Global Artificial Cervical Disc Industry Revenue Million Forecast, by Material Type 2019 & 2032
- Table 70: Global Artificial Cervical Disc Industry Volume K Unit Forecast, by Material Type 2019 & 2032
- Table 71: Global Artificial Cervical Disc Industry Revenue Million Forecast, by Country 2019 & 2032
- Table 72: Global Artificial Cervical Disc Industry Volume K Unit Forecast, by Country 2019 & 2032
- Table 73: GCC Artificial Cervical Disc Industry Revenue (Million) Forecast, by Application 2019 & 2032
- Table 74: GCC Artificial Cervical Disc Industry Volume (K Unit) Forecast, by Application 2019 & 2032
- Table 75: South Africa Artificial Cervical Disc Industry Revenue (Million) Forecast, by Application 2019 & 2032
- Table 76: South Africa Artificial Cervical Disc Industry Volume (K Unit) Forecast, by Application 2019 & 2032
- Table 77: Rest of Middle East and Africa Artificial Cervical Disc Industry Revenue (Million) Forecast, by Application 2019 & 2032
- Table 78: Rest of Middle East and Africa Artificial Cervical Disc Industry Volume (K Unit) Forecast, by Application 2019 & 2032
- Table 79: Global Artificial Cervical Disc Industry Revenue Million Forecast, by Disc Type 2019 & 2032
- Table 80: Global Artificial Cervical Disc Industry Volume K Unit Forecast, by Disc Type 2019 & 2032
- Table 81: Global Artificial Cervical Disc Industry Revenue Million Forecast, by Material Type 2019 & 2032
- Table 82: Global Artificial Cervical Disc Industry Volume K Unit Forecast, by Material Type 2019 & 2032
- Table 83: Global Artificial Cervical Disc Industry Revenue Million Forecast, by Country 2019 & 2032
- Table 84: Global Artificial Cervical Disc Industry Volume K Unit Forecast, by Country 2019 & 2032
- Table 85: Brazil Artificial Cervical Disc Industry Revenue (Million) Forecast, by Application 2019 & 2032
- Table 86: Brazil Artificial Cervical Disc Industry Volume (K Unit) Forecast, by Application 2019 & 2032
- Table 87: Argentina Artificial Cervical Disc Industry Revenue (Million) Forecast, by Application 2019 & 2032
- Table 88: Argentina Artificial Cervical Disc Industry Volume (K Unit) Forecast, by Application 2019 & 2032
- Table 89: Rest of South America Artificial Cervical Disc Industry Revenue (Million) Forecast, by Application 2019 & 2032
- Table 90: Rest of South America Artificial Cervical Disc Industry Volume (K Unit) Forecast, by Application 2019 & 2032
Frequently Asked Questions
1. What is the projected Compound Annual Growth Rate (CAGR) of the Artificial Cervical Disc Industry?
The projected CAGR is approximately 12.50%.
2. Which companies are prominent players in the Artificial Cervical Disc Industry?
Key companies in the market include Zimmer Biomet, Centinel Spine LLC, Medtronic PLC, Prodorth Spine, Globus Medical, Orthofix Medical Inc, B Braun Melsungen, Synergy Spine Solutions Inc, Spineart SA, NuVasive Inc, AxioMed LLC.
3. What are the main segments of the Artificial Cervical Disc Industry?
The market segments include Disc Type, Material Type.
4. Can you provide details about the market size?
The market size is estimated to be USD XX Million as of 2022.
5. What are some drivers contributing to market growth?
Growing Burden of Spine Related Diseases; Increasing Research and Development Activities in Relation to Spine Technologies; Growing Geriatric Population and Increasing Preference for Minimally Invasive Surgeries.
6. What are the notable trends driving market growth?
Cervical Artificial Disc Segment is Expected to Hold a Significant Market Share Over the Forecast Period.
7. Are there any restraints impacting market growth?
Reimbursement Issues; High Cost of Procedures.
8. Can you provide examples of recent developments in the market?
In November 2022, Centinel Spine, LLC announced the first implantation of its prodisc C SK, a cervical artificial disc.
9. What pricing options are available for accessing the report?
Pricing options include single-user, multi-user, and enterprise licenses priced at USD 4750, USD 5250, and USD 8750 respectively.
10. Is the market size provided in terms of value or volume?
The market size is provided in terms of value, measured in Million and volume, measured in K Unit.
11. Are there any specific market keywords associated with the report?
Yes, the market keyword associated with the report is "Artificial Cervical Disc Industry," which aids in identifying and referencing the specific market segment covered.
12. How do I determine which pricing option suits my needs best?
The pricing options vary based on user requirements and access needs. Individual users may opt for single-user licenses, while businesses requiring broader access may choose multi-user or enterprise licenses for cost-effective access to the report.
13. Are there any additional resources or data provided in the Artificial Cervical Disc Industry report?
While the report offers comprehensive insights, it's advisable to review the specific contents or supplementary materials provided to ascertain if additional resources or data are available.
14. How can I stay updated on further developments or reports in the Artificial Cervical Disc Industry?
To stay informed about further developments, trends, and reports in the Artificial Cervical Disc Industry, consider subscribing to industry newsletters, following relevant companies and organizations, or regularly checking reputable industry news sources and publications.
Methodology
Step 1 - Identification of Relevant Samples Size from Population Database


Step 2 - Approaches for Defining Global Market Size (Value, Volume* & Price*)

Note*: In applicable scenarios
Step 3 - Data Sources
Primary Research
- Web Analytics
- Survey Reports
- Research Institute
- Latest Research Reports
- Opinion Leaders
Secondary Research
- Annual Reports
- White Paper
- Latest Press Release
- Industry Association
- Paid Database
- Investor Presentations

Step 4 - Data Triangulation
Involves using different sources of information in order to increase the validity of a study
These sources are likely to be stakeholders in a program - participants, other researchers, program staff, other community members, and so on.
Then we put all data in single framework & apply various statistical tools to find out the dynamic on the market.
During the analysis stage, feedback from the stakeholder groups would be compared to determine areas of agreement as well as areas of divergence


