
Key Insights
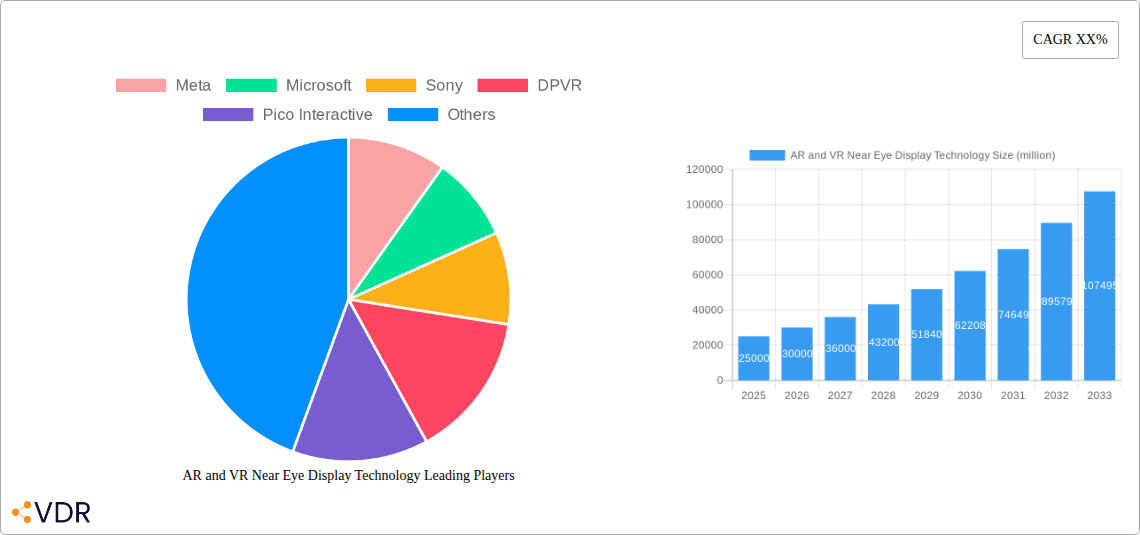
The Augmented Reality (AR) and Virtual Reality (VR) Near Eye Display (NED) technology market is experiencing robust growth, driven by advancements in display technologies, miniaturization, and increasing demand across diverse sectors. The market, estimated at $25 billion in 2025, is projected to exhibit a Compound Annual Growth Rate (CAGR) of 20% between 2025 and 2033, reaching an estimated $120 billion by 2033. This expansion is fueled by several key factors, including the rising adoption of AR/VR headsets in gaming, entertainment, and education; the increasing sophistication of AR/VR applications in industrial training and design; and the development of lighter, more comfortable, and higher-resolution NEDs. Major technology companies like Meta, Microsoft, and Sony, alongside specialized AR/VR companies like Pico Interactive and Nreal, are leading the innovation in this space, fostering competition and driving down costs, which further accelerates market penetration.
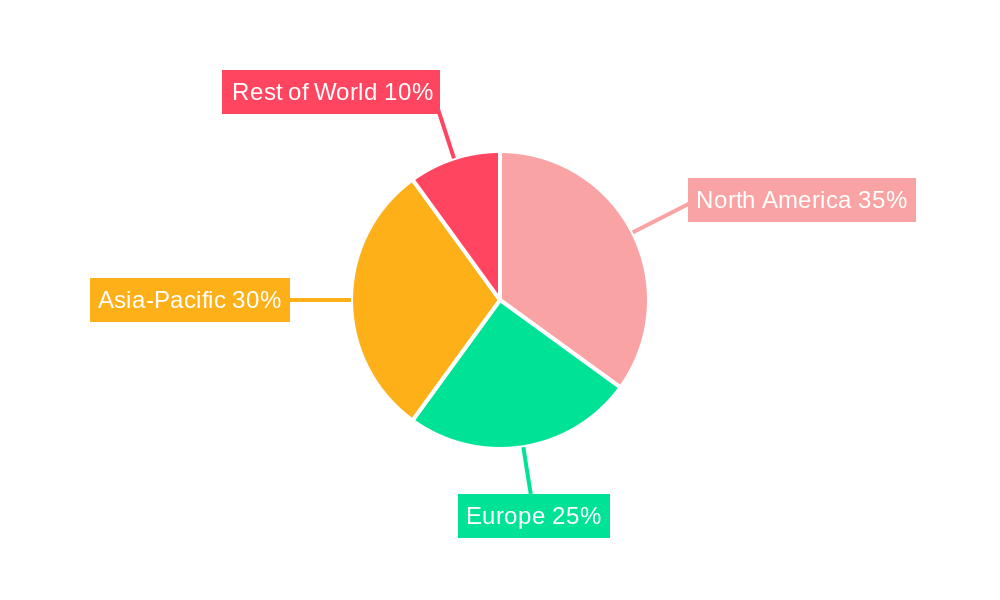
However, challenges remain. High device costs, limited battery life, and concerns about potential health effects related to prolonged use continue to restrain market growth. Further development is needed to address motion sickness issues and improve the overall user experience. Overcoming these challenges through technological advancements, improved user interface designs, and the development of more compelling content will be crucial for unlocking the full potential of the AR/VR NED market. Segmentation within the market is strong, with distinctions based on display type (OLED, LCD, MicroLED), resolution, field of view, and application (gaming, enterprise, healthcare). Regional variations in adoption rates are expected, with North America and Asia-Pacific anticipated to lead the market given their strong technological infrastructure and consumer demand.
AR and VR Near Eye Display Technology Market Report: 2019-2033
This comprehensive report provides an in-depth analysis of the booming AR and VR Near Eye Display (NED) technology market, encompassing market dynamics, growth trends, regional dominance, product landscape, challenges, opportunities, and key players. The study period spans from 2019 to 2033, with a base year of 2025 and a forecast period from 2025 to 2033. This report is essential for industry professionals, investors, and strategists seeking a clear understanding of this rapidly evolving sector. The parent market is the broader consumer electronics and computing market, while the child market is specifically focused on immersive technologies and wearable displays.
AR and VR Near Eye Display Technology Market Dynamics & Structure
The AR/VR NED market is characterized by intense competition among established tech giants and emerging players. Market concentration is currently moderate, with a few dominant players holding significant market share, but fragmentation is expected to increase with the entry of new companies. Technological innovation, particularly in display technologies (microLED, OLED), processing power, and eye-tracking, is a key driver. Regulatory frameworks concerning data privacy and safety are evolving and will impact market growth. Competitive substitutes include traditional screens and other forms of immersive entertainment. End-user demographics are expanding, with growth in both consumer and enterprise applications. M&A activity is frequent, with larger companies acquiring smaller, innovative firms to enhance their technological capabilities.
- Market Concentration: Moderate, evolving towards increased fragmentation. Meta and Microsoft currently hold a leading market share, estimated at xx% and xx% respectively in 2025.
- Technological Innovation: MicroLED, mini-LED, and advanced optics are driving higher resolution, wider fields of view, and improved comfort.
- Regulatory Frameworks: Data privacy regulations (e.g., GDPR) and safety standards are influencing product development and market access.
- M&A Activity: xx major M&A deals were recorded between 2019 and 2024, with an anticipated xx deals in the forecast period.
- Innovation Barriers: High R&D costs, complex supply chains, and challenges in miniaturizing components.
AR and VR Near Eye Display Technology Growth Trends & Insights
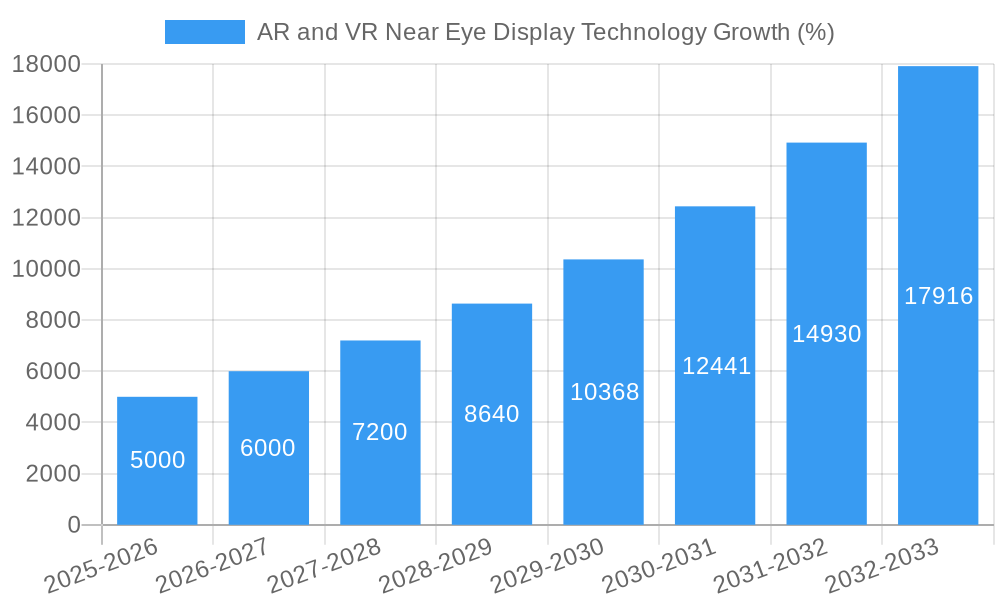
The global AR/VR NED market witnessed significant growth during the historical period (2019-2024), driven by increasing consumer demand for immersive experiences and technological advancements. The market size is projected to reach xx million units in 2025, exhibiting a CAGR of xx% from 2025 to 2033. Adoption rates are rising steadily, fueled by falling prices, improved user experiences, and the expansion of applications across various sectors. Technological disruptions, such as the introduction of more efficient and compact displays, are continuously shaping market dynamics. Consumer behavior is shifting towards a preference for more lightweight, comfortable, and feature-rich NED devices. The market is expected to be significantly influenced by the metaverse's growth, increasing demand for advanced AR/VR solutions, and the emergence of novel applications in gaming, education, healthcare and industrial sectors.
Dominant Regions, Countries, or Segments in AR and VR Near Eye Display Technology
North America and Asia are currently the leading regions for AR/VR NED market growth. North America's dominance is attributable to strong technological innovation, early adoption by consumers, and robust research and development activities. Asia, particularly China, is experiencing rapid growth due to a large and expanding consumer base, increasing government support for the technology sector, and a surge in domestic manufacturing. Within these regions, specific countries like the US, China, Japan, and South Korea exhibit significantly higher growth rates compared to other nations. The gaming and entertainment segment are currently leading the growth, followed by the enterprise and industrial sectors.
- Key Drivers (North America): Strong consumer demand, advanced technological infrastructure, significant R&D investment.
- Key Drivers (Asia): Large consumer base, government support for technology development, manufacturing capabilities.
- Segment Dominance: Gaming and Entertainment leads, followed by Enterprise/Industrial applications with steady growth in Healthcare and Education.
AR and VR Near Eye Display Technology Product Landscape
The AR/VR NED product landscape is evolving rapidly, with new devices and features being introduced regularly. This includes advancements in display technologies (higher resolution, wider field of view, improved color accuracy), improved comfort and ergonomics, more intuitive interfaces, and increasing integration of various sensors (eye-tracking, hand-tracking). Unique selling propositions include features like haptic feedback, advanced audio systems, and seamless integration with mobile devices. Technological advancements are focused on addressing limitations such as field-of-view, resolution, weight, and power consumption.
Key Drivers, Barriers & Challenges in AR and VR Near Eye Display Technology
Key Drivers:
- Increasing consumer demand for immersive experiences.
- Advancements in display technologies and processing power.
- Expansion of applications across various sectors.
- Growing investments in R&D and innovation.
Key Challenges:
- High cost of devices and development.
- Supply chain disruptions and component shortages (e.g. xx% shortage in specific microchips in 2024).
- Health and safety concerns regarding prolonged use.
- Regulatory hurdles and data privacy concerns.
Emerging Opportunities in AR and VR Near Eye Display Technology
- Untapped markets in developing countries.
- Innovative applications in education, healthcare, and training.
- Integration with IoT devices and smart environments.
- Development of lightweight, comfortable, and stylish devices.
Growth Accelerators in the AR and VR Near Eye Display Technology Industry
Technological breakthroughs, especially in display technologies and miniaturization, are crucial growth accelerators. Strategic partnerships between technology companies and content creators are expanding the ecosystem and driving market demand. Market expansion strategies targeting new demographics and sectors will significantly accelerate market growth. The integration of AR/VR with other technologies like 5G, AI and cloud computing will also be a significant factor in driving growth.
Key Players Shaping the AR and VR Near Eye Display Technology Market
- Meta
- Microsoft
- Sony
- DPVR
- Pico Interactive
- HTC
- Pimax
- Vuzix Corporation
- Lenovo
- Epson
- MAD Gaze
- Magic Leap
- Nreal
Notable Milestones in AR and VR Near Eye Display Technology Sector
- 2020: Meta launched the Oculus Quest 2, driving widespread adoption of standalone VR headsets.
- 2021: Significant advancements in microLED display technology were announced by several companies.
- 2022: Apple's rumored entry into the AR/VR market heightened anticipation and investment.
- 2023: Several major acquisitions and partnerships reshaped the competitive landscape.
In-Depth AR and VR Near Eye Display Technology Market Outlook
The future of the AR/VR NED market is exceptionally promising. Continuous technological innovation, coupled with growing consumer adoption and expansion into new markets, is poised to fuel significant growth over the forecast period. Strategic investments in R&D and the development of innovative applications across various sectors will shape the market's trajectory. The integration of AR/VR with other emerging technologies will further drive market expansion and create exciting new opportunities. The market is expected to maintain a high growth trajectory, driven by increasing technological advancements and market expansion.
AR and VR Near Eye Display Technology Segmentation
-
1. Application
- 1.1. Entertainment
- 1.2. Medicine
- 1.3. Industry
- 1.4. Education
- 1.5. Others
-
2. Types
- 2.1. AR Near Eye Display Technology
- 2.2. VR Near Eye Display Technology
AR and VR Near Eye Display Technology Segmentation By Geography
-
1. North America
- 1.1. United States
- 1.2. Canada
- 1.3. Mexico
-
2. South America
- 2.1. Brazil
- 2.2. Argentina
- 2.3. Rest of South America
-
3. Europe
- 3.1. United Kingdom
- 3.2. Germany
- 3.3. France
- 3.4. Italy
- 3.5. Spain
- 3.6. Russia
- 3.7. Benelux
- 3.8. Nordics
- 3.9. Rest of Europe
-
4. Middle East & Africa
- 4.1. Turkey
- 4.2. Israel
- 4.3. GCC
- 4.4. North Africa
- 4.5. South Africa
- 4.6. Rest of Middle East & Africa
-
5. Asia Pacific
- 5.1. China
- 5.2. India
- 5.3. Japan
- 5.4. South Korea
- 5.5. ASEAN
- 5.6. Oceania
- 5.7. Rest of Asia Pacific
AR and VR Near Eye Display Technology REPORT HIGHLIGHTS
| Aspects | Details |
|---|---|
| Study Period | 2019-2033 |
| Base Year | 2024 |
| Estimated Year | 2025 |
| Forecast Period | 2025-2033 |
| Historical Period | 2019-2024 |
| Growth Rate | CAGR of XX% from 2019-2033 |
| Segmentation |
|
Table of Contents
- 1. Introduction
- 1.1. Research Scope
- 1.2. Market Segmentation
- 1.3. Research Methodology
- 1.4. Definitions and Assumptions
- 2. Executive Summary
- 2.1. Introduction
- 3. Market Dynamics
- 3.1. Introduction
- 3.2. Market Drivers
- 3.3. Market Restrains
- 3.4. Market Trends
- 4. Market Factor Analysis
- 4.1. Porters Five Forces
- 4.2. Supply/Value Chain
- 4.3. PESTEL analysis
- 4.4. Market Entropy
- 4.5. Patent/Trademark Analysis
- 5. Global AR and VR Near Eye Display Technology Analysis, Insights and Forecast, 2019-2031
- 5.1. Market Analysis, Insights and Forecast - by Application
- 5.1.1. Entertainment
- 5.1.2. Medicine
- 5.1.3. Industry
- 5.1.4. Education
- 5.1.5. Others
- 5.2. Market Analysis, Insights and Forecast - by Types
- 5.2.1. AR Near Eye Display Technology
- 5.2.2. VR Near Eye Display Technology
- 5.3. Market Analysis, Insights and Forecast - by Region
- 5.3.1. North America
- 5.3.2. South America
- 5.3.3. Europe
- 5.3.4. Middle East & Africa
- 5.3.5. Asia Pacific
- 5.1. Market Analysis, Insights and Forecast - by Application
- 6. North America AR and VR Near Eye Display Technology Analysis, Insights and Forecast, 2019-2031
- 6.1. Market Analysis, Insights and Forecast - by Application
- 6.1.1. Entertainment
- 6.1.2. Medicine
- 6.1.3. Industry
- 6.1.4. Education
- 6.1.5. Others
- 6.2. Market Analysis, Insights and Forecast - by Types
- 6.2.1. AR Near Eye Display Technology
- 6.2.2. VR Near Eye Display Technology
- 6.1. Market Analysis, Insights and Forecast - by Application
- 7. South America AR and VR Near Eye Display Technology Analysis, Insights and Forecast, 2019-2031
- 7.1. Market Analysis, Insights and Forecast - by Application
- 7.1.1. Entertainment
- 7.1.2. Medicine
- 7.1.3. Industry
- 7.1.4. Education
- 7.1.5. Others
- 7.2. Market Analysis, Insights and Forecast - by Types
- 7.2.1. AR Near Eye Display Technology
- 7.2.2. VR Near Eye Display Technology
- 7.1. Market Analysis, Insights and Forecast - by Application
- 8. Europe AR and VR Near Eye Display Technology Analysis, Insights and Forecast, 2019-2031
- 8.1. Market Analysis, Insights and Forecast - by Application
- 8.1.1. Entertainment
- 8.1.2. Medicine
- 8.1.3. Industry
- 8.1.4. Education
- 8.1.5. Others
- 8.2. Market Analysis, Insights and Forecast - by Types
- 8.2.1. AR Near Eye Display Technology
- 8.2.2. VR Near Eye Display Technology
- 8.1. Market Analysis, Insights and Forecast - by Application
- 9. Middle East & Africa AR and VR Near Eye Display Technology Analysis, Insights and Forecast, 2019-2031
- 9.1. Market Analysis, Insights and Forecast - by Application
- 9.1.1. Entertainment
- 9.1.2. Medicine
- 9.1.3. Industry
- 9.1.4. Education
- 9.1.5. Others
- 9.2. Market Analysis, Insights and Forecast - by Types
- 9.2.1. AR Near Eye Display Technology
- 9.2.2. VR Near Eye Display Technology
- 9.1. Market Analysis, Insights and Forecast - by Application
- 10. Asia Pacific AR and VR Near Eye Display Technology Analysis, Insights and Forecast, 2019-2031
- 10.1. Market Analysis, Insights and Forecast - by Application
- 10.1.1. Entertainment
- 10.1.2. Medicine
- 10.1.3. Industry
- 10.1.4. Education
- 10.1.5. Others
- 10.2. Market Analysis, Insights and Forecast - by Types
- 10.2.1. AR Near Eye Display Technology
- 10.2.2. VR Near Eye Display Technology
- 10.1. Market Analysis, Insights and Forecast - by Application
- 11. Competitive Analysis
- 11.1. Global Market Share Analysis 2024
- 11.2. Company Profiles
- 11.2.1 Meta
- 11.2.1.1. Overview
- 11.2.1.2. Products
- 11.2.1.3. SWOT Analysis
- 11.2.1.4. Recent Developments
- 11.2.1.5. Financials (Based on Availability)
- 11.2.2 Microsoft
- 11.2.2.1. Overview
- 11.2.2.2. Products
- 11.2.2.3. SWOT Analysis
- 11.2.2.4. Recent Developments
- 11.2.2.5. Financials (Based on Availability)
- 11.2.3 Sony
- 11.2.3.1. Overview
- 11.2.3.2. Products
- 11.2.3.3. SWOT Analysis
- 11.2.3.4. Recent Developments
- 11.2.3.5. Financials (Based on Availability)
- 11.2.4 DPVR
- 11.2.4.1. Overview
- 11.2.4.2. Products
- 11.2.4.3. SWOT Analysis
- 11.2.4.4. Recent Developments
- 11.2.4.5. Financials (Based on Availability)
- 11.2.5 Pico Interactive
- 11.2.5.1. Overview
- 11.2.5.2. Products
- 11.2.5.3. SWOT Analysis
- 11.2.5.4. Recent Developments
- 11.2.5.5. Financials (Based on Availability)
- 11.2.6 Google
- 11.2.6.1. Overview
- 11.2.6.2. Products
- 11.2.6.3. SWOT Analysis
- 11.2.6.4. Recent Developments
- 11.2.6.5. Financials (Based on Availability)
- 11.2.7 HTC
- 11.2.7.1. Overview
- 11.2.7.2. Products
- 11.2.7.3. SWOT Analysis
- 11.2.7.4. Recent Developments
- 11.2.7.5. Financials (Based on Availability)
- 11.2.8 Pimax
- 11.2.8.1. Overview
- 11.2.8.2. Products
- 11.2.8.3. SWOT Analysis
- 11.2.8.4. Recent Developments
- 11.2.8.5. Financials (Based on Availability)
- 11.2.9 Vuzix Corporation
- 11.2.9.1. Overview
- 11.2.9.2. Products
- 11.2.9.3. SWOT Analysis
- 11.2.9.4. Recent Developments
- 11.2.9.5. Financials (Based on Availability)
- 11.2.10 Lenovo
- 11.2.10.1. Overview
- 11.2.10.2. Products
- 11.2.10.3. SWOT Analysis
- 11.2.10.4. Recent Developments
- 11.2.10.5. Financials (Based on Availability)
- 11.2.11 Epson
- 11.2.11.1. Overview
- 11.2.11.2. Products
- 11.2.11.3. SWOT Analysis
- 11.2.11.4. Recent Developments
- 11.2.11.5. Financials (Based on Availability)
- 11.2.12 MAD Gaze
- 11.2.12.1. Overview
- 11.2.12.2. Products
- 11.2.12.3. SWOT Analysis
- 11.2.12.4. Recent Developments
- 11.2.12.5. Financials (Based on Availability)
- 11.2.13 Magic Leap
- 11.2.13.1. Overview
- 11.2.13.2. Products
- 11.2.13.3. SWOT Analysis
- 11.2.13.4. Recent Developments
- 11.2.13.5. Financials (Based on Availability)
- 11.2.14 Nreal
- 11.2.14.1. Overview
- 11.2.14.2. Products
- 11.2.14.3. SWOT Analysis
- 11.2.14.4. Recent Developments
- 11.2.14.5. Financials (Based on Availability)
- 11.2.1 Meta
List of Figures
- Figure 1: Global AR and VR Near Eye Display Technology Revenue Breakdown (million, %) by Region 2024 & 2032
- Figure 2: North America AR and VR Near Eye Display Technology Revenue (million), by Application 2024 & 2032
- Figure 3: North America AR and VR Near Eye Display Technology Revenue Share (%), by Application 2024 & 2032
- Figure 4: North America AR and VR Near Eye Display Technology Revenue (million), by Types 2024 & 2032
- Figure 5: North America AR and VR Near Eye Display Technology Revenue Share (%), by Types 2024 & 2032
- Figure 6: North America AR and VR Near Eye Display Technology Revenue (million), by Country 2024 & 2032
- Figure 7: North America AR and VR Near Eye Display Technology Revenue Share (%), by Country 2024 & 2032
- Figure 8: South America AR and VR Near Eye Display Technology Revenue (million), by Application 2024 & 2032
- Figure 9: South America AR and VR Near Eye Display Technology Revenue Share (%), by Application 2024 & 2032
- Figure 10: South America AR and VR Near Eye Display Technology Revenue (million), by Types 2024 & 2032
- Figure 11: South America AR and VR Near Eye Display Technology Revenue Share (%), by Types 2024 & 2032
- Figure 12: South America AR and VR Near Eye Display Technology Revenue (million), by Country 2024 & 2032
- Figure 13: South America AR and VR Near Eye Display Technology Revenue Share (%), by Country 2024 & 2032
- Figure 14: Europe AR and VR Near Eye Display Technology Revenue (million), by Application 2024 & 2032
- Figure 15: Europe AR and VR Near Eye Display Technology Revenue Share (%), by Application 2024 & 2032
- Figure 16: Europe AR and VR Near Eye Display Technology Revenue (million), by Types 2024 & 2032
- Figure 17: Europe AR and VR Near Eye Display Technology Revenue Share (%), by Types 2024 & 2032
- Figure 18: Europe AR and VR Near Eye Display Technology Revenue (million), by Country 2024 & 2032
- Figure 19: Europe AR and VR Near Eye Display Technology Revenue Share (%), by Country 2024 & 2032
- Figure 20: Middle East & Africa AR and VR Near Eye Display Technology Revenue (million), by Application 2024 & 2032
- Figure 21: Middle East & Africa AR and VR Near Eye Display Technology Revenue Share (%), by Application 2024 & 2032
- Figure 22: Middle East & Africa AR and VR Near Eye Display Technology Revenue (million), by Types 2024 & 2032
- Figure 23: Middle East & Africa AR and VR Near Eye Display Technology Revenue Share (%), by Types 2024 & 2032
- Figure 24: Middle East & Africa AR and VR Near Eye Display Technology Revenue (million), by Country 2024 & 2032
- Figure 25: Middle East & Africa AR and VR Near Eye Display Technology Revenue Share (%), by Country 2024 & 2032
- Figure 26: Asia Pacific AR and VR Near Eye Display Technology Revenue (million), by Application 2024 & 2032
- Figure 27: Asia Pacific AR and VR Near Eye Display Technology Revenue Share (%), by Application 2024 & 2032
- Figure 28: Asia Pacific AR and VR Near Eye Display Technology Revenue (million), by Types 2024 & 2032
- Figure 29: Asia Pacific AR and VR Near Eye Display Technology Revenue Share (%), by Types 2024 & 2032
- Figure 30: Asia Pacific AR and VR Near Eye Display Technology Revenue (million), by Country 2024 & 2032
- Figure 31: Asia Pacific AR and VR Near Eye Display Technology Revenue Share (%), by Country 2024 & 2032
List of Tables
- Table 1: Global AR and VR Near Eye Display Technology Revenue million Forecast, by Region 2019 & 2032
- Table 2: Global AR and VR Near Eye Display Technology Revenue million Forecast, by Application 2019 & 2032
- Table 3: Global AR and VR Near Eye Display Technology Revenue million Forecast, by Types 2019 & 2032
- Table 4: Global AR and VR Near Eye Display Technology Revenue million Forecast, by Region 2019 & 2032
- Table 5: Global AR and VR Near Eye Display Technology Revenue million Forecast, by Application 2019 & 2032
- Table 6: Global AR and VR Near Eye Display Technology Revenue million Forecast, by Types 2019 & 2032
- Table 7: Global AR and VR Near Eye Display Technology Revenue million Forecast, by Country 2019 & 2032
- Table 8: United States AR and VR Near Eye Display Technology Revenue (million) Forecast, by Application 2019 & 2032
- Table 9: Canada AR and VR Near Eye Display Technology Revenue (million) Forecast, by Application 2019 & 2032
- Table 10: Mexico AR and VR Near Eye Display Technology Revenue (million) Forecast, by Application 2019 & 2032
- Table 11: Global AR and VR Near Eye Display Technology Revenue million Forecast, by Application 2019 & 2032
- Table 12: Global AR and VR Near Eye Display Technology Revenue million Forecast, by Types 2019 & 2032
- Table 13: Global AR and VR Near Eye Display Technology Revenue million Forecast, by Country 2019 & 2032
- Table 14: Brazil AR and VR Near Eye Display Technology Revenue (million) Forecast, by Application 2019 & 2032
- Table 15: Argentina AR and VR Near Eye Display Technology Revenue (million) Forecast, by Application 2019 & 2032
- Table 16: Rest of South America AR and VR Near Eye Display Technology Revenue (million) Forecast, by Application 2019 & 2032
- Table 17: Global AR and VR Near Eye Display Technology Revenue million Forecast, by Application 2019 & 2032
- Table 18: Global AR and VR Near Eye Display Technology Revenue million Forecast, by Types 2019 & 2032
- Table 19: Global AR and VR Near Eye Display Technology Revenue million Forecast, by Country 2019 & 2032
- Table 20: United Kingdom AR and VR Near Eye Display Technology Revenue (million) Forecast, by Application 2019 & 2032
- Table 21: Germany AR and VR Near Eye Display Technology Revenue (million) Forecast, by Application 2019 & 2032
- Table 22: France AR and VR Near Eye Display Technology Revenue (million) Forecast, by Application 2019 & 2032
- Table 23: Italy AR and VR Near Eye Display Technology Revenue (million) Forecast, by Application 2019 & 2032
- Table 24: Spain AR and VR Near Eye Display Technology Revenue (million) Forecast, by Application 2019 & 2032
- Table 25: Russia AR and VR Near Eye Display Technology Revenue (million) Forecast, by Application 2019 & 2032
- Table 26: Benelux AR and VR Near Eye Display Technology Revenue (million) Forecast, by Application 2019 & 2032
- Table 27: Nordics AR and VR Near Eye Display Technology Revenue (million) Forecast, by Application 2019 & 2032
- Table 28: Rest of Europe AR and VR Near Eye Display Technology Revenue (million) Forecast, by Application 2019 & 2032
- Table 29: Global AR and VR Near Eye Display Technology Revenue million Forecast, by Application 2019 & 2032
- Table 30: Global AR and VR Near Eye Display Technology Revenue million Forecast, by Types 2019 & 2032
- Table 31: Global AR and VR Near Eye Display Technology Revenue million Forecast, by Country 2019 & 2032
- Table 32: Turkey AR and VR Near Eye Display Technology Revenue (million) Forecast, by Application 2019 & 2032
- Table 33: Israel AR and VR Near Eye Display Technology Revenue (million) Forecast, by Application 2019 & 2032
- Table 34: GCC AR and VR Near Eye Display Technology Revenue (million) Forecast, by Application 2019 & 2032
- Table 35: North Africa AR and VR Near Eye Display Technology Revenue (million) Forecast, by Application 2019 & 2032
- Table 36: South Africa AR and VR Near Eye Display Technology Revenue (million) Forecast, by Application 2019 & 2032
- Table 37: Rest of Middle East & Africa AR and VR Near Eye Display Technology Revenue (million) Forecast, by Application 2019 & 2032
- Table 38: Global AR and VR Near Eye Display Technology Revenue million Forecast, by Application 2019 & 2032
- Table 39: Global AR and VR Near Eye Display Technology Revenue million Forecast, by Types 2019 & 2032
- Table 40: Global AR and VR Near Eye Display Technology Revenue million Forecast, by Country 2019 & 2032
- Table 41: China AR and VR Near Eye Display Technology Revenue (million) Forecast, by Application 2019 & 2032
- Table 42: India AR and VR Near Eye Display Technology Revenue (million) Forecast, by Application 2019 & 2032
- Table 43: Japan AR and VR Near Eye Display Technology Revenue (million) Forecast, by Application 2019 & 2032
- Table 44: South Korea AR and VR Near Eye Display Technology Revenue (million) Forecast, by Application 2019 & 2032
- Table 45: ASEAN AR and VR Near Eye Display Technology Revenue (million) Forecast, by Application 2019 & 2032
- Table 46: Oceania AR and VR Near Eye Display Technology Revenue (million) Forecast, by Application 2019 & 2032
- Table 47: Rest of Asia Pacific AR and VR Near Eye Display Technology Revenue (million) Forecast, by Application 2019 & 2032
Frequently Asked Questions
1. What is the projected Compound Annual Growth Rate (CAGR) of the AR and VR Near Eye Display Technology?
The projected CAGR is approximately XX%.
2. Which companies are prominent players in the AR and VR Near Eye Display Technology?
Key companies in the market include Meta, Microsoft, Sony, DPVR, Pico Interactive, Google, HTC, Pimax, Vuzix Corporation, Lenovo, Epson, MAD Gaze, Magic Leap, Nreal.
3. What are the main segments of the AR and VR Near Eye Display Technology?
The market segments include Application, Types.
4. Can you provide details about the market size?
The market size is estimated to be USD XXX million as of 2022.
5. What are some drivers contributing to market growth?
N/A
6. What are the notable trends driving market growth?
N/A
7. Are there any restraints impacting market growth?
N/A
8. Can you provide examples of recent developments in the market?
N/A
9. What pricing options are available for accessing the report?
Pricing options include single-user, multi-user, and enterprise licenses priced at USD 4900.00, USD 7350.00, and USD 9800.00 respectively.
10. Is the market size provided in terms of value or volume?
The market size is provided in terms of value, measured in million.
11. Are there any specific market keywords associated with the report?
Yes, the market keyword associated with the report is "AR and VR Near Eye Display Technology," which aids in identifying and referencing the specific market segment covered.
12. How do I determine which pricing option suits my needs best?
The pricing options vary based on user requirements and access needs. Individual users may opt for single-user licenses, while businesses requiring broader access may choose multi-user or enterprise licenses for cost-effective access to the report.
13. Are there any additional resources or data provided in the AR and VR Near Eye Display Technology report?
While the report offers comprehensive insights, it's advisable to review the specific contents or supplementary materials provided to ascertain if additional resources or data are available.
14. How can I stay updated on further developments or reports in the AR and VR Near Eye Display Technology?
To stay informed about further developments, trends, and reports in the AR and VR Near Eye Display Technology, consider subscribing to industry newsletters, following relevant companies and organizations, or regularly checking reputable industry news sources and publications.
Methodology
Step 1 - Identification of Relevant Samples Size from Population Database


Step 2 - Approaches for Defining Global Market Size (Value, Volume* & Price*)

Note*: In applicable scenarios
Step 3 - Data Sources
Primary Research
- Web Analytics
- Survey Reports
- Research Institute
- Latest Research Reports
- Opinion Leaders
Secondary Research
- Annual Reports
- White Paper
- Latest Press Release
- Industry Association
- Paid Database
- Investor Presentations

Step 4 - Data Triangulation
Involves using different sources of information in order to increase the validity of a study
These sources are likely to be stakeholders in a program - participants, other researchers, program staff, other community members, and so on.
Then we put all data in single framework & apply various statistical tools to find out the dynamic on the market.
During the analysis stage, feedback from the stakeholder groups would be compared to determine areas of agreement as well as areas of divergence


