
Key Insights
The app analytics market is experiencing robust growth, driven by the increasing adoption of mobile applications across diverse sectors and the need for businesses to understand user behavior and optimize app performance. The period from 2019 to 2024 witnessed significant expansion, laying the groundwork for continued expansion through 2033. While precise market size figures for 2019-2024 are unavailable, industry reports suggest a substantial market value in 2024, setting a strong base for future projections. Assuming a conservative Compound Annual Growth Rate (CAGR) of 15% (a figure reflecting the average growth seen in related software analytics markets) for the period from 2024 to 2033, substantial market expansion is expected. This growth is fueled by several factors, including the increasing sophistication of app analytics tools, the rising demand for data-driven decision-making, and the expansion of mobile app usage in emerging markets.
The forecast period (2025-2033) promises continued growth, driven by factors like the proliferation of mobile devices, increased competition among app developers, and the growing importance of personalized user experiences. The integration of artificial intelligence (AI) and machine learning (ML) in app analytics platforms is poised to further enhance market expansion by enabling more predictive and actionable insights. Key players are continuously innovating, offering comprehensive solutions that encompass user acquisition, retention, and monetization analytics. This competitive landscape further fuels innovation and market expansion, resulting in a more robust and feature-rich market overall. Specific segments within the market, such as attribution analytics and user engagement analysis, are anticipated to demonstrate particularly high growth rates.
App Analytics Industry Market Report: 2019-2033
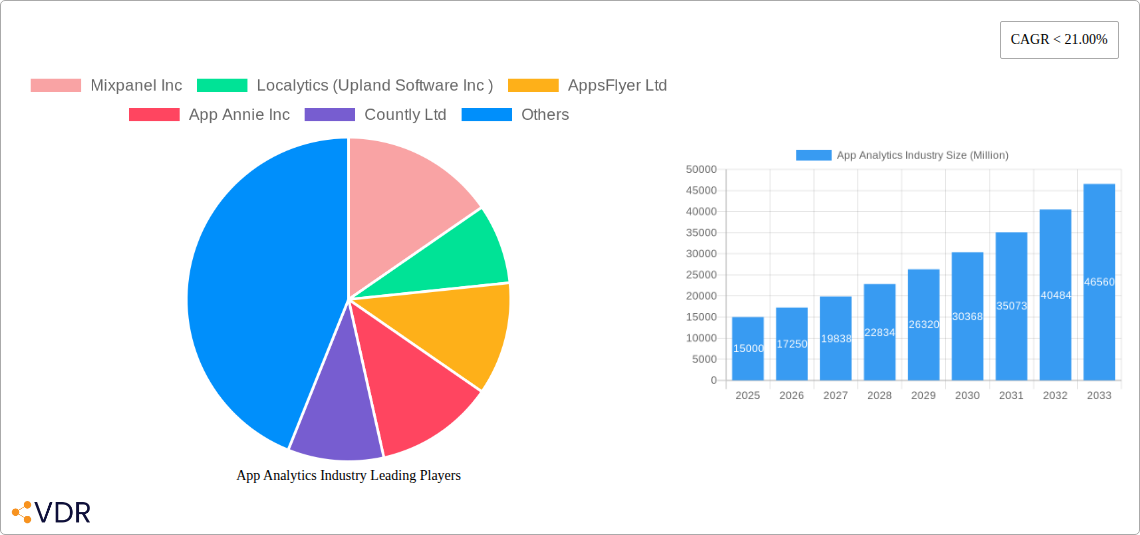
This comprehensive report provides an in-depth analysis of the App Analytics Industry, encompassing market dynamics, growth trends, regional dominance, product landscape, key players, and future outlook. The study period covers 2019-2033, with 2025 as the base and estimated year, and a forecast period of 2025-2033. The report segments the market by Type (Mobile Apps, Website/Desktop Apps), Application (Marketing/Advertising Analytics, Revenue Analytics, In-app Performance Analytics), and End-user Industry (BFSI, E-commerce, Media & Entertainment, Travel & Tourism, IT & Telecom, Other). Key players analyzed include Mixpanel Inc, Localytics (Upland Software Inc), AppsFlyer Ltd, App Annie Inc, Countly Ltd, Google LLC, Adobe Inc, Amazon Web Services Inc, AppDynamics LLC, Flurry Inc, and Kochava Inc.
App Analytics Industry Market Dynamics & Structure
The App Analytics market is characterized by moderate concentration, with several major players holding significant market share. The market size in 2025 is estimated at $xx Billion. Technological innovation, particularly in AI and machine learning for predictive analytics, is a key driver. Regulatory frameworks, like GDPR and CCPA, influence data privacy practices and compliance. Competitive substitutes include in-house analytics solutions and open-source platforms, but the specialized capabilities of dedicated app analytics platforms maintain market demand. The end-user demographic is diverse, encompassing businesses of all sizes and across various industries. M&A activity has been moderate, with a predicted xx deals in 2025, reflecting consolidation and expansion strategies within the industry.
- Market Concentration: Moderately concentrated, with top 5 players holding approximately xx% market share in 2025.
- Technological Innovation: AI, machine learning, and big data analytics are driving platform sophistication.
- Regulatory Frameworks: GDPR and CCPA influence data privacy and security considerations.
- Competitive Substitutes: In-house solutions and open-source tools pose some competition.
- M&A Activity: Approximately xx M&A deals predicted in 2025, primarily driven by consolidation and expansion.
App Analytics Industry Growth Trends & Insights
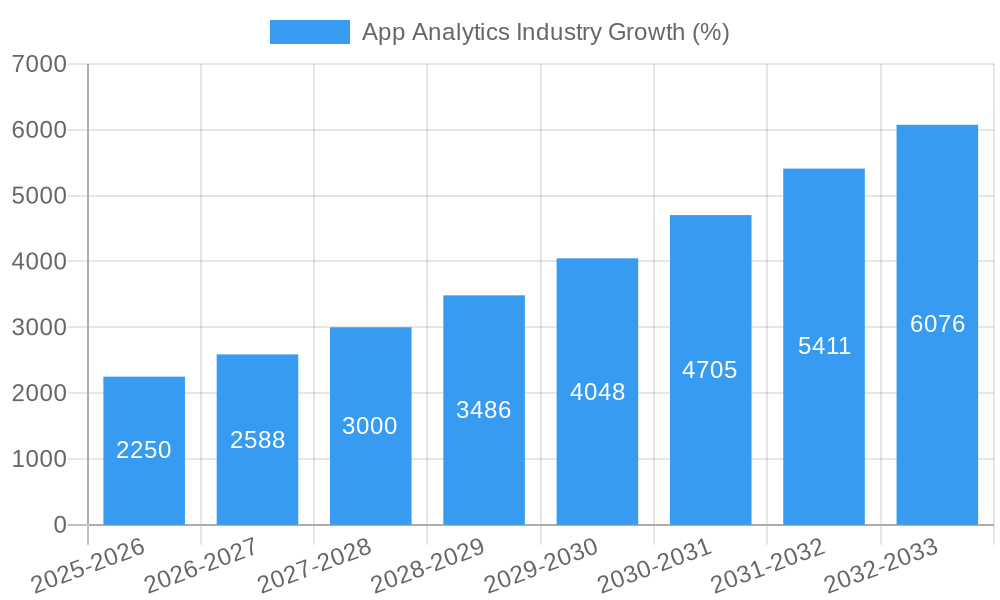
The App Analytics market has exhibited strong growth from 2019 to 2024, driven by increasing app adoption, growing demand for data-driven decision-making, and the rising need for personalized user experiences. The market size experienced a CAGR of xx% during the historical period (2019-2024) reaching $xx Billion in 2024. Technological disruptions, such as the rise of serverless computing and improved cloud infrastructure, have facilitated scalability and cost efficiency. Shifts in consumer behavior, including increased mobile usage and a demand for personalized app experiences, have further fueled market expansion. The forecast period (2025-2033) projects continued growth, driven by the expansion of mobile app usage into emerging markets and increasing adoption of advanced analytics techniques. Market penetration is expected to reach xx% by 2033. The CAGR from 2025-2033 is projected at xx%.
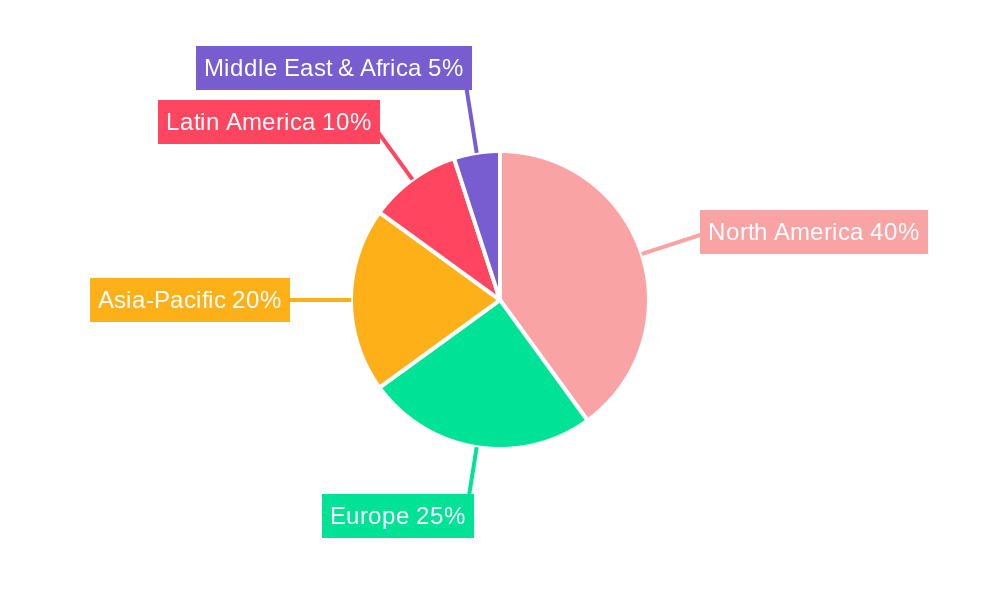
Dominant Regions, Countries, or Segments in App Analytics Industry
North America currently holds the largest market share, driven by a high concentration of technology companies, strong adoption of mobile apps, and robust regulatory frameworks promoting data-driven insights. Within application types, Marketing/Advertising Analytics is the dominant segment, with xx% of the 2025 market. In terms of end-user industries, Media and Entertainment, along with E-commerce, displays the fastest growth rate, driven by increased competition and the need for targeted advertising and customer engagement strategies. Emerging markets in Asia-Pacific are also showing significant growth potential.
- North America: Largest market share, driven by technological leadership and high app adoption rates.
- Marketing/Advertising Analytics: Dominates the application segment, with significant growth projected.
- Media & Entertainment & E-commerce: Fastest growing end-user industries, driven by the need for targeted marketing.
- Asia-Pacific: Significant growth potential due to rapid mobile app adoption and economic expansion.
App Analytics Industry Product Landscape
The app analytics market offers a wide range of products catering to different needs, from basic tracking tools to sophisticated predictive analytics platforms. Key features include real-time data dashboards, comprehensive reporting capabilities, user segmentation, cohort analysis, and advanced predictive modeling. Technological advancements, such as AI-powered anomaly detection and personalized recommendations, are improving the accuracy and actionable insights provided by these platforms. Unique selling propositions include the level of integration, customization options, and the depth of analytics provided.
Key Drivers, Barriers & Challenges in App Analytics Industry
Key Drivers: Increased mobile app usage, demand for data-driven decision-making, technological advancements in AI and machine learning, and the growing importance of personalized user experiences. Government initiatives promoting digital transformation also contribute.
Key Challenges: Data privacy and security concerns, increasing competition, the need for skilled professionals, and the complexity of integrating analytics data across multiple platforms. Supply chain disruptions can also impact the delivery of services. The cost of implementing and maintaining sophisticated analytics systems can also act as a barrier to entry for smaller companies.
Emerging Opportunities in App Analytics Industry
Untapped markets in emerging economies offer significant growth potential. The integration of app analytics with other technologies, such as IoT and AR/VR, presents innovative applications. Evolving consumer preferences, including a growing emphasis on data privacy, will drive demand for privacy-enhancing technologies within the app analytics space. Furthermore, the integration of app analytics with CRM and marketing automation platforms will continue to grow.
Growth Accelerators in the App Analytics Industry
Technological breakthroughs in AI and machine learning, the expansion of cloud-based infrastructure, strategic partnerships between analytics providers and app developers, and the expansion into new markets will accelerate growth. Effective marketing strategies highlighting the value proposition of app analytics will further promote market expansion.
Key Players Shaping the App Analytics Industry Market
- Mixpanel Inc
- Localytics (Upland Software Inc)
- AppsFlyer Ltd
- App Annie Inc
- Countly Ltd
- Google LLC
- Adobe Inc
- Amazon Web Services Inc
- AppDynamics LLC
- Flurry Inc
- Kochava Inc
Notable Milestones in App Analytics Industry Sector
- 2020: Increased focus on privacy-enhancing technologies following the implementation of GDPR and CCPA.
- 2021: Significant investments in AI and machine learning capabilities by major players.
- 2022: Launch of several new serverless analytics platforms.
- 2023: Increased adoption of predictive analytics for personalized user experiences.
- 2024: Strategic partnerships between app analytics providers and marketing automation platforms.
In-Depth App Analytics Industry Market Outlook
The App Analytics industry is poised for continued strong growth, driven by technological advancements, expanding mobile app usage, and the growing need for data-driven decision-making. Strategic opportunities include focusing on niche market segments, leveraging AI and machine learning for advanced predictive modeling, and developing privacy-enhancing technologies to meet evolving user expectations. The market is projected to reach $xx Billion by 2033, presenting lucrative opportunities for both established players and new entrants.
App Analytics Industry Segmentation
-
1. Type
- 1.1. Mobile Apps
- 1.2. Website/Desktop Apps
-
2. Application
- 2.1. Marketing/Advertising Analytics
- 2.2. Revenue Analytics
- 2.3. In-app Performance Analytics
-
3. End-user Industry
- 3.1. BFSI
- 3.2. E-commerce
- 3.3. Media an
- 3.4. Travel and Tourism
- 3.5. IT and Telecom
- 3.6. Other En
App Analytics Industry Segmentation By Geography
- 1. North America
- 2. Europe
- 3. Asia
- 4. Australia and New Zealand
- 5. Latin America
- 6. Middle East and Africa
App Analytics Industry REPORT HIGHLIGHTS
| Aspects | Details |
|---|---|
| Study Period | 2019-2033 |
| Base Year | 2024 |
| Estimated Year | 2025 |
| Forecast Period | 2025-2033 |
| Historical Period | 2019-2024 |
| Growth Rate | CAGR of < 21.00% from 2019-2033 |
| Segmentation |
|
Table of Contents
- 1. Introduction
- 1.1. Research Scope
- 1.2. Market Segmentation
- 1.3. Research Methodology
- 1.4. Definitions and Assumptions
- 2. Executive Summary
- 2.1. Introduction
- 3. Market Dynamics
- 3.1. Introduction
- 3.2. Market Drivers
- 3.2.1. ; Increasing Usage of Mobile/Web Apps Across Various End-user Industries; Increasing Adoption of Technologies like 5G Technology and Deeper Penetration of Smartphones; Increase in the Amount of Time Spent on Mobile Devices Coupled With the Increasing Focus on Enhancing Customer Experience
- 3.3. Market Restrains
- 3.3.1. ; Privacy and Security Concerns regarding the Data Saftey and Application
- 3.4. Market Trends
- 3.4.1. Media and Entertainment Industry Expected to Capture Significant Share
- 4. Market Factor Analysis
- 4.1. Porters Five Forces
- 4.2. Supply/Value Chain
- 4.3. PESTEL analysis
- 4.4. Market Entropy
- 4.5. Patent/Trademark Analysis
- 5. Global App Analytics Industry Analysis, Insights and Forecast, 2019-2031
- 5.1. Market Analysis, Insights and Forecast - by Type
- 5.1.1. Mobile Apps
- 5.1.2. Website/Desktop Apps
- 5.2. Market Analysis, Insights and Forecast - by Application
- 5.2.1. Marketing/Advertising Analytics
- 5.2.2. Revenue Analytics
- 5.2.3. In-app Performance Analytics
- 5.3. Market Analysis, Insights and Forecast - by End-user Industry
- 5.3.1. BFSI
- 5.3.2. E-commerce
- 5.3.3. Media an
- 5.3.4. Travel and Tourism
- 5.3.5. IT and Telecom
- 5.3.6. Other En
- 5.4. Market Analysis, Insights and Forecast - by Region
- 5.4.1. North America
- 5.4.2. Europe
- 5.4.3. Asia
- 5.4.4. Australia and New Zealand
- 5.4.5. Latin America
- 5.4.6. Middle East and Africa
- 5.1. Market Analysis, Insights and Forecast - by Type
- 6. North America App Analytics Industry Analysis, Insights and Forecast, 2019-2031
- 6.1. Market Analysis, Insights and Forecast - by Type
- 6.1.1. Mobile Apps
- 6.1.2. Website/Desktop Apps
- 6.2. Market Analysis, Insights and Forecast - by Application
- 6.2.1. Marketing/Advertising Analytics
- 6.2.2. Revenue Analytics
- 6.2.3. In-app Performance Analytics
- 6.3. Market Analysis, Insights and Forecast - by End-user Industry
- 6.3.1. BFSI
- 6.3.2. E-commerce
- 6.3.3. Media an
- 6.3.4. Travel and Tourism
- 6.3.5. IT and Telecom
- 6.3.6. Other En
- 6.1. Market Analysis, Insights and Forecast - by Type
- 7. Europe App Analytics Industry Analysis, Insights and Forecast, 2019-2031
- 7.1. Market Analysis, Insights and Forecast - by Type
- 7.1.1. Mobile Apps
- 7.1.2. Website/Desktop Apps
- 7.2. Market Analysis, Insights and Forecast - by Application
- 7.2.1. Marketing/Advertising Analytics
- 7.2.2. Revenue Analytics
- 7.2.3. In-app Performance Analytics
- 7.3. Market Analysis, Insights and Forecast - by End-user Industry
- 7.3.1. BFSI
- 7.3.2. E-commerce
- 7.3.3. Media an
- 7.3.4. Travel and Tourism
- 7.3.5. IT and Telecom
- 7.3.6. Other En
- 7.1. Market Analysis, Insights and Forecast - by Type
- 8. Asia App Analytics Industry Analysis, Insights and Forecast, 2019-2031
- 8.1. Market Analysis, Insights and Forecast - by Type
- 8.1.1. Mobile Apps
- 8.1.2. Website/Desktop Apps
- 8.2. Market Analysis, Insights and Forecast - by Application
- 8.2.1. Marketing/Advertising Analytics
- 8.2.2. Revenue Analytics
- 8.2.3. In-app Performance Analytics
- 8.3. Market Analysis, Insights and Forecast - by End-user Industry
- 8.3.1. BFSI
- 8.3.2. E-commerce
- 8.3.3. Media an
- 8.3.4. Travel and Tourism
- 8.3.5. IT and Telecom
- 8.3.6. Other En
- 8.1. Market Analysis, Insights and Forecast - by Type
- 9. Australia and New Zealand App Analytics Industry Analysis, Insights and Forecast, 2019-2031
- 9.1. Market Analysis, Insights and Forecast - by Type
- 9.1.1. Mobile Apps
- 9.1.2. Website/Desktop Apps
- 9.2. Market Analysis, Insights and Forecast - by Application
- 9.2.1. Marketing/Advertising Analytics
- 9.2.2. Revenue Analytics
- 9.2.3. In-app Performance Analytics
- 9.3. Market Analysis, Insights and Forecast - by End-user Industry
- 9.3.1. BFSI
- 9.3.2. E-commerce
- 9.3.3. Media an
- 9.3.4. Travel and Tourism
- 9.3.5. IT and Telecom
- 9.3.6. Other En
- 9.1. Market Analysis, Insights and Forecast - by Type
- 10. Latin America App Analytics Industry Analysis, Insights and Forecast, 2019-2031
- 10.1. Market Analysis, Insights and Forecast - by Type
- 10.1.1. Mobile Apps
- 10.1.2. Website/Desktop Apps
- 10.2. Market Analysis, Insights and Forecast - by Application
- 10.2.1. Marketing/Advertising Analytics
- 10.2.2. Revenue Analytics
- 10.2.3. In-app Performance Analytics
- 10.3. Market Analysis, Insights and Forecast - by End-user Industry
- 10.3.1. BFSI
- 10.3.2. E-commerce
- 10.3.3. Media an
- 10.3.4. Travel and Tourism
- 10.3.5. IT and Telecom
- 10.3.6. Other En
- 10.1. Market Analysis, Insights and Forecast - by Type
- 11. Middle East and Africa App Analytics Industry Analysis, Insights and Forecast, 2019-2031
- 11.1. Market Analysis, Insights and Forecast - by Type
- 11.1.1. Mobile Apps
- 11.1.2. Website/Desktop Apps
- 11.2. Market Analysis, Insights and Forecast - by Application
- 11.2.1. Marketing/Advertising Analytics
- 11.2.2. Revenue Analytics
- 11.2.3. In-app Performance Analytics
- 11.3. Market Analysis, Insights and Forecast - by End-user Industry
- 11.3.1. BFSI
- 11.3.2. E-commerce
- 11.3.3. Media an
- 11.3.4. Travel and Tourism
- 11.3.5. IT and Telecom
- 11.3.6. Other En
- 11.1. Market Analysis, Insights and Forecast - by Type
- 12. North America App Analytics Industry Analysis, Insights and Forecast, 2019-2031
- 12.1. Market Analysis, Insights and Forecast - By Country/Sub-region
- 12.1.1 United States
- 12.1.2 Canada
- 12.1.3 Mexico
- 13. Europe App Analytics Industry Analysis, Insights and Forecast, 2019-2031
- 13.1. Market Analysis, Insights and Forecast - By Country/Sub-region
- 13.1.1 Germany
- 13.1.2 United Kingdom
- 13.1.3 France
- 13.1.4 Spain
- 13.1.5 Italy
- 13.1.6 Spain
- 13.1.7 Belgium
- 13.1.8 Netherland
- 13.1.9 Nordics
- 13.1.10 Rest of Europe
- 14. Asia Pacific App Analytics Industry Analysis, Insights and Forecast, 2019-2031
- 14.1. Market Analysis, Insights and Forecast - By Country/Sub-region
- 14.1.1 China
- 14.1.2 Japan
- 14.1.3 India
- 14.1.4 South Korea
- 14.1.5 Southeast Asia
- 14.1.6 Australia
- 14.1.7 Indonesia
- 14.1.8 Phillipes
- 14.1.9 Singapore
- 14.1.10 Thailandc
- 14.1.11 Rest of Asia Pacific
- 15. South America App Analytics Industry Analysis, Insights and Forecast, 2019-2031
- 15.1. Market Analysis, Insights and Forecast - By Country/Sub-region
- 15.1.1 Brazil
- 15.1.2 Argentina
- 15.1.3 Peru
- 15.1.4 Chile
- 15.1.5 Colombia
- 15.1.6 Ecuador
- 15.1.7 Venezuela
- 15.1.8 Rest of South America
- 16. North America App Analytics Industry Analysis, Insights and Forecast, 2019-2031
- 16.1. Market Analysis, Insights and Forecast - By Country/Sub-region
- 16.1.1 United States
- 16.1.2 Canada
- 16.1.3 Mexico
- 17. MEA App Analytics Industry Analysis, Insights and Forecast, 2019-2031
- 17.1. Market Analysis, Insights and Forecast - By Country/Sub-region
- 17.1.1 United Arab Emirates
- 17.1.2 Saudi Arabia
- 17.1.3 South Africa
- 17.1.4 Rest of Middle East and Africa
- 18. Competitive Analysis
- 18.1. Global Market Share Analysis 2024
- 18.2. Company Profiles
- 18.2.1 Mixpanel Inc
- 18.2.1.1. Overview
- 18.2.1.2. Products
- 18.2.1.3. SWOT Analysis
- 18.2.1.4. Recent Developments
- 18.2.1.5. Financials (Based on Availability)
- 18.2.2 Localytics (Upland Software Inc )
- 18.2.2.1. Overview
- 18.2.2.2. Products
- 18.2.2.3. SWOT Analysis
- 18.2.2.4. Recent Developments
- 18.2.2.5. Financials (Based on Availability)
- 18.2.3 AppsFlyer Ltd
- 18.2.3.1. Overview
- 18.2.3.2. Products
- 18.2.3.3. SWOT Analysis
- 18.2.3.4. Recent Developments
- 18.2.3.5. Financials (Based on Availability)
- 18.2.4 App Annie Inc
- 18.2.4.1. Overview
- 18.2.4.2. Products
- 18.2.4.3. SWOT Analysis
- 18.2.4.4. Recent Developments
- 18.2.4.5. Financials (Based on Availability)
- 18.2.5 Countly Ltd
- 18.2.5.1. Overview
- 18.2.5.2. Products
- 18.2.5.3. SWOT Analysis
- 18.2.5.4. Recent Developments
- 18.2.5.5. Financials (Based on Availability)
- 18.2.6 Google LLC
- 18.2.6.1. Overview
- 18.2.6.2. Products
- 18.2.6.3. SWOT Analysis
- 18.2.6.4. Recent Developments
- 18.2.6.5. Financials (Based on Availability)
- 18.2.7 Adobe Inc
- 18.2.7.1. Overview
- 18.2.7.2. Products
- 18.2.7.3. SWOT Analysis
- 18.2.7.4. Recent Developments
- 18.2.7.5. Financials (Based on Availability)
- 18.2.8 Amazon Web Services Inc
- 18.2.8.1. Overview
- 18.2.8.2. Products
- 18.2.8.3. SWOT Analysis
- 18.2.8.4. Recent Developments
- 18.2.8.5. Financials (Based on Availability)
- 18.2.9 AppDynamics LLC
- 18.2.9.1. Overview
- 18.2.9.2. Products
- 18.2.9.3. SWOT Analysis
- 18.2.9.4. Recent Developments
- 18.2.9.5. Financials (Based on Availability)
- 18.2.10 Flurry Inc
- 18.2.10.1. Overview
- 18.2.10.2. Products
- 18.2.10.3. SWOT Analysis
- 18.2.10.4. Recent Developments
- 18.2.10.5. Financials (Based on Availability)
- 18.2.11 Kochava Inc
- 18.2.11.1. Overview
- 18.2.11.2. Products
- 18.2.11.3. SWOT Analysis
- 18.2.11.4. Recent Developments
- 18.2.11.5. Financials (Based on Availability)
- 18.2.1 Mixpanel Inc
List of Figures
- Figure 1: Global App Analytics Industry Revenue Breakdown (Million, %) by Region 2024 & 2032
- Figure 2: North America App Analytics Industry Revenue (Million), by Country 2024 & 2032
- Figure 3: North America App Analytics Industry Revenue Share (%), by Country 2024 & 2032
- Figure 4: Europe App Analytics Industry Revenue (Million), by Country 2024 & 2032
- Figure 5: Europe App Analytics Industry Revenue Share (%), by Country 2024 & 2032
- Figure 6: Asia Pacific App Analytics Industry Revenue (Million), by Country 2024 & 2032
- Figure 7: Asia Pacific App Analytics Industry Revenue Share (%), by Country 2024 & 2032
- Figure 8: South America App Analytics Industry Revenue (Million), by Country 2024 & 2032
- Figure 9: South America App Analytics Industry Revenue Share (%), by Country 2024 & 2032
- Figure 10: North America App Analytics Industry Revenue (Million), by Country 2024 & 2032
- Figure 11: North America App Analytics Industry Revenue Share (%), by Country 2024 & 2032
- Figure 12: MEA App Analytics Industry Revenue (Million), by Country 2024 & 2032
- Figure 13: MEA App Analytics Industry Revenue Share (%), by Country 2024 & 2032
- Figure 14: North America App Analytics Industry Revenue (Million), by Type 2024 & 2032
- Figure 15: North America App Analytics Industry Revenue Share (%), by Type 2024 & 2032
- Figure 16: North America App Analytics Industry Revenue (Million), by Application 2024 & 2032
- Figure 17: North America App Analytics Industry Revenue Share (%), by Application 2024 & 2032
- Figure 18: North America App Analytics Industry Revenue (Million), by End-user Industry 2024 & 2032
- Figure 19: North America App Analytics Industry Revenue Share (%), by End-user Industry 2024 & 2032
- Figure 20: North America App Analytics Industry Revenue (Million), by Country 2024 & 2032
- Figure 21: North America App Analytics Industry Revenue Share (%), by Country 2024 & 2032
- Figure 22: Europe App Analytics Industry Revenue (Million), by Type 2024 & 2032
- Figure 23: Europe App Analytics Industry Revenue Share (%), by Type 2024 & 2032
- Figure 24: Europe App Analytics Industry Revenue (Million), by Application 2024 & 2032
- Figure 25: Europe App Analytics Industry Revenue Share (%), by Application 2024 & 2032
- Figure 26: Europe App Analytics Industry Revenue (Million), by End-user Industry 2024 & 2032
- Figure 27: Europe App Analytics Industry Revenue Share (%), by End-user Industry 2024 & 2032
- Figure 28: Europe App Analytics Industry Revenue (Million), by Country 2024 & 2032
- Figure 29: Europe App Analytics Industry Revenue Share (%), by Country 2024 & 2032
- Figure 30: Asia App Analytics Industry Revenue (Million), by Type 2024 & 2032
- Figure 31: Asia App Analytics Industry Revenue Share (%), by Type 2024 & 2032
- Figure 32: Asia App Analytics Industry Revenue (Million), by Application 2024 & 2032
- Figure 33: Asia App Analytics Industry Revenue Share (%), by Application 2024 & 2032
- Figure 34: Asia App Analytics Industry Revenue (Million), by End-user Industry 2024 & 2032
- Figure 35: Asia App Analytics Industry Revenue Share (%), by End-user Industry 2024 & 2032
- Figure 36: Asia App Analytics Industry Revenue (Million), by Country 2024 & 2032
- Figure 37: Asia App Analytics Industry Revenue Share (%), by Country 2024 & 2032
- Figure 38: Australia and New Zealand App Analytics Industry Revenue (Million), by Type 2024 & 2032
- Figure 39: Australia and New Zealand App Analytics Industry Revenue Share (%), by Type 2024 & 2032
- Figure 40: Australia and New Zealand App Analytics Industry Revenue (Million), by Application 2024 & 2032
- Figure 41: Australia and New Zealand App Analytics Industry Revenue Share (%), by Application 2024 & 2032
- Figure 42: Australia and New Zealand App Analytics Industry Revenue (Million), by End-user Industry 2024 & 2032
- Figure 43: Australia and New Zealand App Analytics Industry Revenue Share (%), by End-user Industry 2024 & 2032
- Figure 44: Australia and New Zealand App Analytics Industry Revenue (Million), by Country 2024 & 2032
- Figure 45: Australia and New Zealand App Analytics Industry Revenue Share (%), by Country 2024 & 2032
- Figure 46: Latin America App Analytics Industry Revenue (Million), by Type 2024 & 2032
- Figure 47: Latin America App Analytics Industry Revenue Share (%), by Type 2024 & 2032
- Figure 48: Latin America App Analytics Industry Revenue (Million), by Application 2024 & 2032
- Figure 49: Latin America App Analytics Industry Revenue Share (%), by Application 2024 & 2032
- Figure 50: Latin America App Analytics Industry Revenue (Million), by End-user Industry 2024 & 2032
- Figure 51: Latin America App Analytics Industry Revenue Share (%), by End-user Industry 2024 & 2032
- Figure 52: Latin America App Analytics Industry Revenue (Million), by Country 2024 & 2032
- Figure 53: Latin America App Analytics Industry Revenue Share (%), by Country 2024 & 2032
- Figure 54: Middle East and Africa App Analytics Industry Revenue (Million), by Type 2024 & 2032
- Figure 55: Middle East and Africa App Analytics Industry Revenue Share (%), by Type 2024 & 2032
- Figure 56: Middle East and Africa App Analytics Industry Revenue (Million), by Application 2024 & 2032
- Figure 57: Middle East and Africa App Analytics Industry Revenue Share (%), by Application 2024 & 2032
- Figure 58: Middle East and Africa App Analytics Industry Revenue (Million), by End-user Industry 2024 & 2032
- Figure 59: Middle East and Africa App Analytics Industry Revenue Share (%), by End-user Industry 2024 & 2032
- Figure 60: Middle East and Africa App Analytics Industry Revenue (Million), by Country 2024 & 2032
- Figure 61: Middle East and Africa App Analytics Industry Revenue Share (%), by Country 2024 & 2032
List of Tables
- Table 1: Global App Analytics Industry Revenue Million Forecast, by Region 2019 & 2032
- Table 2: Global App Analytics Industry Revenue Million Forecast, by Type 2019 & 2032
- Table 3: Global App Analytics Industry Revenue Million Forecast, by Application 2019 & 2032
- Table 4: Global App Analytics Industry Revenue Million Forecast, by End-user Industry 2019 & 2032
- Table 5: Global App Analytics Industry Revenue Million Forecast, by Region 2019 & 2032
- Table 6: Global App Analytics Industry Revenue Million Forecast, by Country 2019 & 2032
- Table 7: United States App Analytics Industry Revenue (Million) Forecast, by Application 2019 & 2032
- Table 8: Canada App Analytics Industry Revenue (Million) Forecast, by Application 2019 & 2032
- Table 9: Mexico App Analytics Industry Revenue (Million) Forecast, by Application 2019 & 2032
- Table 10: Global App Analytics Industry Revenue Million Forecast, by Country 2019 & 2032
- Table 11: Germany App Analytics Industry Revenue (Million) Forecast, by Application 2019 & 2032
- Table 12: United Kingdom App Analytics Industry Revenue (Million) Forecast, by Application 2019 & 2032
- Table 13: France App Analytics Industry Revenue (Million) Forecast, by Application 2019 & 2032
- Table 14: Spain App Analytics Industry Revenue (Million) Forecast, by Application 2019 & 2032
- Table 15: Italy App Analytics Industry Revenue (Million) Forecast, by Application 2019 & 2032
- Table 16: Spain App Analytics Industry Revenue (Million) Forecast, by Application 2019 & 2032
- Table 17: Belgium App Analytics Industry Revenue (Million) Forecast, by Application 2019 & 2032
- Table 18: Netherland App Analytics Industry Revenue (Million) Forecast, by Application 2019 & 2032
- Table 19: Nordics App Analytics Industry Revenue (Million) Forecast, by Application 2019 & 2032
- Table 20: Rest of Europe App Analytics Industry Revenue (Million) Forecast, by Application 2019 & 2032
- Table 21: Global App Analytics Industry Revenue Million Forecast, by Country 2019 & 2032
- Table 22: China App Analytics Industry Revenue (Million) Forecast, by Application 2019 & 2032
- Table 23: Japan App Analytics Industry Revenue (Million) Forecast, by Application 2019 & 2032
- Table 24: India App Analytics Industry Revenue (Million) Forecast, by Application 2019 & 2032
- Table 25: South Korea App Analytics Industry Revenue (Million) Forecast, by Application 2019 & 2032
- Table 26: Southeast Asia App Analytics Industry Revenue (Million) Forecast, by Application 2019 & 2032
- Table 27: Australia App Analytics Industry Revenue (Million) Forecast, by Application 2019 & 2032
- Table 28: Indonesia App Analytics Industry Revenue (Million) Forecast, by Application 2019 & 2032
- Table 29: Phillipes App Analytics Industry Revenue (Million) Forecast, by Application 2019 & 2032
- Table 30: Singapore App Analytics Industry Revenue (Million) Forecast, by Application 2019 & 2032
- Table 31: Thailandc App Analytics Industry Revenue (Million) Forecast, by Application 2019 & 2032
- Table 32: Rest of Asia Pacific App Analytics Industry Revenue (Million) Forecast, by Application 2019 & 2032
- Table 33: Global App Analytics Industry Revenue Million Forecast, by Country 2019 & 2032
- Table 34: Brazil App Analytics Industry Revenue (Million) Forecast, by Application 2019 & 2032
- Table 35: Argentina App Analytics Industry Revenue (Million) Forecast, by Application 2019 & 2032
- Table 36: Peru App Analytics Industry Revenue (Million) Forecast, by Application 2019 & 2032
- Table 37: Chile App Analytics Industry Revenue (Million) Forecast, by Application 2019 & 2032
- Table 38: Colombia App Analytics Industry Revenue (Million) Forecast, by Application 2019 & 2032
- Table 39: Ecuador App Analytics Industry Revenue (Million) Forecast, by Application 2019 & 2032
- Table 40: Venezuela App Analytics Industry Revenue (Million) Forecast, by Application 2019 & 2032
- Table 41: Rest of South America App Analytics Industry Revenue (Million) Forecast, by Application 2019 & 2032
- Table 42: Global App Analytics Industry Revenue Million Forecast, by Country 2019 & 2032
- Table 43: United States App Analytics Industry Revenue (Million) Forecast, by Application 2019 & 2032
- Table 44: Canada App Analytics Industry Revenue (Million) Forecast, by Application 2019 & 2032
- Table 45: Mexico App Analytics Industry Revenue (Million) Forecast, by Application 2019 & 2032
- Table 46: Global App Analytics Industry Revenue Million Forecast, by Country 2019 & 2032
- Table 47: United Arab Emirates App Analytics Industry Revenue (Million) Forecast, by Application 2019 & 2032
- Table 48: Saudi Arabia App Analytics Industry Revenue (Million) Forecast, by Application 2019 & 2032
- Table 49: South Africa App Analytics Industry Revenue (Million) Forecast, by Application 2019 & 2032
- Table 50: Rest of Middle East and Africa App Analytics Industry Revenue (Million) Forecast, by Application 2019 & 2032
- Table 51: Global App Analytics Industry Revenue Million Forecast, by Type 2019 & 2032
- Table 52: Global App Analytics Industry Revenue Million Forecast, by Application 2019 & 2032
- Table 53: Global App Analytics Industry Revenue Million Forecast, by End-user Industry 2019 & 2032
- Table 54: Global App Analytics Industry Revenue Million Forecast, by Country 2019 & 2032
- Table 55: Global App Analytics Industry Revenue Million Forecast, by Type 2019 & 2032
- Table 56: Global App Analytics Industry Revenue Million Forecast, by Application 2019 & 2032
- Table 57: Global App Analytics Industry Revenue Million Forecast, by End-user Industry 2019 & 2032
- Table 58: Global App Analytics Industry Revenue Million Forecast, by Country 2019 & 2032
- Table 59: Global App Analytics Industry Revenue Million Forecast, by Type 2019 & 2032
- Table 60: Global App Analytics Industry Revenue Million Forecast, by Application 2019 & 2032
- Table 61: Global App Analytics Industry Revenue Million Forecast, by End-user Industry 2019 & 2032
- Table 62: Global App Analytics Industry Revenue Million Forecast, by Country 2019 & 2032
- Table 63: Global App Analytics Industry Revenue Million Forecast, by Type 2019 & 2032
- Table 64: Global App Analytics Industry Revenue Million Forecast, by Application 2019 & 2032
- Table 65: Global App Analytics Industry Revenue Million Forecast, by End-user Industry 2019 & 2032
- Table 66: Global App Analytics Industry Revenue Million Forecast, by Country 2019 & 2032
- Table 67: Global App Analytics Industry Revenue Million Forecast, by Type 2019 & 2032
- Table 68: Global App Analytics Industry Revenue Million Forecast, by Application 2019 & 2032
- Table 69: Global App Analytics Industry Revenue Million Forecast, by End-user Industry 2019 & 2032
- Table 70: Global App Analytics Industry Revenue Million Forecast, by Country 2019 & 2032
- Table 71: Global App Analytics Industry Revenue Million Forecast, by Type 2019 & 2032
- Table 72: Global App Analytics Industry Revenue Million Forecast, by Application 2019 & 2032
- Table 73: Global App Analytics Industry Revenue Million Forecast, by End-user Industry 2019 & 2032
- Table 74: Global App Analytics Industry Revenue Million Forecast, by Country 2019 & 2032
Frequently Asked Questions
1. What is the projected Compound Annual Growth Rate (CAGR) of the App Analytics Industry?
The projected CAGR is approximately < 21.00%.
2. Which companies are prominent players in the App Analytics Industry?
Key companies in the market include Mixpanel Inc, Localytics (Upland Software Inc ), AppsFlyer Ltd, App Annie Inc, Countly Ltd, Google LLC, Adobe Inc, Amazon Web Services Inc, AppDynamics LLC, Flurry Inc, Kochava Inc.
3. What are the main segments of the App Analytics Industry?
The market segments include Type, Application, End-user Industry.
4. Can you provide details about the market size?
The market size is estimated to be USD XX Million as of 2022.
5. What are some drivers contributing to market growth?
; Increasing Usage of Mobile/Web Apps Across Various End-user Industries; Increasing Adoption of Technologies like 5G Technology and Deeper Penetration of Smartphones; Increase in the Amount of Time Spent on Mobile Devices Coupled With the Increasing Focus on Enhancing Customer Experience.
6. What are the notable trends driving market growth?
Media and Entertainment Industry Expected to Capture Significant Share.
7. Are there any restraints impacting market growth?
; Privacy and Security Concerns regarding the Data Saftey and Application.
8. Can you provide examples of recent developments in the market?
N/A
9. What pricing options are available for accessing the report?
Pricing options include single-user, multi-user, and enterprise licenses priced at USD 4750, USD 5250, and USD 8750 respectively.
10. Is the market size provided in terms of value or volume?
The market size is provided in terms of value, measured in Million.
11. Are there any specific market keywords associated with the report?
Yes, the market keyword associated with the report is "App Analytics Industry," which aids in identifying and referencing the specific market segment covered.
12. How do I determine which pricing option suits my needs best?
The pricing options vary based on user requirements and access needs. Individual users may opt for single-user licenses, while businesses requiring broader access may choose multi-user or enterprise licenses for cost-effective access to the report.
13. Are there any additional resources or data provided in the App Analytics Industry report?
While the report offers comprehensive insights, it's advisable to review the specific contents or supplementary materials provided to ascertain if additional resources or data are available.
14. How can I stay updated on further developments or reports in the App Analytics Industry?
To stay informed about further developments, trends, and reports in the App Analytics Industry, consider subscribing to industry newsletters, following relevant companies and organizations, or regularly checking reputable industry news sources and publications.
Methodology
Step 1 - Identification of Relevant Samples Size from Population Database


Step 2 - Approaches for Defining Global Market Size (Value, Volume* & Price*)

Note*: In applicable scenarios
Step 3 - Data Sources
Primary Research
- Web Analytics
- Survey Reports
- Research Institute
- Latest Research Reports
- Opinion Leaders
Secondary Research
- Annual Reports
- White Paper
- Latest Press Release
- Industry Association
- Paid Database
- Investor Presentations

Step 4 - Data Triangulation
Involves using different sources of information in order to increase the validity of a study
These sources are likely to be stakeholders in a program - participants, other researchers, program staff, other community members, and so on.
Then we put all data in single framework & apply various statistical tools to find out the dynamic on the market.
During the analysis stage, feedback from the stakeholder groups would be compared to determine areas of agreement as well as areas of divergence


