
Key Insights
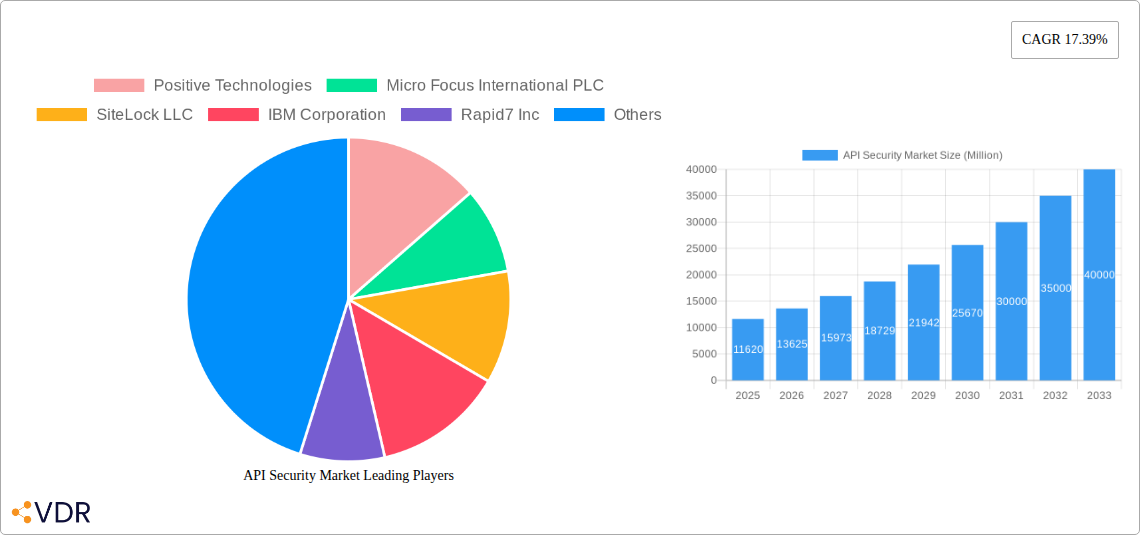
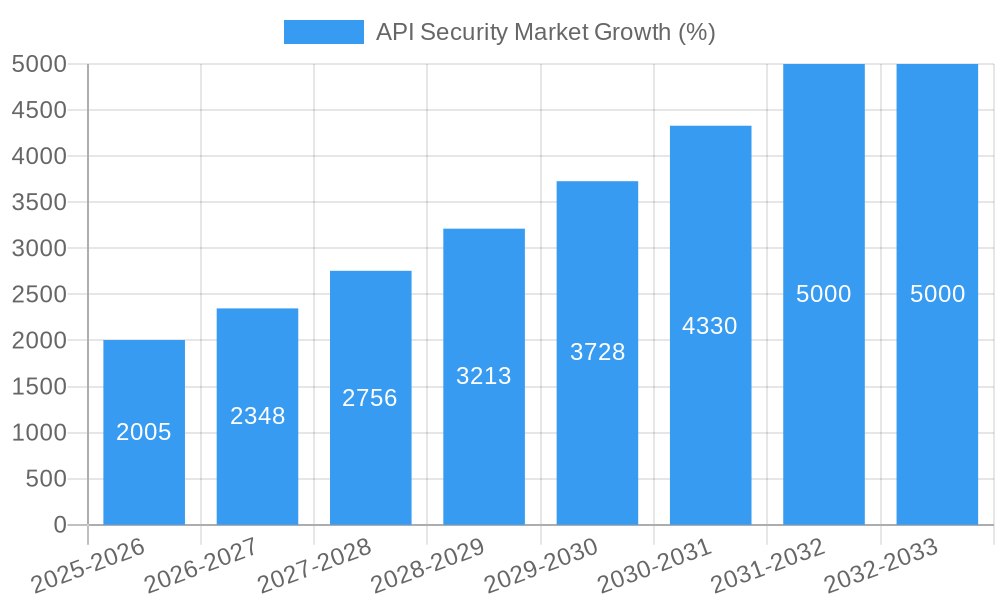
The API security market is experiencing robust growth, projected to reach \$11.62 billion in 2025 and exhibiting a Compound Annual Growth Rate (CAGR) of 17.39% from 2025 to 2033. This expansion is fueled by the increasing reliance on Application Programming Interfaces (APIs) across diverse industries and the escalating number of API-related security breaches. The rising adoption of cloud-native architectures, microservices, and digital transformation initiatives significantly contributes to this market growth. Key drivers include the need to protect sensitive data transmitted through APIs, comply with stringent regulatory frameworks like GDPR and CCPA, and prevent costly data breaches and reputational damage. The market segmentation reveals strong demand across various deployment models (cloud-based solutions are likely leading), organization sizes (large enterprises are significant consumers due to their extensive API infrastructure), and testing types (a combination of SAST, DAST, IAST, and RASP solutions are employed for comprehensive security). The healthcare, BFSI, and retail sectors are major adopters, reflecting their high reliance on API-driven applications and the sensitive nature of their data. While the market faces some restraints, such as the complexity of API security implementation and the skills gap in security professionals, the overall growth trajectory remains positive. The competitive landscape is characterized by a blend of established players and innovative startups, each offering a range of solutions to address the diverse security needs of organizations.
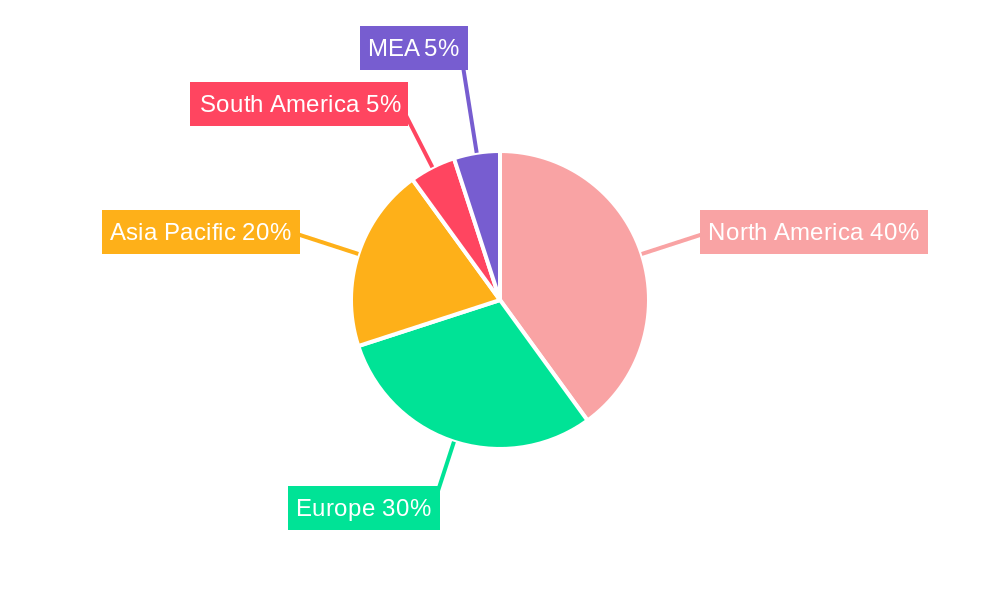
The continued growth of the API security market is predicted to be driven by several factors including the increasing sophistication of cyberattacks targeting APIs, the expansion of the Internet of Things (IoT) and its reliance on APIs, and the growing adoption of DevOps and CI/CD methodologies, which necessitate robust API security measures. Geographic distribution suggests North America currently holds a substantial market share, followed by Europe and Asia Pacific, although the latter regions are projected to experience faster growth due to rising digital adoption and increasing government regulations. The market's maturity is reflected in the diverse range of solutions available, from static and dynamic application security testing to runtime application self-protection. As organizations strive for a more holistic security posture, integrated security solutions and managed services are likely to gain traction, streamlining the implementation and management of API security measures.
API Security Market: A Comprehensive Report (2019-2033)
This comprehensive report provides an in-depth analysis of the API Security market, encompassing market dynamics, growth trends, regional dominance, product landscape, key players, and future outlook. The study period spans from 2019 to 2033, with 2025 serving as the base and estimated year. The report caters to industry professionals, investors, and strategic decision-makers seeking a thorough understanding of this rapidly evolving market segment. The total market size is projected to reach xx Million by 2033.
API Security Market Market Dynamics & Structure
The API security market is experiencing robust growth driven by the increasing reliance on APIs across various industries and the escalating threat landscape. Market concentration is moderate, with several major players holding significant shares, but a fragmented landscape also exists, particularly amongst niche providers. Technological innovation, including AI/ML integration for advanced threat detection, is a primary driver. Regulatory frameworks like GDPR and CCPA are influencing adoption, while the emergence of cloud-native security solutions is reshaping the competitive landscape.
- Market Concentration: Moderately concentrated, with top 5 players holding approximately 40% market share in 2024.
- Technological Innovation: AI/ML, serverless security, and zero trust architecture are key drivers.
- Regulatory Landscape: GDPR, CCPA, and other regional regulations are fostering adoption.
- M&A Activity: Significant M&A activity, with xx deals recorded between 2019 and 2024, indicating market consolidation. (e.g., Qualys acquisition of Blue Hexagon, Synopsys acquisition of WhiteHat Security).
- Competitive Substitutes: Traditional security solutions are being replaced by more specialized API security offerings.
- End-User Demographics: Large enterprises dominate the market currently, but SMEs are showing increasing adoption.
API Security Market Growth Trends & Insights
The API security market is experiencing substantial growth, projected to achieve a CAGR of xx% during the forecast period (2025-2033). Market size evolution reflects the increasing adoption of APIs and the heightened awareness of associated security risks. Technological disruptions, particularly the rise of cloud-native and serverless architectures, are significantly influencing adoption rates. Consumer behavior is shifting towards proactive security measures rather than reactive incident response. The increasing adoption of cloud-based applications and the growing interconnectedness of systems continue to fuel market expansion. Market penetration is expected to increase from xx% in 2024 to xx% by 2033.
Dominant Regions, Countries, or Segments in API Security Market
North America currently holds the largest market share, driven by robust technological advancements and high adoption rates amongst large enterprises. Within segments, the Large Enterprises segment exhibits the highest growth potential due to their significant investments in security infrastructure. Amongst security testing types, DAST (Dynamic Application Security Testing) and IAST (Interactive Application Security Testing) hold the largest market shares due to their effectiveness in identifying runtime vulnerabilities. The BFSI (Banking, Financial Services, and Insurance) and Healthcare sectors are major contributors due to stringent regulatory requirements and the sensitivity of their data.
- Leading Region: North America (xx Million in 2025)
- Fastest Growing Region: Asia-Pacific (xx% CAGR)
- Dominant Segment (Organization Size): Large Enterprises (xx% market share in 2025)
- Dominant Segment (Security Testing): DAST and IAST (xx% combined market share in 2025)
- Dominant End-user Industry: BFSI (xx% market share in 2025)
API Security Market Product Landscape
The API security product landscape is characterized by a range of solutions, including Static Application Security Testing (SAST), Dynamic Application Security Testing (DAST), Interactive Application Security Testing (IAST), and Runtime Application Self-Protection (RASP). These solutions leverage various technologies, such as AI/ML and behavioral analysis, to enhance detection capabilities. Key differentiators include the level of automation, integration capabilities, and breadth of coverage across different API types and deployment models. Continuous improvements in accuracy and speed are key areas of innovation.
Key Drivers, Barriers & Challenges in API Security Market
Key Drivers: The increasing adoption of cloud-native applications, microservices architectures, and the rise of API-driven businesses are driving market growth. Furthermore, stringent data privacy regulations and heightened awareness of API security vulnerabilities are encouraging investment in robust security solutions.
Key Challenges: The complexity of modern APIs, the shortage of skilled security professionals, and the high cost of implementation can hinder broader adoption. The evolving threat landscape, with new attack vectors constantly emerging, also presents significant challenges. Integration complexities with existing security infrastructures can be costly. Supply chain vulnerabilities linked to third-party API providers poses another threat.
Emerging Opportunities in API Security Market
The market presents significant opportunities in serverless security, zero trust architectures, and the integration of AI/ML for predictive threat detection. The increasing adoption of IoT devices and the expansion of edge computing create new avenues for specialized API security solutions. Focus areas include improved API discovery, automated remediation, and comprehensive security testing methodologies for complex API ecosystems.
Growth Accelerators in the API Security Market Industry
Strategic partnerships between API security vendors and cloud providers, coupled with technological advancements in AI/ML and automation, are key growth catalysts. Expanding into emerging markets, particularly in Asia-Pacific, presents significant opportunities for growth. The development of standardized API security best practices and frameworks can further accelerate market expansion. Investment in research and development to address new vulnerabilities and evolving attack vectors is crucial.
Key Players Shaping the API Security Market Market
- Positive Technologies
- Micro Focus International PLC
- SiteLock LLC
- IBM Corporation
- Rapid7 Inc
- Fasoo com Inc
- Contrast Security
- Checkmarx Ltd
- Oracle Corporation
- Synopsys Inc
- Qualys Inc
- Veracode (Thoma Bravo)
- WhiteHat Security Inc ( NTT Security Corporation)
Notable Milestones in API Security Market Sector
- June 2022: Synopsys, Inc. acquired WhiteHat Security, strengthening its application security testing portfolio.
- October 2022: Qualys, Inc. acquired Blue Hexagon's assets, integrating AI/ML into its Cloud Platform for enhanced threat detection.
In-Depth API Security Market Market Outlook
The API security market is poised for continued strong growth, driven by the increasing adoption of APIs across diverse industries and the escalating need for robust security measures. Strategic investments in advanced technologies, such as AI/ML and automation, will be crucial for vendors to maintain a competitive edge. The focus on proactive security measures and the integration of API security into broader security strategies will define the future landscape. The market offers lucrative opportunities for companies specializing in serverless security, zero trust architecture, and advanced threat intelligence.
API Security Market Segmentation
-
1. Application
- 1.1. Web Application Security
- 1.2. Mobile Application Security
-
2. Component
-
2.1. Service
- 2.1.1. Managed
- 2.1.2. Professional
-
2.2. Deployment (Solution)
- 2.2.1. Cloud
- 2.2.2. On-premise
-
2.1. Service
-
3. Organization Size
- 3.1. Small and Medium Enterprises
- 3.2. Large Enterprises
-
4. Types of Security Testing
- 4.1. Static Application Security Testing (SAST)
- 4.2. Dynamic Application Security Testing (DAST)
- 4.3. Interactive Application Security Testing (IAST)
- 4.4. Run-Time Application Self Protection (RASP)
-
5. End-user Industry
- 5.1. Healthcare
- 5.2. BFSI
- 5.3. Education
- 5.4. Retail
- 5.5. Government
- 5.6. Other End-user Verticals
API Security Market Segmentation By Geography
- 1. North America
- 2. Europe
- 3. Asia Pacific
- 4. Latin America
- 5. Middle East
API Security Market REPORT HIGHLIGHTS
| Aspects | Details |
|---|---|
| Study Period | 2019-2033 |
| Base Year | 2024 |
| Estimated Year | 2025 |
| Forecast Period | 2025-2033 |
| Historical Period | 2019-2024 |
| Growth Rate | CAGR of 17.39% from 2019-2033 |
| Segmentation |
|
Table of Contents
- 1. Introduction
- 1.1. Research Scope
- 1.2. Market Segmentation
- 1.3. Research Methodology
- 1.4. Definitions and Assumptions
- 2. Executive Summary
- 2.1. Introduction
- 3. Market Dynamics
- 3.1. Introduction
- 3.2. Market Drivers
- 3.2.1. Favorable Government Regulations; Increased Number of Sophisticated Attacks; Increased Number of Third-party Applications
- 3.3. Market Restrains
- 3.3.1. Budget Constraints and Unused Applications Restrict Companies from Adoption; Negligence of Application Security by Industries
- 3.4. Market Trends
- 3.4.1 Increased Number of Third-party Applications
- 3.4.2 such as E-commerce
- 4. Market Factor Analysis
- 4.1. Porters Five Forces
- 4.2. Supply/Value Chain
- 4.3. PESTEL analysis
- 4.4. Market Entropy
- 4.5. Patent/Trademark Analysis
- 5. Global API Security Market Analysis, Insights and Forecast, 2019-2031
- 5.1. Market Analysis, Insights and Forecast - by Application
- 5.1.1. Web Application Security
- 5.1.2. Mobile Application Security
- 5.2. Market Analysis, Insights and Forecast - by Component
- 5.2.1. Service
- 5.2.1.1. Managed
- 5.2.1.2. Professional
- 5.2.2. Deployment (Solution)
- 5.2.2.1. Cloud
- 5.2.2.2. On-premise
- 5.2.1. Service
- 5.3. Market Analysis, Insights and Forecast - by Organization Size
- 5.3.1. Small and Medium Enterprises
- 5.3.2. Large Enterprises
- 5.4. Market Analysis, Insights and Forecast - by Types of Security Testing
- 5.4.1. Static Application Security Testing (SAST)
- 5.4.2. Dynamic Application Security Testing (DAST)
- 5.4.3. Interactive Application Security Testing (IAST)
- 5.4.4. Run-Time Application Self Protection (RASP)
- 5.5. Market Analysis, Insights and Forecast - by End-user Industry
- 5.5.1. Healthcare
- 5.5.2. BFSI
- 5.5.3. Education
- 5.5.4. Retail
- 5.5.5. Government
- 5.5.6. Other End-user Verticals
- 5.6. Market Analysis, Insights and Forecast - by Region
- 5.6.1. North America
- 5.6.2. Europe
- 5.6.3. Asia Pacific
- 5.6.4. Latin America
- 5.6.5. Middle East
- 5.1. Market Analysis, Insights and Forecast - by Application
- 6. North America API Security Market Analysis, Insights and Forecast, 2019-2031
- 6.1. Market Analysis, Insights and Forecast - by Application
- 6.1.1. Web Application Security
- 6.1.2. Mobile Application Security
- 6.2. Market Analysis, Insights and Forecast - by Component
- 6.2.1. Service
- 6.2.1.1. Managed
- 6.2.1.2. Professional
- 6.2.2. Deployment (Solution)
- 6.2.2.1. Cloud
- 6.2.2.2. On-premise
- 6.2.1. Service
- 6.3. Market Analysis, Insights and Forecast - by Organization Size
- 6.3.1. Small and Medium Enterprises
- 6.3.2. Large Enterprises
- 6.4. Market Analysis, Insights and Forecast - by Types of Security Testing
- 6.4.1. Static Application Security Testing (SAST)
- 6.4.2. Dynamic Application Security Testing (DAST)
- 6.4.3. Interactive Application Security Testing (IAST)
- 6.4.4. Run-Time Application Self Protection (RASP)
- 6.5. Market Analysis, Insights and Forecast - by End-user Industry
- 6.5.1. Healthcare
- 6.5.2. BFSI
- 6.5.3. Education
- 6.5.4. Retail
- 6.5.5. Government
- 6.5.6. Other End-user Verticals
- 6.1. Market Analysis, Insights and Forecast - by Application
- 7. Europe API Security Market Analysis, Insights and Forecast, 2019-2031
- 7.1. Market Analysis, Insights and Forecast - by Application
- 7.1.1. Web Application Security
- 7.1.2. Mobile Application Security
- 7.2. Market Analysis, Insights and Forecast - by Component
- 7.2.1. Service
- 7.2.1.1. Managed
- 7.2.1.2. Professional
- 7.2.2. Deployment (Solution)
- 7.2.2.1. Cloud
- 7.2.2.2. On-premise
- 7.2.1. Service
- 7.3. Market Analysis, Insights and Forecast - by Organization Size
- 7.3.1. Small and Medium Enterprises
- 7.3.2. Large Enterprises
- 7.4. Market Analysis, Insights and Forecast - by Types of Security Testing
- 7.4.1. Static Application Security Testing (SAST)
- 7.4.2. Dynamic Application Security Testing (DAST)
- 7.4.3. Interactive Application Security Testing (IAST)
- 7.4.4. Run-Time Application Self Protection (RASP)
- 7.5. Market Analysis, Insights and Forecast - by End-user Industry
- 7.5.1. Healthcare
- 7.5.2. BFSI
- 7.5.3. Education
- 7.5.4. Retail
- 7.5.5. Government
- 7.5.6. Other End-user Verticals
- 7.1. Market Analysis, Insights and Forecast - by Application
- 8. Asia Pacific API Security Market Analysis, Insights and Forecast, 2019-2031
- 8.1. Market Analysis, Insights and Forecast - by Application
- 8.1.1. Web Application Security
- 8.1.2. Mobile Application Security
- 8.2. Market Analysis, Insights and Forecast - by Component
- 8.2.1. Service
- 8.2.1.1. Managed
- 8.2.1.2. Professional
- 8.2.2. Deployment (Solution)
- 8.2.2.1. Cloud
- 8.2.2.2. On-premise
- 8.2.1. Service
- 8.3. Market Analysis, Insights and Forecast - by Organization Size
- 8.3.1. Small and Medium Enterprises
- 8.3.2. Large Enterprises
- 8.4. Market Analysis, Insights and Forecast - by Types of Security Testing
- 8.4.1. Static Application Security Testing (SAST)
- 8.4.2. Dynamic Application Security Testing (DAST)
- 8.4.3. Interactive Application Security Testing (IAST)
- 8.4.4. Run-Time Application Self Protection (RASP)
- 8.5. Market Analysis, Insights and Forecast - by End-user Industry
- 8.5.1. Healthcare
- 8.5.2. BFSI
- 8.5.3. Education
- 8.5.4. Retail
- 8.5.5. Government
- 8.5.6. Other End-user Verticals
- 8.1. Market Analysis, Insights and Forecast - by Application
- 9. Latin America API Security Market Analysis, Insights and Forecast, 2019-2031
- 9.1. Market Analysis, Insights and Forecast - by Application
- 9.1.1. Web Application Security
- 9.1.2. Mobile Application Security
- 9.2. Market Analysis, Insights and Forecast - by Component
- 9.2.1. Service
- 9.2.1.1. Managed
- 9.2.1.2. Professional
- 9.2.2. Deployment (Solution)
- 9.2.2.1. Cloud
- 9.2.2.2. On-premise
- 9.2.1. Service
- 9.3. Market Analysis, Insights and Forecast - by Organization Size
- 9.3.1. Small and Medium Enterprises
- 9.3.2. Large Enterprises
- 9.4. Market Analysis, Insights and Forecast - by Types of Security Testing
- 9.4.1. Static Application Security Testing (SAST)
- 9.4.2. Dynamic Application Security Testing (DAST)
- 9.4.3. Interactive Application Security Testing (IAST)
- 9.4.4. Run-Time Application Self Protection (RASP)
- 9.5. Market Analysis, Insights and Forecast - by End-user Industry
- 9.5.1. Healthcare
- 9.5.2. BFSI
- 9.5.3. Education
- 9.5.4. Retail
- 9.5.5. Government
- 9.5.6. Other End-user Verticals
- 9.1. Market Analysis, Insights and Forecast - by Application
- 10. Middle East API Security Market Analysis, Insights and Forecast, 2019-2031
- 10.1. Market Analysis, Insights and Forecast - by Application
- 10.1.1. Web Application Security
- 10.1.2. Mobile Application Security
- 10.2. Market Analysis, Insights and Forecast - by Component
- 10.2.1. Service
- 10.2.1.1. Managed
- 10.2.1.2. Professional
- 10.2.2. Deployment (Solution)
- 10.2.2.1. Cloud
- 10.2.2.2. On-premise
- 10.2.1. Service
- 10.3. Market Analysis, Insights and Forecast - by Organization Size
- 10.3.1. Small and Medium Enterprises
- 10.3.2. Large Enterprises
- 10.4. Market Analysis, Insights and Forecast - by Types of Security Testing
- 10.4.1. Static Application Security Testing (SAST)
- 10.4.2. Dynamic Application Security Testing (DAST)
- 10.4.3. Interactive Application Security Testing (IAST)
- 10.4.4. Run-Time Application Self Protection (RASP)
- 10.5. Market Analysis, Insights and Forecast - by End-user Industry
- 10.5.1. Healthcare
- 10.5.2. BFSI
- 10.5.3. Education
- 10.5.4. Retail
- 10.5.5. Government
- 10.5.6. Other End-user Verticals
- 10.1. Market Analysis, Insights and Forecast - by Application
- 11. North America API Security Market Analysis, Insights and Forecast, 2019-2031
- 11.1. Market Analysis, Insights and Forecast - By Country/Sub-region
- 11.1.1 United States
- 11.1.2 Canada
- 11.1.3 Mexico
- 12. Europe API Security Market Analysis, Insights and Forecast, 2019-2031
- 12.1. Market Analysis, Insights and Forecast - By Country/Sub-region
- 12.1.1 Germany
- 12.1.2 United Kingdom
- 12.1.3 France
- 12.1.4 Spain
- 12.1.5 Italy
- 12.1.6 Spain
- 12.1.7 Belgium
- 12.1.8 Netherland
- 12.1.9 Nordics
- 12.1.10 Rest of Europe
- 13. Asia Pacific API Security Market Analysis, Insights and Forecast, 2019-2031
- 13.1. Market Analysis, Insights and Forecast - By Country/Sub-region
- 13.1.1 China
- 13.1.2 Japan
- 13.1.3 India
- 13.1.4 South Korea
- 13.1.5 Southeast Asia
- 13.1.6 Australia
- 13.1.7 Indonesia
- 13.1.8 Phillipes
- 13.1.9 Singapore
- 13.1.10 Thailandc
- 13.1.11 Rest of Asia Pacific
- 14. South America API Security Market Analysis, Insights and Forecast, 2019-2031
- 14.1. Market Analysis, Insights and Forecast - By Country/Sub-region
- 14.1.1 Brazil
- 14.1.2 Argentina
- 14.1.3 Peru
- 14.1.4 Chile
- 14.1.5 Colombia
- 14.1.6 Ecuador
- 14.1.7 Venezuela
- 14.1.8 Rest of South America
- 15. North America API Security Market Analysis, Insights and Forecast, 2019-2031
- 15.1. Market Analysis, Insights and Forecast - By Country/Sub-region
- 15.1.1 United States
- 15.1.2 Canada
- 15.1.3 Mexico
- 16. MEA API Security Market Analysis, Insights and Forecast, 2019-2031
- 16.1. Market Analysis, Insights and Forecast - By Country/Sub-region
- 16.1.1 United Arab Emirates
- 16.1.2 Saudi Arabia
- 16.1.3 South Africa
- 16.1.4 Rest of Middle East and Africa
- 17. Competitive Analysis
- 17.1. Global Market Share Analysis 2024
- 17.2. Company Profiles
- 17.2.1 Positive Technologies
- 17.2.1.1. Overview
- 17.2.1.2. Products
- 17.2.1.3. SWOT Analysis
- 17.2.1.4. Recent Developments
- 17.2.1.5. Financials (Based on Availability)
- 17.2.2 Micro Focus International PLC
- 17.2.2.1. Overview
- 17.2.2.2. Products
- 17.2.2.3. SWOT Analysis
- 17.2.2.4. Recent Developments
- 17.2.2.5. Financials (Based on Availability)
- 17.2.3 SiteLock LLC
- 17.2.3.1. Overview
- 17.2.3.2. Products
- 17.2.3.3. SWOT Analysis
- 17.2.3.4. Recent Developments
- 17.2.3.5. Financials (Based on Availability)
- 17.2.4 IBM Corporation
- 17.2.4.1. Overview
- 17.2.4.2. Products
- 17.2.4.3. SWOT Analysis
- 17.2.4.4. Recent Developments
- 17.2.4.5. Financials (Based on Availability)
- 17.2.5 Rapid7 Inc
- 17.2.5.1. Overview
- 17.2.5.2. Products
- 17.2.5.3. SWOT Analysis
- 17.2.5.4. Recent Developments
- 17.2.5.5. Financials (Based on Availability)
- 17.2.6 Fasoo com Inc *List Not Exhaustive
- 17.2.6.1. Overview
- 17.2.6.2. Products
- 17.2.6.3. SWOT Analysis
- 17.2.6.4. Recent Developments
- 17.2.6.5. Financials (Based on Availability)
- 17.2.7 Contrast Security
- 17.2.7.1. Overview
- 17.2.7.2. Products
- 17.2.7.3. SWOT Analysis
- 17.2.7.4. Recent Developments
- 17.2.7.5. Financials (Based on Availability)
- 17.2.8 Checkmarx Ltd
- 17.2.8.1. Overview
- 17.2.8.2. Products
- 17.2.8.3. SWOT Analysis
- 17.2.8.4. Recent Developments
- 17.2.8.5. Financials (Based on Availability)
- 17.2.9 Oracle Corporation
- 17.2.9.1. Overview
- 17.2.9.2. Products
- 17.2.9.3. SWOT Analysis
- 17.2.9.4. Recent Developments
- 17.2.9.5. Financials (Based on Availability)
- 17.2.10 Synopsys Inc
- 17.2.10.1. Overview
- 17.2.10.2. Products
- 17.2.10.3. SWOT Analysis
- 17.2.10.4. Recent Developments
- 17.2.10.5. Financials (Based on Availability)
- 17.2.11 Qualys Inc
- 17.2.11.1. Overview
- 17.2.11.2. Products
- 17.2.11.3. SWOT Analysis
- 17.2.11.4. Recent Developments
- 17.2.11.5. Financials (Based on Availability)
- 17.2.12 Veracode (Thoma Bravo)
- 17.2.12.1. Overview
- 17.2.12.2. Products
- 17.2.12.3. SWOT Analysis
- 17.2.12.4. Recent Developments
- 17.2.12.5. Financials (Based on Availability)
- 17.2.13 WhiteHat Security Inc ( NTT Security Corporation)
- 17.2.13.1. Overview
- 17.2.13.2. Products
- 17.2.13.3. SWOT Analysis
- 17.2.13.4. Recent Developments
- 17.2.13.5. Financials (Based on Availability)
- 17.2.1 Positive Technologies
List of Figures
- Figure 1: Global API Security Market Revenue Breakdown (Million, %) by Region 2024 & 2032
- Figure 2: North America API Security Market Revenue (Million), by Country 2024 & 2032
- Figure 3: North America API Security Market Revenue Share (%), by Country 2024 & 2032
- Figure 4: Europe API Security Market Revenue (Million), by Country 2024 & 2032
- Figure 5: Europe API Security Market Revenue Share (%), by Country 2024 & 2032
- Figure 6: Asia Pacific API Security Market Revenue (Million), by Country 2024 & 2032
- Figure 7: Asia Pacific API Security Market Revenue Share (%), by Country 2024 & 2032
- Figure 8: South America API Security Market Revenue (Million), by Country 2024 & 2032
- Figure 9: South America API Security Market Revenue Share (%), by Country 2024 & 2032
- Figure 10: North America API Security Market Revenue (Million), by Country 2024 & 2032
- Figure 11: North America API Security Market Revenue Share (%), by Country 2024 & 2032
- Figure 12: MEA API Security Market Revenue (Million), by Country 2024 & 2032
- Figure 13: MEA API Security Market Revenue Share (%), by Country 2024 & 2032
- Figure 14: North America API Security Market Revenue (Million), by Application 2024 & 2032
- Figure 15: North America API Security Market Revenue Share (%), by Application 2024 & 2032
- Figure 16: North America API Security Market Revenue (Million), by Component 2024 & 2032
- Figure 17: North America API Security Market Revenue Share (%), by Component 2024 & 2032
- Figure 18: North America API Security Market Revenue (Million), by Organization Size 2024 & 2032
- Figure 19: North America API Security Market Revenue Share (%), by Organization Size 2024 & 2032
- Figure 20: North America API Security Market Revenue (Million), by Types of Security Testing 2024 & 2032
- Figure 21: North America API Security Market Revenue Share (%), by Types of Security Testing 2024 & 2032
- Figure 22: North America API Security Market Revenue (Million), by End-user Industry 2024 & 2032
- Figure 23: North America API Security Market Revenue Share (%), by End-user Industry 2024 & 2032
- Figure 24: North America API Security Market Revenue (Million), by Country 2024 & 2032
- Figure 25: North America API Security Market Revenue Share (%), by Country 2024 & 2032
- Figure 26: Europe API Security Market Revenue (Million), by Application 2024 & 2032
- Figure 27: Europe API Security Market Revenue Share (%), by Application 2024 & 2032
- Figure 28: Europe API Security Market Revenue (Million), by Component 2024 & 2032
- Figure 29: Europe API Security Market Revenue Share (%), by Component 2024 & 2032
- Figure 30: Europe API Security Market Revenue (Million), by Organization Size 2024 & 2032
- Figure 31: Europe API Security Market Revenue Share (%), by Organization Size 2024 & 2032
- Figure 32: Europe API Security Market Revenue (Million), by Types of Security Testing 2024 & 2032
- Figure 33: Europe API Security Market Revenue Share (%), by Types of Security Testing 2024 & 2032
- Figure 34: Europe API Security Market Revenue (Million), by End-user Industry 2024 & 2032
- Figure 35: Europe API Security Market Revenue Share (%), by End-user Industry 2024 & 2032
- Figure 36: Europe API Security Market Revenue (Million), by Country 2024 & 2032
- Figure 37: Europe API Security Market Revenue Share (%), by Country 2024 & 2032
- Figure 38: Asia Pacific API Security Market Revenue (Million), by Application 2024 & 2032
- Figure 39: Asia Pacific API Security Market Revenue Share (%), by Application 2024 & 2032
- Figure 40: Asia Pacific API Security Market Revenue (Million), by Component 2024 & 2032
- Figure 41: Asia Pacific API Security Market Revenue Share (%), by Component 2024 & 2032
- Figure 42: Asia Pacific API Security Market Revenue (Million), by Organization Size 2024 & 2032
- Figure 43: Asia Pacific API Security Market Revenue Share (%), by Organization Size 2024 & 2032
- Figure 44: Asia Pacific API Security Market Revenue (Million), by Types of Security Testing 2024 & 2032
- Figure 45: Asia Pacific API Security Market Revenue Share (%), by Types of Security Testing 2024 & 2032
- Figure 46: Asia Pacific API Security Market Revenue (Million), by End-user Industry 2024 & 2032
- Figure 47: Asia Pacific API Security Market Revenue Share (%), by End-user Industry 2024 & 2032
- Figure 48: Asia Pacific API Security Market Revenue (Million), by Country 2024 & 2032
- Figure 49: Asia Pacific API Security Market Revenue Share (%), by Country 2024 & 2032
- Figure 50: Latin America API Security Market Revenue (Million), by Application 2024 & 2032
- Figure 51: Latin America API Security Market Revenue Share (%), by Application 2024 & 2032
- Figure 52: Latin America API Security Market Revenue (Million), by Component 2024 & 2032
- Figure 53: Latin America API Security Market Revenue Share (%), by Component 2024 & 2032
- Figure 54: Latin America API Security Market Revenue (Million), by Organization Size 2024 & 2032
- Figure 55: Latin America API Security Market Revenue Share (%), by Organization Size 2024 & 2032
- Figure 56: Latin America API Security Market Revenue (Million), by Types of Security Testing 2024 & 2032
- Figure 57: Latin America API Security Market Revenue Share (%), by Types of Security Testing 2024 & 2032
- Figure 58: Latin America API Security Market Revenue (Million), by End-user Industry 2024 & 2032
- Figure 59: Latin America API Security Market Revenue Share (%), by End-user Industry 2024 & 2032
- Figure 60: Latin America API Security Market Revenue (Million), by Country 2024 & 2032
- Figure 61: Latin America API Security Market Revenue Share (%), by Country 2024 & 2032
- Figure 62: Middle East API Security Market Revenue (Million), by Application 2024 & 2032
- Figure 63: Middle East API Security Market Revenue Share (%), by Application 2024 & 2032
- Figure 64: Middle East API Security Market Revenue (Million), by Component 2024 & 2032
- Figure 65: Middle East API Security Market Revenue Share (%), by Component 2024 & 2032
- Figure 66: Middle East API Security Market Revenue (Million), by Organization Size 2024 & 2032
- Figure 67: Middle East API Security Market Revenue Share (%), by Organization Size 2024 & 2032
- Figure 68: Middle East API Security Market Revenue (Million), by Types of Security Testing 2024 & 2032
- Figure 69: Middle East API Security Market Revenue Share (%), by Types of Security Testing 2024 & 2032
- Figure 70: Middle East API Security Market Revenue (Million), by End-user Industry 2024 & 2032
- Figure 71: Middle East API Security Market Revenue Share (%), by End-user Industry 2024 & 2032
- Figure 72: Middle East API Security Market Revenue (Million), by Country 2024 & 2032
- Figure 73: Middle East API Security Market Revenue Share (%), by Country 2024 & 2032
List of Tables
- Table 1: Global API Security Market Revenue Million Forecast, by Region 2019 & 2032
- Table 2: Global API Security Market Revenue Million Forecast, by Application 2019 & 2032
- Table 3: Global API Security Market Revenue Million Forecast, by Component 2019 & 2032
- Table 4: Global API Security Market Revenue Million Forecast, by Organization Size 2019 & 2032
- Table 5: Global API Security Market Revenue Million Forecast, by Types of Security Testing 2019 & 2032
- Table 6: Global API Security Market Revenue Million Forecast, by End-user Industry 2019 & 2032
- Table 7: Global API Security Market Revenue Million Forecast, by Region 2019 & 2032
- Table 8: Global API Security Market Revenue Million Forecast, by Country 2019 & 2032
- Table 9: United States API Security Market Revenue (Million) Forecast, by Application 2019 & 2032
- Table 10: Canada API Security Market Revenue (Million) Forecast, by Application 2019 & 2032
- Table 11: Mexico API Security Market Revenue (Million) Forecast, by Application 2019 & 2032
- Table 12: Global API Security Market Revenue Million Forecast, by Country 2019 & 2032
- Table 13: Germany API Security Market Revenue (Million) Forecast, by Application 2019 & 2032
- Table 14: United Kingdom API Security Market Revenue (Million) Forecast, by Application 2019 & 2032
- Table 15: France API Security Market Revenue (Million) Forecast, by Application 2019 & 2032
- Table 16: Spain API Security Market Revenue (Million) Forecast, by Application 2019 & 2032
- Table 17: Italy API Security Market Revenue (Million) Forecast, by Application 2019 & 2032
- Table 18: Spain API Security Market Revenue (Million) Forecast, by Application 2019 & 2032
- Table 19: Belgium API Security Market Revenue (Million) Forecast, by Application 2019 & 2032
- Table 20: Netherland API Security Market Revenue (Million) Forecast, by Application 2019 & 2032
- Table 21: Nordics API Security Market Revenue (Million) Forecast, by Application 2019 & 2032
- Table 22: Rest of Europe API Security Market Revenue (Million) Forecast, by Application 2019 & 2032
- Table 23: Global API Security Market Revenue Million Forecast, by Country 2019 & 2032
- Table 24: China API Security Market Revenue (Million) Forecast, by Application 2019 & 2032
- Table 25: Japan API Security Market Revenue (Million) Forecast, by Application 2019 & 2032
- Table 26: India API Security Market Revenue (Million) Forecast, by Application 2019 & 2032
- Table 27: South Korea API Security Market Revenue (Million) Forecast, by Application 2019 & 2032
- Table 28: Southeast Asia API Security Market Revenue (Million) Forecast, by Application 2019 & 2032
- Table 29: Australia API Security Market Revenue (Million) Forecast, by Application 2019 & 2032
- Table 30: Indonesia API Security Market Revenue (Million) Forecast, by Application 2019 & 2032
- Table 31: Phillipes API Security Market Revenue (Million) Forecast, by Application 2019 & 2032
- Table 32: Singapore API Security Market Revenue (Million) Forecast, by Application 2019 & 2032
- Table 33: Thailandc API Security Market Revenue (Million) Forecast, by Application 2019 & 2032
- Table 34: Rest of Asia Pacific API Security Market Revenue (Million) Forecast, by Application 2019 & 2032
- Table 35: Global API Security Market Revenue Million Forecast, by Country 2019 & 2032
- Table 36: Brazil API Security Market Revenue (Million) Forecast, by Application 2019 & 2032
- Table 37: Argentina API Security Market Revenue (Million) Forecast, by Application 2019 & 2032
- Table 38: Peru API Security Market Revenue (Million) Forecast, by Application 2019 & 2032
- Table 39: Chile API Security Market Revenue (Million) Forecast, by Application 2019 & 2032
- Table 40: Colombia API Security Market Revenue (Million) Forecast, by Application 2019 & 2032
- Table 41: Ecuador API Security Market Revenue (Million) Forecast, by Application 2019 & 2032
- Table 42: Venezuela API Security Market Revenue (Million) Forecast, by Application 2019 & 2032
- Table 43: Rest of South America API Security Market Revenue (Million) Forecast, by Application 2019 & 2032
- Table 44: Global API Security Market Revenue Million Forecast, by Country 2019 & 2032
- Table 45: United States API Security Market Revenue (Million) Forecast, by Application 2019 & 2032
- Table 46: Canada API Security Market Revenue (Million) Forecast, by Application 2019 & 2032
- Table 47: Mexico API Security Market Revenue (Million) Forecast, by Application 2019 & 2032
- Table 48: Global API Security Market Revenue Million Forecast, by Country 2019 & 2032
- Table 49: United Arab Emirates API Security Market Revenue (Million) Forecast, by Application 2019 & 2032
- Table 50: Saudi Arabia API Security Market Revenue (Million) Forecast, by Application 2019 & 2032
- Table 51: South Africa API Security Market Revenue (Million) Forecast, by Application 2019 & 2032
- Table 52: Rest of Middle East and Africa API Security Market Revenue (Million) Forecast, by Application 2019 & 2032
- Table 53: Global API Security Market Revenue Million Forecast, by Application 2019 & 2032
- Table 54: Global API Security Market Revenue Million Forecast, by Component 2019 & 2032
- Table 55: Global API Security Market Revenue Million Forecast, by Organization Size 2019 & 2032
- Table 56: Global API Security Market Revenue Million Forecast, by Types of Security Testing 2019 & 2032
- Table 57: Global API Security Market Revenue Million Forecast, by End-user Industry 2019 & 2032
- Table 58: Global API Security Market Revenue Million Forecast, by Country 2019 & 2032
- Table 59: Global API Security Market Revenue Million Forecast, by Application 2019 & 2032
- Table 60: Global API Security Market Revenue Million Forecast, by Component 2019 & 2032
- Table 61: Global API Security Market Revenue Million Forecast, by Organization Size 2019 & 2032
- Table 62: Global API Security Market Revenue Million Forecast, by Types of Security Testing 2019 & 2032
- Table 63: Global API Security Market Revenue Million Forecast, by End-user Industry 2019 & 2032
- Table 64: Global API Security Market Revenue Million Forecast, by Country 2019 & 2032
- Table 65: Global API Security Market Revenue Million Forecast, by Application 2019 & 2032
- Table 66: Global API Security Market Revenue Million Forecast, by Component 2019 & 2032
- Table 67: Global API Security Market Revenue Million Forecast, by Organization Size 2019 & 2032
- Table 68: Global API Security Market Revenue Million Forecast, by Types of Security Testing 2019 & 2032
- Table 69: Global API Security Market Revenue Million Forecast, by End-user Industry 2019 & 2032
- Table 70: Global API Security Market Revenue Million Forecast, by Country 2019 & 2032
- Table 71: Global API Security Market Revenue Million Forecast, by Application 2019 & 2032
- Table 72: Global API Security Market Revenue Million Forecast, by Component 2019 & 2032
- Table 73: Global API Security Market Revenue Million Forecast, by Organization Size 2019 & 2032
- Table 74: Global API Security Market Revenue Million Forecast, by Types of Security Testing 2019 & 2032
- Table 75: Global API Security Market Revenue Million Forecast, by End-user Industry 2019 & 2032
- Table 76: Global API Security Market Revenue Million Forecast, by Country 2019 & 2032
- Table 77: Global API Security Market Revenue Million Forecast, by Application 2019 & 2032
- Table 78: Global API Security Market Revenue Million Forecast, by Component 2019 & 2032
- Table 79: Global API Security Market Revenue Million Forecast, by Organization Size 2019 & 2032
- Table 80: Global API Security Market Revenue Million Forecast, by Types of Security Testing 2019 & 2032
- Table 81: Global API Security Market Revenue Million Forecast, by End-user Industry 2019 & 2032
- Table 82: Global API Security Market Revenue Million Forecast, by Country 2019 & 2032
Frequently Asked Questions
1. What is the projected Compound Annual Growth Rate (CAGR) of the API Security Market?
The projected CAGR is approximately 17.39%.
2. Which companies are prominent players in the API Security Market?
Key companies in the market include Positive Technologies, Micro Focus International PLC, SiteLock LLC, IBM Corporation, Rapid7 Inc, Fasoo com Inc *List Not Exhaustive, Contrast Security, Checkmarx Ltd, Oracle Corporation, Synopsys Inc, Qualys Inc, Veracode (Thoma Bravo), WhiteHat Security Inc ( NTT Security Corporation).
3. What are the main segments of the API Security Market?
The market segments include Application, Component, Organization Size, Types of Security Testing, End-user Industry.
4. Can you provide details about the market size?
The market size is estimated to be USD 11.62 Million as of 2022.
5. What are some drivers contributing to market growth?
Favorable Government Regulations; Increased Number of Sophisticated Attacks; Increased Number of Third-party Applications.
6. What are the notable trends driving market growth?
Increased Number of Third-party Applications. such as E-commerce.
7. Are there any restraints impacting market growth?
Budget Constraints and Unused Applications Restrict Companies from Adoption; Negligence of Application Security by Industries.
8. Can you provide examples of recent developments in the market?
October 2022: Qualys, Inc., a disruptive cloud-based IT, security, and compliance solutions provider acquired Blue Hexagon's assets. This integrates AI/machine learning (AI/ML) into the Qualys Cloud Platform, enabling businesses to translate petabytes of fully integrated data into valuable insights. This acquisition will allow Qualys to leverage its robust Cloud Platform and its more than 10 trillion data points to find behavioral patterns such as enhanced network threat identification, active vulnerability exploitation, and adaptable risk mitigation across all assets and apps. This dynamic blend of fully integrated security data and machine learning technologies will provide Qualys customers with predictive and automatic cyber security risk mitigation.
9. What pricing options are available for accessing the report?
Pricing options include single-user, multi-user, and enterprise licenses priced at USD 4750, USD 5250, and USD 8750 respectively.
10. Is the market size provided in terms of value or volume?
The market size is provided in terms of value, measured in Million.
11. Are there any specific market keywords associated with the report?
Yes, the market keyword associated with the report is "API Security Market," which aids in identifying and referencing the specific market segment covered.
12. How do I determine which pricing option suits my needs best?
The pricing options vary based on user requirements and access needs. Individual users may opt for single-user licenses, while businesses requiring broader access may choose multi-user or enterprise licenses for cost-effective access to the report.
13. Are there any additional resources or data provided in the API Security Market report?
While the report offers comprehensive insights, it's advisable to review the specific contents or supplementary materials provided to ascertain if additional resources or data are available.
14. How can I stay updated on further developments or reports in the API Security Market?
To stay informed about further developments, trends, and reports in the API Security Market, consider subscribing to industry newsletters, following relevant companies and organizations, or regularly checking reputable industry news sources and publications.
Methodology
Step 1 - Identification of Relevant Samples Size from Population Database


Step 2 - Approaches for Defining Global Market Size (Value, Volume* & Price*)

Note*: In applicable scenarios
Step 3 - Data Sources
Primary Research
- Web Analytics
- Survey Reports
- Research Institute
- Latest Research Reports
- Opinion Leaders
Secondary Research
- Annual Reports
- White Paper
- Latest Press Release
- Industry Association
- Paid Database
- Investor Presentations

Step 4 - Data Triangulation
Involves using different sources of information in order to increase the validity of a study
These sources are likely to be stakeholders in a program - participants, other researchers, program staff, other community members, and so on.
Then we put all data in single framework & apply various statistical tools to find out the dynamic on the market.
During the analysis stage, feedback from the stakeholder groups would be compared to determine areas of agreement as well as areas of divergence


