
Key Insights
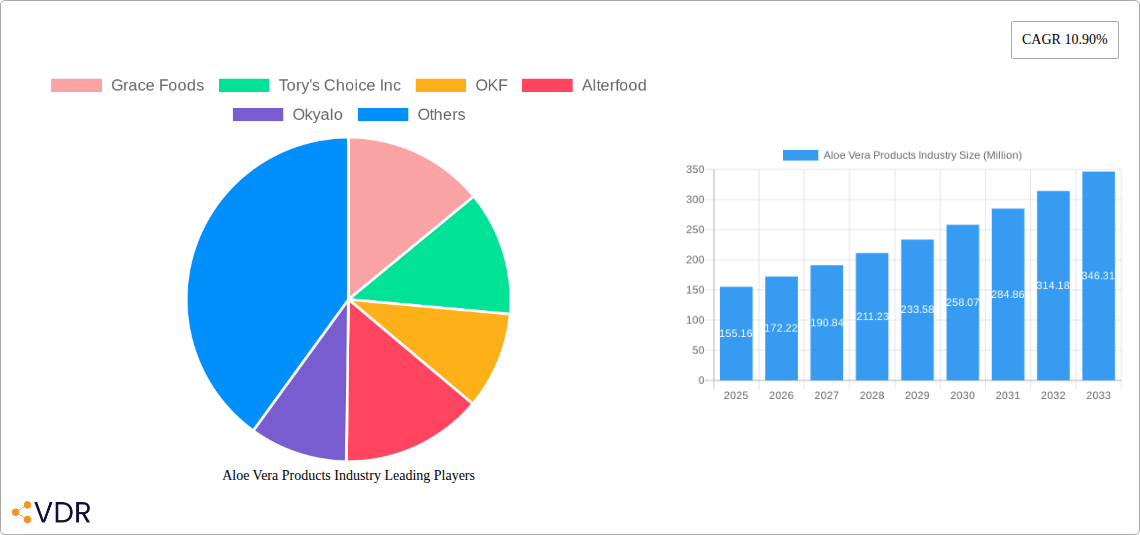
The global aloe vera products market, valued at $155.16 million in 2025, is projected to experience robust growth, exhibiting a Compound Annual Growth Rate (CAGR) of 10.90% from 2025 to 2033. This expansion is driven by the increasing consumer awareness of aloe vera's health benefits, particularly its skin soothing and digestive properties. The rising popularity of natural and organic products further fuels market demand, as consumers increasingly seek alternatives to synthetic ingredients. Growth is also spurred by the diverse applications of aloe vera across various product categories, including hot drinks, bottled beverages, juice concentrates, and aloe vera water, catering to a wide range of consumer preferences. Significant market segments include supermarkets/hypermarkets and online retail channels, reflecting evolving consumer shopping habits. While precise figures for individual segments are unavailable, it's reasonable to assume that bottled drinks and supermarkets/hypermarkets currently represent the largest segments, given the broad appeal of these formats. However, the online retail segment is anticipated to demonstrate substantial growth in the forecast period, driven by e-commerce expansion and the convenience it offers consumers. Geographic expansion, particularly in rapidly developing economies of Asia-Pacific and South America, is expected to contribute significantly to market growth.
The market faces certain restraints, including the potential for supply chain disruptions and fluctuations in raw material prices. Maintaining product quality and consistency is crucial for sustained market success. Competitive pressures among established players and emerging brands require continuous innovation and differentiation. Companies like Grace Foods, Tory's Choice Inc, and Forever Living Products are key players, however, smaller niche brands focusing on specific product segments or demographics are also likely to gain traction. The future success of individual companies hinges on effective marketing strategies that highlight the unique benefits of their aloe vera products and adapt to evolving consumer demands. Strategic partnerships with retailers and distributors are also essential for expanding market reach and building brand awareness. Further research into the specific applications of aloe vera, coupled with rigorous quality control and sustainable sourcing, will be vital for ensuring the continued growth and sustainability of the global aloe vera products market.
Aloe Vera Products Industry: A Comprehensive Market Report (2019-2033)
This comprehensive report provides an in-depth analysis of the Aloe Vera Products industry, encompassing market dynamics, growth trends, key players, and future outlook. The study period covers 2019-2033, with 2025 as the base and estimated year. This report is crucial for industry professionals, investors, and anyone seeking a detailed understanding of this burgeoning market. The global aloe vera products market is segmented by product type (hot drinks, bottled drinks, juice concentrates, aloe vera water) and distribution channel (supermarkets/hypermarkets, convenience/grocery stores, specialty stores, online retail stores, other distribution channels). The parent market is the beverage industry, while the child market is the functional beverage segment. We project the global market to reach xx Million units by 2033.
Aloe Vera Products Industry Market Dynamics & Structure
The aloe vera products market exhibits a moderately fragmented structure with several key players vying for market share. Market concentration is expected to increase slightly over the forecast period due to M&A activity and the growth of larger brands. Technological innovation is a key driver, with companies constantly seeking ways to improve product quality, taste, and shelf life. Regulatory frameworks related to food safety and labeling significantly impact the industry. The market faces competition from other functional beverages, including those with similar health benefits. End-user demographics are expanding, with increased demand from health-conscious consumers across various age groups.
- Market Concentration: Moderately fragmented, increasing slightly by 2033.
- Technological Innovation: Focus on improved taste, shelf life, and functional benefits.
- Regulatory Framework: Stringent food safety and labeling regulations.
- Competitive Substitutes: Other functional beverages (e.g., coconut water, kombucha).
- M&A Activity: xx deals projected between 2025 and 2033, leading to market consolidation.
- End-User Demographics: Growing health-conscious consumer base driving demand.
Aloe Vera Products Industry Growth Trends & Insights
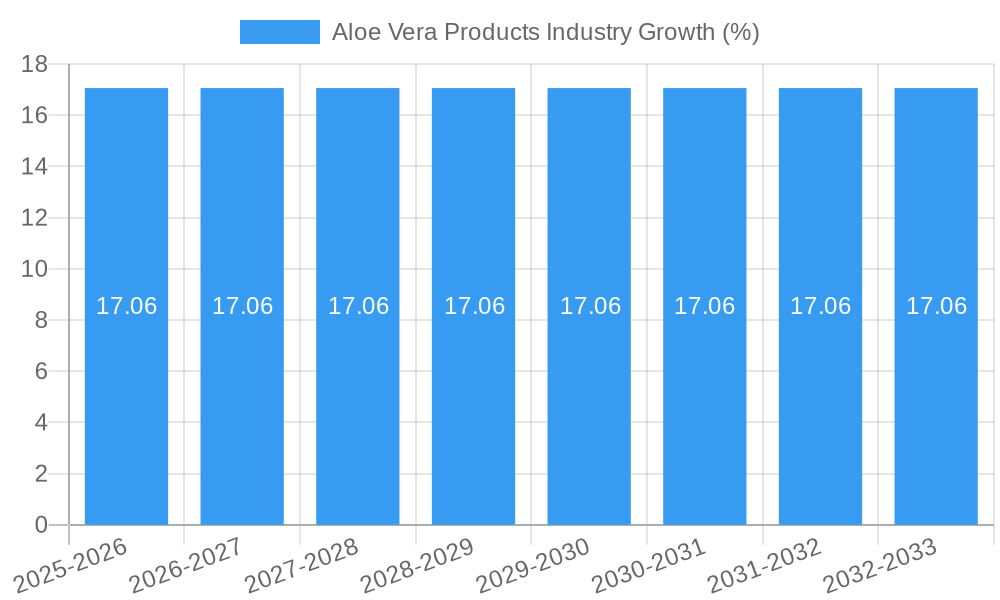
The aloe vera products market is experiencing robust growth, driven by increasing consumer awareness of the health benefits associated with aloe vera. The market size has expanded significantly from xx Million units in 2019 to xx Million units in 2024, and the CAGR during the historical period (2019-2024) was xx%. We project a CAGR of xx% during the forecast period (2025-2033), leading to a market size of xx Million units by 2033. Technological advancements in processing and packaging enhance product quality and extend shelf life. Consumer behavior shifts towards healthier lifestyle choices further fuel market expansion. Market penetration is increasing across various regions, particularly in developed and emerging economies.
Dominant Regions, Countries, or Segments in Aloe Vera Products Industry
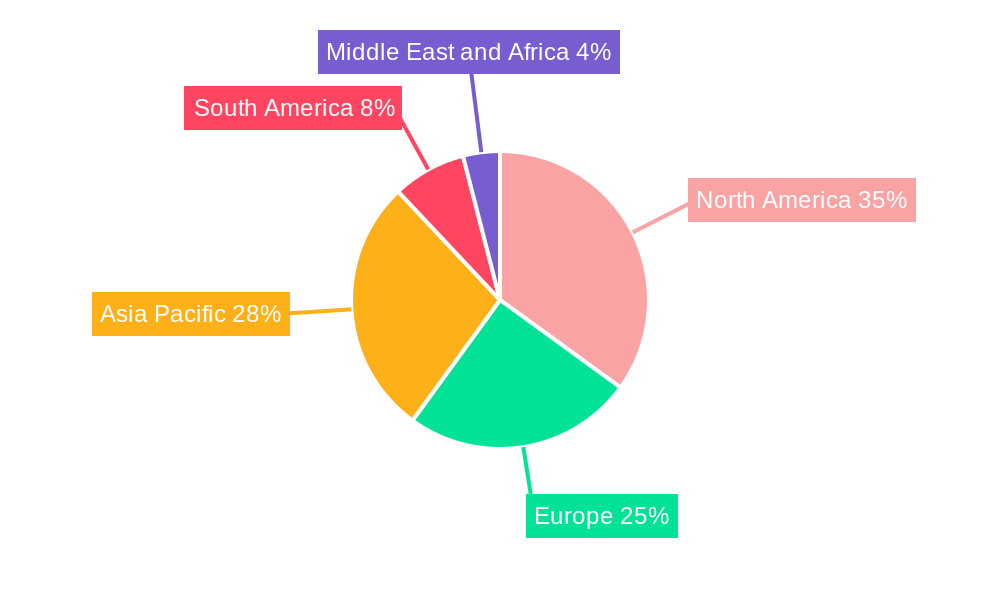
The North American region currently holds the largest market share, followed by Asia-Pacific. Within product types, bottled drinks and aloe vera water dominate the market. Supermarkets/hypermarkets represent the leading distribution channel.
- Leading Region: North America (Market Share: xx%)
- Fastest-Growing Region: Asia-Pacific (CAGR: xx%)
- Dominant Product Type: Bottled Drinks (Market Share: xx%)
- Primary Distribution Channel: Supermarkets/Hypermarkets (Market Share: xx%)
Key Drivers:
- Growing health consciousness among consumers.
- Increasing disposable incomes, particularly in emerging markets.
- Expanding retail infrastructure supporting distribution.
- Favorable government regulations promoting healthy food and beverage options.
Aloe Vera Products Industry Product Landscape
Product innovation focuses on diverse flavors, convenient packaging formats (e.g., single-serve bottles, pouches), and functional enhancements. Companies are increasingly emphasizing organic and natural ingredients, appealing to health-conscious consumers. Key performance metrics include shelf life, taste, and nutritional value. Unique selling propositions include claims related to digestive health, skin health, and immunity boosting properties. Technological advancements such as high-pressure processing and aseptic packaging extend product shelf life and enhance quality.
Key Drivers, Barriers & Challenges in Aloe Vera Products Industry
Key Drivers:
- Rising consumer demand for functional beverages.
- Growing health and wellness trends.
- Increasing disposable incomes in emerging markets.
- Advancements in aloe vera processing and packaging technologies.
Challenges:
- Intense competition among existing players.
- Supply chain disruptions impacting raw material availability and pricing.
- Stringent regulatory compliance requirements in various regions.
- Fluctuating raw material prices due to seasonal variations in aloe vera cultivation.
Emerging Opportunities in Aloe Vera Products Industry
- Expansion into untapped markets, particularly in Africa and Latin America.
- Development of novel aloe vera-based products (e.g., cosmetics, dietary supplements).
- Increased focus on sustainable and ethical sourcing of aloe vera.
- Customization of aloe vera products to cater to specific consumer needs (e.g., diabetic-friendly options).
Growth Accelerators in the Aloe Vera Products Industry
Technological advancements, strategic partnerships, and expansion into new geographic regions significantly contribute to long-term growth. Innovation in product formulations, packaging, and distribution networks enhances the market appeal. Collaborative efforts with retailers and distributors build market reach and consumer awareness. Successful market expansion into high-growth regions fuels further market development.
Key Players Shaping the Aloe Vera Products Industry Market
- Grace Foods
- Tory's Choice Inc
- OKF
- Alterfood
- Okyalo
- Houssy Global
- Veganic
- Forever Living Products
- Simplee Aloe
Notable Milestones in Aloe Vera Products Industry Sector
- April 2021: Veganic launched 100% organic and plant-based aloe vera fruit juices in the US.
- October 2021: Sappe launched two new aloe vera drinks in Thailand.
- September 2022: 1NE Beverages launched aloe vera juices in India.
In-Depth Aloe Vera Products Industry Market Outlook
The aloe vera products market presents significant growth potential driven by expanding consumer demand, technological innovation, and strategic market expansion. Companies focusing on product diversification, sustainable sourcing, and effective marketing strategies are poised to capture considerable market share. The increasing prevalence of health-conscious consumers globally offers continued growth opportunities for innovative and high-quality aloe vera products.
Aloe Vera Products Industry Segmentation
-
1. Product Type
- 1.1. Hot drinks
- 1.2. Bottled drinks
- 1.3. Juice Concentrates
- 1.4. Aloe Vera water
-
2. Distribution Channel
- 2.1. Supermarkets/Hypermarkets
- 2.2. Convenience/Grocery Stores
- 2.3. Specialty Stores
- 2.4. Online Retail Stores
- 2.5. Other Distribution Channels
Aloe Vera Products Industry Segmentation By Geography
-
1. North America
- 1.1. United States
- 1.2. Canada
- 1.3. Mexico
- 1.4. Rest of North America
-
2. Europe
- 2.1. Spain
- 2.2. United Kingdom
- 2.3. Germany
- 2.4. France
- 2.5. Italy
- 2.6. Russia
- 2.7. Rest of Europe
-
3. Asia Pacific
- 3.1. China
- 3.2. Japan
- 3.3. India
- 3.4. Australia
- 3.5. Rest of Asia Pacific
-
4. South America
- 4.1. Brazil
- 4.2. Argentina
- 4.3. Rest of South America
-
5. Middle East and Africa
- 5.1. South Africa
- 5.2. Saudi Arabia
- 5.3. Rest of Middle East and Africa
Aloe Vera Products Industry REPORT HIGHLIGHTS
| Aspects | Details |
|---|---|
| Study Period | 2019-2033 |
| Base Year | 2024 |
| Estimated Year | 2025 |
| Forecast Period | 2025-2033 |
| Historical Period | 2019-2024 |
| Growth Rate | CAGR of 10.90% from 2019-2033 |
| Segmentation |
|
Table of Contents
- 1. Introduction
- 1.1. Research Scope
- 1.2. Market Segmentation
- 1.3. Research Methodology
- 1.4. Definitions and Assumptions
- 2. Executive Summary
- 2.1. Introduction
- 3. Market Dynamics
- 3.1. Introduction
- 3.2. Market Drivers
- 3.2.1. Increasing Consumer Awareness Regarding Natural Products; Growing Demand for Anthocyanin in Pharmaceutical Industry
- 3.3. Market Restrains
- 3.3.1. Easy Availability of Synthetic Food Colorant
- 3.4. Market Trends
- 3.4.1. Aloe Vera based Juices to Witness Higher Growth
- 4. Market Factor Analysis
- 4.1. Porters Five Forces
- 4.2. Supply/Value Chain
- 4.3. PESTEL analysis
- 4.4. Market Entropy
- 4.5. Patent/Trademark Analysis
- 5. Global Aloe Vera Products Industry Analysis, Insights and Forecast, 2019-2031
- 5.1. Market Analysis, Insights and Forecast - by Product Type
- 5.1.1. Hot drinks
- 5.1.2. Bottled drinks
- 5.1.3. Juice Concentrates
- 5.1.4. Aloe Vera water
- 5.2. Market Analysis, Insights and Forecast - by Distribution Channel
- 5.2.1. Supermarkets/Hypermarkets
- 5.2.2. Convenience/Grocery Stores
- 5.2.3. Specialty Stores
- 5.2.4. Online Retail Stores
- 5.2.5. Other Distribution Channels
- 5.3. Market Analysis, Insights and Forecast - by Region
- 5.3.1. North America
- 5.3.2. Europe
- 5.3.3. Asia Pacific
- 5.3.4. South America
- 5.3.5. Middle East and Africa
- 5.1. Market Analysis, Insights and Forecast - by Product Type
- 6. North America Aloe Vera Products Industry Analysis, Insights and Forecast, 2019-2031
- 6.1. Market Analysis, Insights and Forecast - by Product Type
- 6.1.1. Hot drinks
- 6.1.2. Bottled drinks
- 6.1.3. Juice Concentrates
- 6.1.4. Aloe Vera water
- 6.2. Market Analysis, Insights and Forecast - by Distribution Channel
- 6.2.1. Supermarkets/Hypermarkets
- 6.2.2. Convenience/Grocery Stores
- 6.2.3. Specialty Stores
- 6.2.4. Online Retail Stores
- 6.2.5. Other Distribution Channels
- 6.1. Market Analysis, Insights and Forecast - by Product Type
- 7. Europe Aloe Vera Products Industry Analysis, Insights and Forecast, 2019-2031
- 7.1. Market Analysis, Insights and Forecast - by Product Type
- 7.1.1. Hot drinks
- 7.1.2. Bottled drinks
- 7.1.3. Juice Concentrates
- 7.1.4. Aloe Vera water
- 7.2. Market Analysis, Insights and Forecast - by Distribution Channel
- 7.2.1. Supermarkets/Hypermarkets
- 7.2.2. Convenience/Grocery Stores
- 7.2.3. Specialty Stores
- 7.2.4. Online Retail Stores
- 7.2.5. Other Distribution Channels
- 7.1. Market Analysis, Insights and Forecast - by Product Type
- 8. Asia Pacific Aloe Vera Products Industry Analysis, Insights and Forecast, 2019-2031
- 8.1. Market Analysis, Insights and Forecast - by Product Type
- 8.1.1. Hot drinks
- 8.1.2. Bottled drinks
- 8.1.3. Juice Concentrates
- 8.1.4. Aloe Vera water
- 8.2. Market Analysis, Insights and Forecast - by Distribution Channel
- 8.2.1. Supermarkets/Hypermarkets
- 8.2.2. Convenience/Grocery Stores
- 8.2.3. Specialty Stores
- 8.2.4. Online Retail Stores
- 8.2.5. Other Distribution Channels
- 8.1. Market Analysis, Insights and Forecast - by Product Type
- 9. South America Aloe Vera Products Industry Analysis, Insights and Forecast, 2019-2031
- 9.1. Market Analysis, Insights and Forecast - by Product Type
- 9.1.1. Hot drinks
- 9.1.2. Bottled drinks
- 9.1.3. Juice Concentrates
- 9.1.4. Aloe Vera water
- 9.2. Market Analysis, Insights and Forecast - by Distribution Channel
- 9.2.1. Supermarkets/Hypermarkets
- 9.2.2. Convenience/Grocery Stores
- 9.2.3. Specialty Stores
- 9.2.4. Online Retail Stores
- 9.2.5. Other Distribution Channels
- 9.1. Market Analysis, Insights and Forecast - by Product Type
- 10. Middle East and Africa Aloe Vera Products Industry Analysis, Insights and Forecast, 2019-2031
- 10.1. Market Analysis, Insights and Forecast - by Product Type
- 10.1.1. Hot drinks
- 10.1.2. Bottled drinks
- 10.1.3. Juice Concentrates
- 10.1.4. Aloe Vera water
- 10.2. Market Analysis, Insights and Forecast - by Distribution Channel
- 10.2.1. Supermarkets/Hypermarkets
- 10.2.2. Convenience/Grocery Stores
- 10.2.3. Specialty Stores
- 10.2.4. Online Retail Stores
- 10.2.5. Other Distribution Channels
- 10.1. Market Analysis, Insights and Forecast - by Product Type
- 11. North America Aloe Vera Products Industry Analysis, Insights and Forecast, 2019-2031
- 11.1. Market Analysis, Insights and Forecast - By Country/Sub-region
- 11.1.1 United States
- 11.1.2 Canada
- 11.1.3 Mexico
- 11.1.4 Rest of North America
- 12. Europe Aloe Vera Products Industry Analysis, Insights and Forecast, 2019-2031
- 12.1. Market Analysis, Insights and Forecast - By Country/Sub-region
- 12.1.1 Spain
- 12.1.2 United Kingdom
- 12.1.3 Germany
- 12.1.4 France
- 12.1.5 Italy
- 12.1.6 Russia
- 12.1.7 Rest of Europe
- 13. Asia Pacific Aloe Vera Products Industry Analysis, Insights and Forecast, 2019-2031
- 13.1. Market Analysis, Insights and Forecast - By Country/Sub-region
- 13.1.1 China
- 13.1.2 Japan
- 13.1.3 India
- 13.1.4 Australia
- 13.1.5 Rest of Asia Pacific
- 14. South America Aloe Vera Products Industry Analysis, Insights and Forecast, 2019-2031
- 14.1. Market Analysis, Insights and Forecast - By Country/Sub-region
- 14.1.1 Brazil
- 14.1.2 Argentina
- 14.1.3 Rest of South America
- 15. Middle East and Africa Aloe Vera Products Industry Analysis, Insights and Forecast, 2019-2031
- 15.1. Market Analysis, Insights and Forecast - By Country/Sub-region
- 15.1.1 South Africa
- 15.1.2 Saudi Arabia
- 15.1.3 Rest of Middle East and Africa
- 16. Competitive Analysis
- 16.1. Global Market Share Analysis 2024
- 16.2. Company Profiles
- 16.2.1 Grace Foods
- 16.2.1.1. Overview
- 16.2.1.2. Products
- 16.2.1.3. SWOT Analysis
- 16.2.1.4. Recent Developments
- 16.2.1.5. Financials (Based on Availability)
- 16.2.2 Tory's Choice Inc
- 16.2.2.1. Overview
- 16.2.2.2. Products
- 16.2.2.3. SWOT Analysis
- 16.2.2.4. Recent Developments
- 16.2.2.5. Financials (Based on Availability)
- 16.2.3 OKF
- 16.2.3.1. Overview
- 16.2.3.2. Products
- 16.2.3.3. SWOT Analysis
- 16.2.3.4. Recent Developments
- 16.2.3.5. Financials (Based on Availability)
- 16.2.4 Alterfood
- 16.2.4.1. Overview
- 16.2.4.2. Products
- 16.2.4.3. SWOT Analysis
- 16.2.4.4. Recent Developments
- 16.2.4.5. Financials (Based on Availability)
- 16.2.5 Okyalo
- 16.2.5.1. Overview
- 16.2.5.2. Products
- 16.2.5.3. SWOT Analysis
- 16.2.5.4. Recent Developments
- 16.2.5.5. Financials (Based on Availability)
- 16.2.6 Houssy Global
- 16.2.6.1. Overview
- 16.2.6.2. Products
- 16.2.6.3. SWOT Analysis
- 16.2.6.4. Recent Developments
- 16.2.6.5. Financials (Based on Availability)
- 16.2.7 Veganic*List Not Exhaustive
- 16.2.7.1. Overview
- 16.2.7.2. Products
- 16.2.7.3. SWOT Analysis
- 16.2.7.4. Recent Developments
- 16.2.7.5. Financials (Based on Availability)
- 16.2.8 Forever Living Products
- 16.2.8.1. Overview
- 16.2.8.2. Products
- 16.2.8.3. SWOT Analysis
- 16.2.8.4. Recent Developments
- 16.2.8.5. Financials (Based on Availability)
- 16.2.9 Simplee Aloe
- 16.2.9.1. Overview
- 16.2.9.2. Products
- 16.2.9.3. SWOT Analysis
- 16.2.9.4. Recent Developments
- 16.2.9.5. Financials (Based on Availability)
- 16.2.1 Grace Foods
List of Figures
- Figure 1: Global Aloe Vera Products Industry Revenue Breakdown (Million, %) by Region 2024 & 2032
- Figure 2: North America Aloe Vera Products Industry Revenue (Million), by Country 2024 & 2032
- Figure 3: North America Aloe Vera Products Industry Revenue Share (%), by Country 2024 & 2032
- Figure 4: Europe Aloe Vera Products Industry Revenue (Million), by Country 2024 & 2032
- Figure 5: Europe Aloe Vera Products Industry Revenue Share (%), by Country 2024 & 2032
- Figure 6: Asia Pacific Aloe Vera Products Industry Revenue (Million), by Country 2024 & 2032
- Figure 7: Asia Pacific Aloe Vera Products Industry Revenue Share (%), by Country 2024 & 2032
- Figure 8: South America Aloe Vera Products Industry Revenue (Million), by Country 2024 & 2032
- Figure 9: South America Aloe Vera Products Industry Revenue Share (%), by Country 2024 & 2032
- Figure 10: Middle East and Africa Aloe Vera Products Industry Revenue (Million), by Country 2024 & 2032
- Figure 11: Middle East and Africa Aloe Vera Products Industry Revenue Share (%), by Country 2024 & 2032
- Figure 12: North America Aloe Vera Products Industry Revenue (Million), by Product Type 2024 & 2032
- Figure 13: North America Aloe Vera Products Industry Revenue Share (%), by Product Type 2024 & 2032
- Figure 14: North America Aloe Vera Products Industry Revenue (Million), by Distribution Channel 2024 & 2032
- Figure 15: North America Aloe Vera Products Industry Revenue Share (%), by Distribution Channel 2024 & 2032
- Figure 16: North America Aloe Vera Products Industry Revenue (Million), by Country 2024 & 2032
- Figure 17: North America Aloe Vera Products Industry Revenue Share (%), by Country 2024 & 2032
- Figure 18: Europe Aloe Vera Products Industry Revenue (Million), by Product Type 2024 & 2032
- Figure 19: Europe Aloe Vera Products Industry Revenue Share (%), by Product Type 2024 & 2032
- Figure 20: Europe Aloe Vera Products Industry Revenue (Million), by Distribution Channel 2024 & 2032
- Figure 21: Europe Aloe Vera Products Industry Revenue Share (%), by Distribution Channel 2024 & 2032
- Figure 22: Europe Aloe Vera Products Industry Revenue (Million), by Country 2024 & 2032
- Figure 23: Europe Aloe Vera Products Industry Revenue Share (%), by Country 2024 & 2032
- Figure 24: Asia Pacific Aloe Vera Products Industry Revenue (Million), by Product Type 2024 & 2032
- Figure 25: Asia Pacific Aloe Vera Products Industry Revenue Share (%), by Product Type 2024 & 2032
- Figure 26: Asia Pacific Aloe Vera Products Industry Revenue (Million), by Distribution Channel 2024 & 2032
- Figure 27: Asia Pacific Aloe Vera Products Industry Revenue Share (%), by Distribution Channel 2024 & 2032
- Figure 28: Asia Pacific Aloe Vera Products Industry Revenue (Million), by Country 2024 & 2032
- Figure 29: Asia Pacific Aloe Vera Products Industry Revenue Share (%), by Country 2024 & 2032
- Figure 30: South America Aloe Vera Products Industry Revenue (Million), by Product Type 2024 & 2032
- Figure 31: South America Aloe Vera Products Industry Revenue Share (%), by Product Type 2024 & 2032
- Figure 32: South America Aloe Vera Products Industry Revenue (Million), by Distribution Channel 2024 & 2032
- Figure 33: South America Aloe Vera Products Industry Revenue Share (%), by Distribution Channel 2024 & 2032
- Figure 34: South America Aloe Vera Products Industry Revenue (Million), by Country 2024 & 2032
- Figure 35: South America Aloe Vera Products Industry Revenue Share (%), by Country 2024 & 2032
- Figure 36: Middle East and Africa Aloe Vera Products Industry Revenue (Million), by Product Type 2024 & 2032
- Figure 37: Middle East and Africa Aloe Vera Products Industry Revenue Share (%), by Product Type 2024 & 2032
- Figure 38: Middle East and Africa Aloe Vera Products Industry Revenue (Million), by Distribution Channel 2024 & 2032
- Figure 39: Middle East and Africa Aloe Vera Products Industry Revenue Share (%), by Distribution Channel 2024 & 2032
- Figure 40: Middle East and Africa Aloe Vera Products Industry Revenue (Million), by Country 2024 & 2032
- Figure 41: Middle East and Africa Aloe Vera Products Industry Revenue Share (%), by Country 2024 & 2032
List of Tables
- Table 1: Global Aloe Vera Products Industry Revenue Million Forecast, by Region 2019 & 2032
- Table 2: Global Aloe Vera Products Industry Revenue Million Forecast, by Product Type 2019 & 2032
- Table 3: Global Aloe Vera Products Industry Revenue Million Forecast, by Distribution Channel 2019 & 2032
- Table 4: Global Aloe Vera Products Industry Revenue Million Forecast, by Region 2019 & 2032
- Table 5: Global Aloe Vera Products Industry Revenue Million Forecast, by Country 2019 & 2032
- Table 6: United States Aloe Vera Products Industry Revenue (Million) Forecast, by Application 2019 & 2032
- Table 7: Canada Aloe Vera Products Industry Revenue (Million) Forecast, by Application 2019 & 2032
- Table 8: Mexico Aloe Vera Products Industry Revenue (Million) Forecast, by Application 2019 & 2032
- Table 9: Rest of North America Aloe Vera Products Industry Revenue (Million) Forecast, by Application 2019 & 2032
- Table 10: Global Aloe Vera Products Industry Revenue Million Forecast, by Country 2019 & 2032
- Table 11: Spain Aloe Vera Products Industry Revenue (Million) Forecast, by Application 2019 & 2032
- Table 12: United Kingdom Aloe Vera Products Industry Revenue (Million) Forecast, by Application 2019 & 2032
- Table 13: Germany Aloe Vera Products Industry Revenue (Million) Forecast, by Application 2019 & 2032
- Table 14: France Aloe Vera Products Industry Revenue (Million) Forecast, by Application 2019 & 2032
- Table 15: Italy Aloe Vera Products Industry Revenue (Million) Forecast, by Application 2019 & 2032
- Table 16: Russia Aloe Vera Products Industry Revenue (Million) Forecast, by Application 2019 & 2032
- Table 17: Rest of Europe Aloe Vera Products Industry Revenue (Million) Forecast, by Application 2019 & 2032
- Table 18: Global Aloe Vera Products Industry Revenue Million Forecast, by Country 2019 & 2032
- Table 19: China Aloe Vera Products Industry Revenue (Million) Forecast, by Application 2019 & 2032
- Table 20: Japan Aloe Vera Products Industry Revenue (Million) Forecast, by Application 2019 & 2032
- Table 21: India Aloe Vera Products Industry Revenue (Million) Forecast, by Application 2019 & 2032
- Table 22: Australia Aloe Vera Products Industry Revenue (Million) Forecast, by Application 2019 & 2032
- Table 23: Rest of Asia Pacific Aloe Vera Products Industry Revenue (Million) Forecast, by Application 2019 & 2032
- Table 24: Global Aloe Vera Products Industry Revenue Million Forecast, by Country 2019 & 2032
- Table 25: Brazil Aloe Vera Products Industry Revenue (Million) Forecast, by Application 2019 & 2032
- Table 26: Argentina Aloe Vera Products Industry Revenue (Million) Forecast, by Application 2019 & 2032
- Table 27: Rest of South America Aloe Vera Products Industry Revenue (Million) Forecast, by Application 2019 & 2032
- Table 28: Global Aloe Vera Products Industry Revenue Million Forecast, by Country 2019 & 2032
- Table 29: South Africa Aloe Vera Products Industry Revenue (Million) Forecast, by Application 2019 & 2032
- Table 30: Saudi Arabia Aloe Vera Products Industry Revenue (Million) Forecast, by Application 2019 & 2032
- Table 31: Rest of Middle East and Africa Aloe Vera Products Industry Revenue (Million) Forecast, by Application 2019 & 2032
- Table 32: Global Aloe Vera Products Industry Revenue Million Forecast, by Product Type 2019 & 2032
- Table 33: Global Aloe Vera Products Industry Revenue Million Forecast, by Distribution Channel 2019 & 2032
- Table 34: Global Aloe Vera Products Industry Revenue Million Forecast, by Country 2019 & 2032
- Table 35: United States Aloe Vera Products Industry Revenue (Million) Forecast, by Application 2019 & 2032
- Table 36: Canada Aloe Vera Products Industry Revenue (Million) Forecast, by Application 2019 & 2032
- Table 37: Mexico Aloe Vera Products Industry Revenue (Million) Forecast, by Application 2019 & 2032
- Table 38: Rest of North America Aloe Vera Products Industry Revenue (Million) Forecast, by Application 2019 & 2032
- Table 39: Global Aloe Vera Products Industry Revenue Million Forecast, by Product Type 2019 & 2032
- Table 40: Global Aloe Vera Products Industry Revenue Million Forecast, by Distribution Channel 2019 & 2032
- Table 41: Global Aloe Vera Products Industry Revenue Million Forecast, by Country 2019 & 2032
- Table 42: Spain Aloe Vera Products Industry Revenue (Million) Forecast, by Application 2019 & 2032
- Table 43: United Kingdom Aloe Vera Products Industry Revenue (Million) Forecast, by Application 2019 & 2032
- Table 44: Germany Aloe Vera Products Industry Revenue (Million) Forecast, by Application 2019 & 2032
- Table 45: France Aloe Vera Products Industry Revenue (Million) Forecast, by Application 2019 & 2032
- Table 46: Italy Aloe Vera Products Industry Revenue (Million) Forecast, by Application 2019 & 2032
- Table 47: Russia Aloe Vera Products Industry Revenue (Million) Forecast, by Application 2019 & 2032
- Table 48: Rest of Europe Aloe Vera Products Industry Revenue (Million) Forecast, by Application 2019 & 2032
- Table 49: Global Aloe Vera Products Industry Revenue Million Forecast, by Product Type 2019 & 2032
- Table 50: Global Aloe Vera Products Industry Revenue Million Forecast, by Distribution Channel 2019 & 2032
- Table 51: Global Aloe Vera Products Industry Revenue Million Forecast, by Country 2019 & 2032
- Table 52: China Aloe Vera Products Industry Revenue (Million) Forecast, by Application 2019 & 2032
- Table 53: Japan Aloe Vera Products Industry Revenue (Million) Forecast, by Application 2019 & 2032
- Table 54: India Aloe Vera Products Industry Revenue (Million) Forecast, by Application 2019 & 2032
- Table 55: Australia Aloe Vera Products Industry Revenue (Million) Forecast, by Application 2019 & 2032
- Table 56: Rest of Asia Pacific Aloe Vera Products Industry Revenue (Million) Forecast, by Application 2019 & 2032
- Table 57: Global Aloe Vera Products Industry Revenue Million Forecast, by Product Type 2019 & 2032
- Table 58: Global Aloe Vera Products Industry Revenue Million Forecast, by Distribution Channel 2019 & 2032
- Table 59: Global Aloe Vera Products Industry Revenue Million Forecast, by Country 2019 & 2032
- Table 60: Brazil Aloe Vera Products Industry Revenue (Million) Forecast, by Application 2019 & 2032
- Table 61: Argentina Aloe Vera Products Industry Revenue (Million) Forecast, by Application 2019 & 2032
- Table 62: Rest of South America Aloe Vera Products Industry Revenue (Million) Forecast, by Application 2019 & 2032
- Table 63: Global Aloe Vera Products Industry Revenue Million Forecast, by Product Type 2019 & 2032
- Table 64: Global Aloe Vera Products Industry Revenue Million Forecast, by Distribution Channel 2019 & 2032
- Table 65: Global Aloe Vera Products Industry Revenue Million Forecast, by Country 2019 & 2032
- Table 66: South Africa Aloe Vera Products Industry Revenue (Million) Forecast, by Application 2019 & 2032
- Table 67: Saudi Arabia Aloe Vera Products Industry Revenue (Million) Forecast, by Application 2019 & 2032
- Table 68: Rest of Middle East and Africa Aloe Vera Products Industry Revenue (Million) Forecast, by Application 2019 & 2032
Frequently Asked Questions
1. What is the projected Compound Annual Growth Rate (CAGR) of the Aloe Vera Products Industry?
The projected CAGR is approximately 10.90%.
2. Which companies are prominent players in the Aloe Vera Products Industry?
Key companies in the market include Grace Foods, Tory's Choice Inc, OKF, Alterfood, Okyalo, Houssy Global, Veganic*List Not Exhaustive, Forever Living Products, Simplee Aloe.
3. What are the main segments of the Aloe Vera Products Industry?
The market segments include Product Type, Distribution Channel.
4. Can you provide details about the market size?
The market size is estimated to be USD 155.16 Million as of 2022.
5. What are some drivers contributing to market growth?
Increasing Consumer Awareness Regarding Natural Products; Growing Demand for Anthocyanin in Pharmaceutical Industry.
6. What are the notable trends driving market growth?
Aloe Vera based Juices to Witness Higher Growth.
7. Are there any restraints impacting market growth?
Easy Availability of Synthetic Food Colorant.
8. Can you provide examples of recent developments in the market?
September 2022: 1NE Beverages, a seasoning and beverage brand under the subsidiary of US-based Livinia Foods, launched aloe vera juices available in a range of flavors in India. The company claims the product has antioxidant properties and multiple health benefits ranging from skin, oral, dental, or digestive health.
9. What pricing options are available for accessing the report?
Pricing options include single-user, multi-user, and enterprise licenses priced at USD 4750, USD 5250, and USD 8750 respectively.
10. Is the market size provided in terms of value or volume?
The market size is provided in terms of value, measured in Million.
11. Are there any specific market keywords associated with the report?
Yes, the market keyword associated with the report is "Aloe Vera Products Industry," which aids in identifying and referencing the specific market segment covered.
12. How do I determine which pricing option suits my needs best?
The pricing options vary based on user requirements and access needs. Individual users may opt for single-user licenses, while businesses requiring broader access may choose multi-user or enterprise licenses for cost-effective access to the report.
13. Are there any additional resources or data provided in the Aloe Vera Products Industry report?
While the report offers comprehensive insights, it's advisable to review the specific contents or supplementary materials provided to ascertain if additional resources or data are available.
14. How can I stay updated on further developments or reports in the Aloe Vera Products Industry?
To stay informed about further developments, trends, and reports in the Aloe Vera Products Industry, consider subscribing to industry newsletters, following relevant companies and organizations, or regularly checking reputable industry news sources and publications.
Methodology
Step 1 - Identification of Relevant Samples Size from Population Database


Step 2 - Approaches for Defining Global Market Size (Value, Volume* & Price*)

Note*: In applicable scenarios
Step 3 - Data Sources
Primary Research
- Web Analytics
- Survey Reports
- Research Institute
- Latest Research Reports
- Opinion Leaders
Secondary Research
- Annual Reports
- White Paper
- Latest Press Release
- Industry Association
- Paid Database
- Investor Presentations

Step 4 - Data Triangulation
Involves using different sources of information in order to increase the validity of a study
These sources are likely to be stakeholders in a program - participants, other researchers, program staff, other community members, and so on.
Then we put all data in single framework & apply various statistical tools to find out the dynamic on the market.
During the analysis stage, feedback from the stakeholder groups would be compared to determine areas of agreement as well as areas of divergence


