
Key Insights
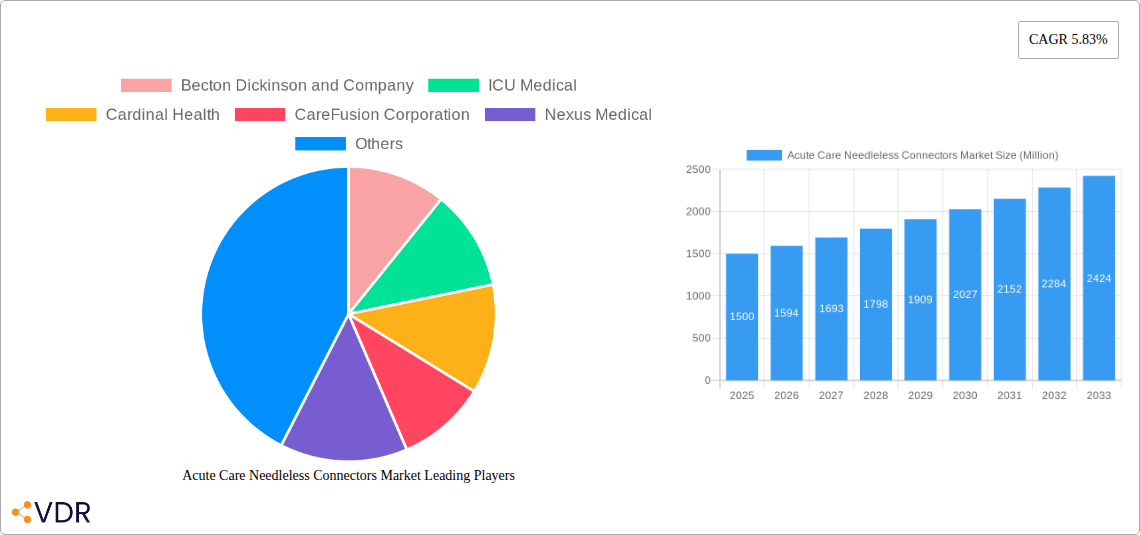
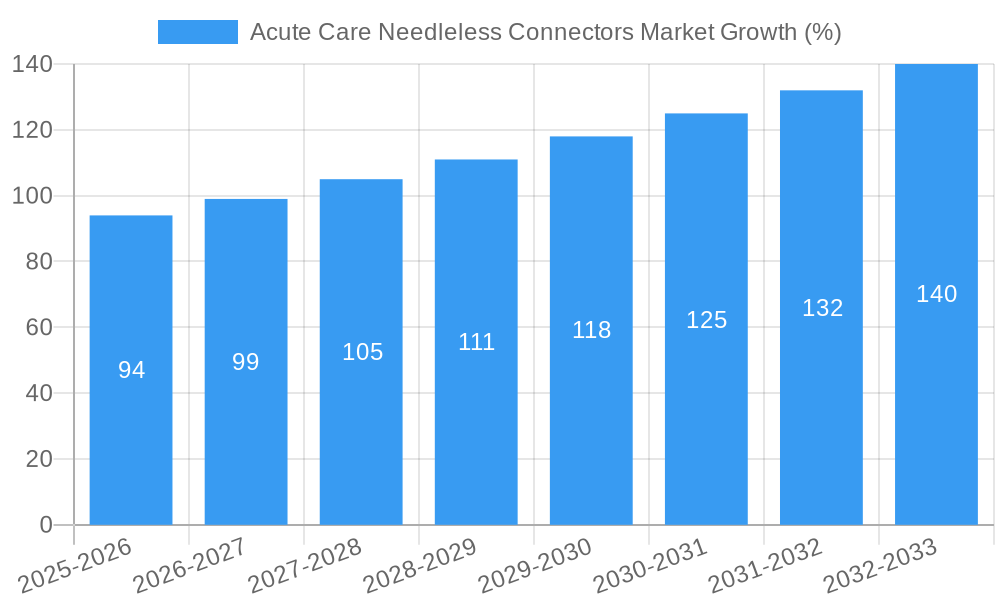
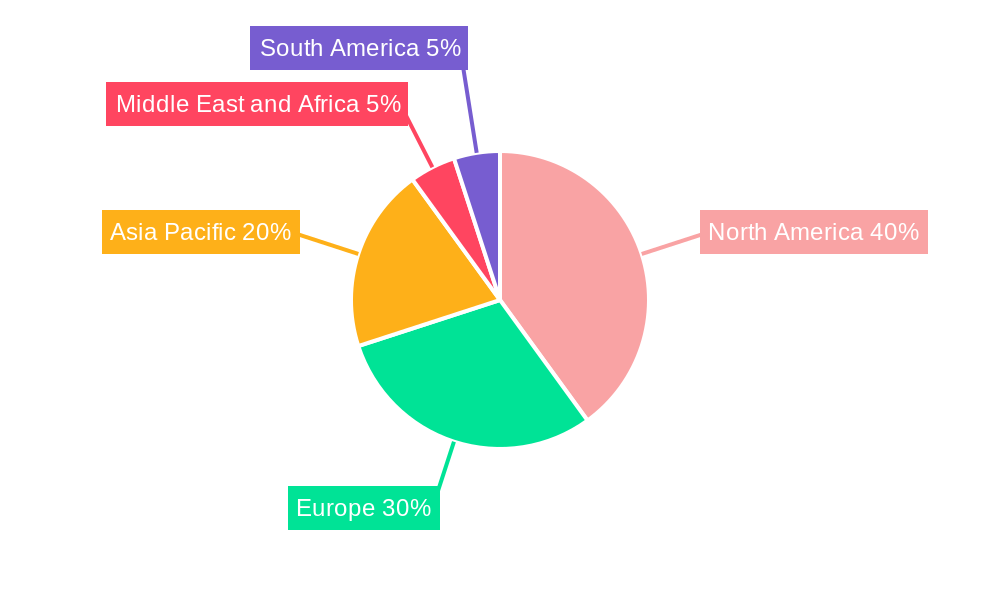
The acute care needleless connectors market is experiencing robust growth, driven by the increasing prevalence of chronic diseases, a rising geriatric population requiring more frequent healthcare interventions, and a global push towards enhanced patient safety. The market's 5.83% CAGR from 2019-2024 suggests a significant expansion, projected to continue through 2033. The shift towards minimally invasive procedures and a reduction in healthcare-associated infections (HAIs) are key trends fueling this growth. Needleless connectors offer a substantial advantage by minimizing the risk of needlestick injuries, a major concern for healthcare professionals. The market is segmented by mechanism (positive, negative, and neutral fluid displacement), connector type (simple and complex needleless connectors), and end-user (hospitals, clinics, and ambulatory settings, as well as others). Hospitals and clinics form the largest segment due to higher procedure volumes and stringent infection control protocols. While the market is competitive, with key players such as Becton Dickinson, ICU Medical, and Cardinal Health holding significant shares, smaller, specialized companies are also contributing through innovation in connector design and material science. The North American market currently leads in terms of market share, reflecting higher healthcare expenditure and technological adoption. However, the Asia-Pacific region is projected to experience significant growth in the coming years driven by increasing healthcare infrastructure development and rising disposable incomes. Regulatory approvals and pricing pressures remain potential restraints, impacting market expansion.
The market's future trajectory will be influenced by technological advancements leading to more sophisticated connectors with improved functionalities, including features like enhanced fluid control and integrated safety mechanisms. Government initiatives aimed at promoting patient safety and reducing healthcare costs will also play a crucial role. Furthermore, the increasing adoption of telehealth and home healthcare could potentially expand the market to a wider range of settings. Strategic partnerships and acquisitions amongst manufacturers will likely shape the competitive landscape, driving consolidation and innovation. The overall outlook for the acute care needleless connectors market remains positive, indicating strong growth potential for established and emerging players alike.
Acute Care Needleless Connectors Market Report: 2019-2033
This comprehensive report provides a detailed analysis of the Acute Care Needleless Connectors market, a critical sub-segment of the larger Medical Devices market. It offers in-depth insights into market dynamics, growth trends, regional dominance, product landscape, competitive analysis, and future outlook. The report covers the period 2019-2033, with a focus on the forecast period 2025-2033 and a base year of 2025. Market values are presented in million units.
Acute Care Needleless Connectors Market Dynamics & Structure
This section analyzes the intricate dynamics shaping the Acute Care Needleless Connectors market, encompassing market concentration, technological advancements, regulatory landscapes, competitive pressures, and market evolution. The global market is characterized by a moderately consolidated structure, with key players like Becton Dickinson and Company, ICU Medical, and Cardinal Health holding significant market share, estimated at xx% collectively in 2025. Technological innovation, particularly in materials science and fluid dynamics, drives market growth, while regulatory compliance (e.g., FDA approvals) and reimbursement policies significantly influence market expansion.
- Market Concentration: Moderately consolidated, with top 5 players holding xx% market share in 2025.
- Technological Innovation: Focus on improving safety, minimizing infections, and enhancing ease of use are key drivers.
- Regulatory Framework: FDA approvals and international regulatory compliance are crucial.
- Competitive Substitutes: Traditional needle-based systems represent the primary competitive threat.
- End-User Demographics: Growth is driven primarily by increasing hospitalizations and outpatient procedures.
- M&A Trends: A moderate number of M&A deals (xx deals in the past 5 years) indicate consolidation within the market.
Acute Care Needleless Connectors Market Growth Trends & Insights
The Acute Care Needleless Connectors market is experiencing significant growth, driven by several converging factors. The market size expanded from xx million units in 2019 to an estimated xx million units in 2025, exhibiting a CAGR of xx% during the historical period. This robust growth trajectory is expected to continue through 2033, with a projected CAGR of xx% driven by increasing adoption rates in hospitals and clinics, technological advancements leading to safer and more efficient connectors, and a growing awareness of the benefits of needleless systems in infection control. Changes in healthcare spending and consumer preferences towards safer medical devices also play a substantial role. Market penetration is estimated at xx% in 2025, with significant untapped potential for growth in emerging markets.
Dominant Regions, Countries, or Segments in Acute Care Needleless Connectors Market
North America currently dominates the Acute Care Needleless Connectors market, followed by Europe. This dominance is attributable to factors such as advanced healthcare infrastructure, stringent infection control protocols, and higher healthcare expenditure. Within the segmentation:
- Mechanism: Positive Fluid Displacement connectors currently hold the largest market share due to their reliability and widespread adoption.
- Connector Type: Simple Needleless Connectors constitute the largest segment due to their cost-effectiveness and ease of use.
- End User: Hospitals are the largest end-user segment, driven by high patient volumes and the need for infection control.
Key Drivers:
- North America: High healthcare expenditure, advanced medical infrastructure, stringent infection control regulations.
- Europe: Growing awareness of healthcare-associated infections, increasing adoption of advanced technologies.
- Asia-Pacific: Rapid healthcare infrastructure development, rising disposable incomes, and growing awareness of infection control.
Dominance Factors:
- Established healthcare infrastructure and high adoption rates.
- Stringent regulatory frameworks promoting safety and infection prevention.
- Higher healthcare expenditure compared to other regions.
Acute Care Needleless Connectors Market Product Landscape
The Acute Care Needleless Connectors market offers a diverse range of products, from simple, cost-effective connectors to sophisticated, technologically advanced systems. Innovations focus on enhanced safety features like integrated safety mechanisms, improved fluid pathway design for minimized dead space, and the incorporation of materials resistant to clotting and bacterial colonization. These advancements aim to improve clinical efficiency and reduce the risk of infection. Unique selling propositions often highlight superior safety, ease of use, compatibility with various infusion devices, and cost-effectiveness.
Key Drivers, Barriers & Challenges in Acute Care Needleless Connectors Market
Key Drivers:
- Growing prevalence of healthcare-associated infections (HAIs) driving the adoption of safer devices.
- Increasing demand for improved patient safety and reduced healthcare costs.
- Technological advancements in material science and fluid dynamics.
Key Challenges & Restraints:
- High initial investment costs for hospitals and clinics.
- Potential for malfunctions and leaks, despite technological advancements.
- Stringent regulatory requirements and lengthy approval processes. These impose significant time and cost barriers on market entry for new players.
Emerging Opportunities in Acute Care Needleless Connectors Market
Significant opportunities exist in expanding into emerging markets, developing innovative product designs with enhanced safety features and integrating connectivity to electronic health records (EHRs) for improved data management. Furthermore, leveraging telehealth initiatives and exploring applications in home healthcare could create new avenues for market growth.
Growth Accelerators in the Acute Care Needleless Connectors Market Industry
Technological breakthroughs in material science, leading to more durable and biocompatible connectors, coupled with strategic partnerships between manufacturers and healthcare providers, are key growth accelerators. Expanding into untapped markets in developing economies and focusing on product differentiation through enhanced safety features and improved user experience represent significant opportunities for long-term market expansion.
Key Players Shaping the Acute Care Needleless Connectors Market Market
- Becton Dickinson and Company
- ICU Medical
- Cardinal Health
- CareFusion Corporation (Acquired by Terumo Corporation)
- Nexus Medical
- Vygon SA
- B Braun Melsungen AG
- Baxter International Inc
- RyMed Technologies
Notable Milestones in Acute Care Needleless Connectors Market Sector
- 2020: FDA approval for a new needleless connector with enhanced safety features.
- 2022: Launch of a new line of needleless connectors with improved biocompatibility.
- 2023: Strategic partnership between two leading manufacturers to develop a novel needleless connector technology.
In-Depth Acute Care Needleless Connectors Market Market Outlook
The Acute Care Needleless Connectors market is poised for continued robust growth throughout the forecast period, driven by the unwavering focus on patient safety, technological innovations leading to enhanced safety and efficiency, and expanding healthcare infrastructure globally. Strategic partnerships, product diversification, and expansion into new markets will be crucial for companies to capitalize on this substantial market potential. The market’s future hinges on technological advancement, strategic collaborations, and regulatory landscape evolution, promising considerable growth opportunities for market participants.
Acute Care Needleless Connectors Market Segmentation
-
1. Mechanism
- 1.1. Positive Fluid Displacement
- 1.2. Negative Fluid Displacement
- 1.3. Neutral Fluid Displacement
-
2. Connector Type
- 2.1. Simple Needleless Connectors
- 2.2. Complex Needleless Connectors
-
3. End User
- 3.1. Hospitals
- 3.2. Clinics & Ambulatory Settings
- 3.3. Others
Acute Care Needleless Connectors Market Segmentation By Geography
-
1. North America
- 1.1. United States
- 1.2. Canada
- 1.3. Mexico
-
2. Europe
- 2.1. Germany
- 2.2. United Kingdom
- 2.3. France
- 2.4. Italy
- 2.5. Spain
- 2.6. Rest of Europe
-
3. Asia Pacific
- 3.1. China
- 3.2. Japan
- 3.3. India
- 3.4. Australia
- 3.5. South Korea
- 3.6. Rest of Asia Pacific
-
4. Middle East and Africa
- 4.1. GCC
- 4.2. South Africa
- 4.3. Rest of Middle East and Africa
-
5. South America
- 5.1. Brazil
- 5.2. Argentina
- 5.3. Rest of South America
Acute Care Needleless Connectors Market REPORT HIGHLIGHTS
| Aspects | Details |
|---|---|
| Study Period | 2019-2033 |
| Base Year | 2024 |
| Estimated Year | 2025 |
| Forecast Period | 2025-2033 |
| Historical Period | 2019-2024 |
| Growth Rate | CAGR of 5.83% from 2019-2033 |
| Segmentation |
|
Table of Contents
- 1. Introduction
- 1.1. Research Scope
- 1.2. Market Segmentation
- 1.3. Research Methodology
- 1.4. Definitions and Assumptions
- 2. Executive Summary
- 2.1. Introduction
- 3. Market Dynamics
- 3.1. Introduction
- 3.2. Market Drivers
- 3.2.1. ; Technological Advancements in Needleless Connectors; Increasing Emergency Visits in Hospitals
- 3.3. Market Restrains
- 3.3.1. ; Inadequate Staff Training; Risk Factors Associated with Contamination
- 3.4. Market Trends
- 3.4.1. Simple Needleless Connectors are Expected Register a High Growth Rate
- 4. Market Factor Analysis
- 4.1. Porters Five Forces
- 4.2. Supply/Value Chain
- 4.3. PESTEL analysis
- 4.4. Market Entropy
- 4.5. Patent/Trademark Analysis
- 5. Global Acute Care Needleless Connectors Market Analysis, Insights and Forecast, 2019-2031
- 5.1. Market Analysis, Insights and Forecast - by Mechanism
- 5.1.1. Positive Fluid Displacement
- 5.1.2. Negative Fluid Displacement
- 5.1.3. Neutral Fluid Displacement
- 5.2. Market Analysis, Insights and Forecast - by Connector Type
- 5.2.1. Simple Needleless Connectors
- 5.2.2. Complex Needleless Connectors
- 5.3. Market Analysis, Insights and Forecast - by End User
- 5.3.1. Hospitals
- 5.3.2. Clinics & Ambulatory Settings
- 5.3.3. Others
- 5.4. Market Analysis, Insights and Forecast - by Region
- 5.4.1. North America
- 5.4.2. Europe
- 5.4.3. Asia Pacific
- 5.4.4. Middle East and Africa
- 5.4.5. South America
- 5.1. Market Analysis, Insights and Forecast - by Mechanism
- 6. North America Acute Care Needleless Connectors Market Analysis, Insights and Forecast, 2019-2031
- 6.1. Market Analysis, Insights and Forecast - by Mechanism
- 6.1.1. Positive Fluid Displacement
- 6.1.2. Negative Fluid Displacement
- 6.1.3. Neutral Fluid Displacement
- 6.2. Market Analysis, Insights and Forecast - by Connector Type
- 6.2.1. Simple Needleless Connectors
- 6.2.2. Complex Needleless Connectors
- 6.3. Market Analysis, Insights and Forecast - by End User
- 6.3.1. Hospitals
- 6.3.2. Clinics & Ambulatory Settings
- 6.3.3. Others
- 6.1. Market Analysis, Insights and Forecast - by Mechanism
- 7. Europe Acute Care Needleless Connectors Market Analysis, Insights and Forecast, 2019-2031
- 7.1. Market Analysis, Insights and Forecast - by Mechanism
- 7.1.1. Positive Fluid Displacement
- 7.1.2. Negative Fluid Displacement
- 7.1.3. Neutral Fluid Displacement
- 7.2. Market Analysis, Insights and Forecast - by Connector Type
- 7.2.1. Simple Needleless Connectors
- 7.2.2. Complex Needleless Connectors
- 7.3. Market Analysis, Insights and Forecast - by End User
- 7.3.1. Hospitals
- 7.3.2. Clinics & Ambulatory Settings
- 7.3.3. Others
- 7.1. Market Analysis, Insights and Forecast - by Mechanism
- 8. Asia Pacific Acute Care Needleless Connectors Market Analysis, Insights and Forecast, 2019-2031
- 8.1. Market Analysis, Insights and Forecast - by Mechanism
- 8.1.1. Positive Fluid Displacement
- 8.1.2. Negative Fluid Displacement
- 8.1.3. Neutral Fluid Displacement
- 8.2. Market Analysis, Insights and Forecast - by Connector Type
- 8.2.1. Simple Needleless Connectors
- 8.2.2. Complex Needleless Connectors
- 8.3. Market Analysis, Insights and Forecast - by End User
- 8.3.1. Hospitals
- 8.3.2. Clinics & Ambulatory Settings
- 8.3.3. Others
- 8.1. Market Analysis, Insights and Forecast - by Mechanism
- 9. Middle East and Africa Acute Care Needleless Connectors Market Analysis, Insights and Forecast, 2019-2031
- 9.1. Market Analysis, Insights and Forecast - by Mechanism
- 9.1.1. Positive Fluid Displacement
- 9.1.2. Negative Fluid Displacement
- 9.1.3. Neutral Fluid Displacement
- 9.2. Market Analysis, Insights and Forecast - by Connector Type
- 9.2.1. Simple Needleless Connectors
- 9.2.2. Complex Needleless Connectors
- 9.3. Market Analysis, Insights and Forecast - by End User
- 9.3.1. Hospitals
- 9.3.2. Clinics & Ambulatory Settings
- 9.3.3. Others
- 9.1. Market Analysis, Insights and Forecast - by Mechanism
- 10. South America Acute Care Needleless Connectors Market Analysis, Insights and Forecast, 2019-2031
- 10.1. Market Analysis, Insights and Forecast - by Mechanism
- 10.1.1. Positive Fluid Displacement
- 10.1.2. Negative Fluid Displacement
- 10.1.3. Neutral Fluid Displacement
- 10.2. Market Analysis, Insights and Forecast - by Connector Type
- 10.2.1. Simple Needleless Connectors
- 10.2.2. Complex Needleless Connectors
- 10.3. Market Analysis, Insights and Forecast - by End User
- 10.3.1. Hospitals
- 10.3.2. Clinics & Ambulatory Settings
- 10.3.3. Others
- 10.1. Market Analysis, Insights and Forecast - by Mechanism
- 11. North America Acute Care Needleless Connectors Market Analysis, Insights and Forecast, 2019-2031
- 11.1. Market Analysis, Insights and Forecast - By Country/Sub-region
- 11.1.1. undefined
- 12. Europe Acute Care Needleless Connectors Market Analysis, Insights and Forecast, 2019-2031
- 12.1. Market Analysis, Insights and Forecast - By Country/Sub-region
- 12.1.1. undefined
- 13. Asia Pacific Acute Care Needleless Connectors Market Analysis, Insights and Forecast, 2019-2031
- 13.1. Market Analysis, Insights and Forecast - By Country/Sub-region
- 13.1.1. undefined
- 14. Middle East and Africa Acute Care Needleless Connectors Market Analysis, Insights and Forecast, 2019-2031
- 14.1. Market Analysis, Insights and Forecast - By Country/Sub-region
- 14.1.1. undefined
- 15. South America Acute Care Needleless Connectors Market Analysis, Insights and Forecast, 2019-2031
- 15.1. Market Analysis, Insights and Forecast - By Country/Sub-region
- 15.1.1. undefined
- 16. Competitive Analysis
- 16.1. Global Market Share Analysis 2024
- 16.2. Company Profiles
- 16.2.1 Becton Dickinson and Company
- 16.2.1.1. Overview
- 16.2.1.2. Products
- 16.2.1.3. SWOT Analysis
- 16.2.1.4. Recent Developments
- 16.2.1.5. Financials (Based on Availability)
- 16.2.2 ICU Medical
- 16.2.2.1. Overview
- 16.2.2.2. Products
- 16.2.2.3. SWOT Analysis
- 16.2.2.4. Recent Developments
- 16.2.2.5. Financials (Based on Availability)
- 16.2.3 Cardinal Health
- 16.2.3.1. Overview
- 16.2.3.2. Products
- 16.2.3.3. SWOT Analysis
- 16.2.3.4. Recent Developments
- 16.2.3.5. Financials (Based on Availability)
- 16.2.4 CareFusion Corporation
- 16.2.4.1. Overview
- 16.2.4.2. Products
- 16.2.4.3. SWOT Analysis
- 16.2.4.4. Recent Developments
- 16.2.4.5. Financials (Based on Availability)
- 16.2.5 Nexus Medical
- 16.2.5.1. Overview
- 16.2.5.2. Products
- 16.2.5.3. SWOT Analysis
- 16.2.5.4. Recent Developments
- 16.2.5.5. Financials (Based on Availability)
- 16.2.6 Vygon SA
- 16.2.6.1. Overview
- 16.2.6.2. Products
- 16.2.6.3. SWOT Analysis
- 16.2.6.4. Recent Developments
- 16.2.6.5. Financials (Based on Availability)
- 16.2.7 B Braun Melsungen AG
- 16.2.7.1. Overview
- 16.2.7.2. Products
- 16.2.7.3. SWOT Analysis
- 16.2.7.4. Recent Developments
- 16.2.7.5. Financials (Based on Availability)
- 16.2.8 Baxter International Inc
- 16.2.8.1. Overview
- 16.2.8.2. Products
- 16.2.8.3. SWOT Analysis
- 16.2.8.4. Recent Developments
- 16.2.8.5. Financials (Based on Availability)
- 16.2.9 RyMed Technologies
- 16.2.9.1. Overview
- 16.2.9.2. Products
- 16.2.9.3. SWOT Analysis
- 16.2.9.4. Recent Developments
- 16.2.9.5. Financials (Based on Availability)
- 16.2.1 Becton Dickinson and Company
List of Figures
- Figure 1: Global Acute Care Needleless Connectors Market Revenue Breakdown (Million, %) by Region 2024 & 2032
- Figure 2: Global Acute Care Needleless Connectors Market Volume Breakdown (K unit, %) by Region 2024 & 2032
- Figure 3: North America Acute Care Needleless Connectors Market Revenue (Million), by Country 2024 & 2032
- Figure 4: North America Acute Care Needleless Connectors Market Volume (K unit), by Country 2024 & 2032
- Figure 5: North America Acute Care Needleless Connectors Market Revenue Share (%), by Country 2024 & 2032
- Figure 6: North America Acute Care Needleless Connectors Market Volume Share (%), by Country 2024 & 2032
- Figure 7: Europe Acute Care Needleless Connectors Market Revenue (Million), by Country 2024 & 2032
- Figure 8: Europe Acute Care Needleless Connectors Market Volume (K unit), by Country 2024 & 2032
- Figure 9: Europe Acute Care Needleless Connectors Market Revenue Share (%), by Country 2024 & 2032
- Figure 10: Europe Acute Care Needleless Connectors Market Volume Share (%), by Country 2024 & 2032
- Figure 11: Asia Pacific Acute Care Needleless Connectors Market Revenue (Million), by Country 2024 & 2032
- Figure 12: Asia Pacific Acute Care Needleless Connectors Market Volume (K unit), by Country 2024 & 2032
- Figure 13: Asia Pacific Acute Care Needleless Connectors Market Revenue Share (%), by Country 2024 & 2032
- Figure 14: Asia Pacific Acute Care Needleless Connectors Market Volume Share (%), by Country 2024 & 2032
- Figure 15: Middle East and Africa Acute Care Needleless Connectors Market Revenue (Million), by Country 2024 & 2032
- Figure 16: Middle East and Africa Acute Care Needleless Connectors Market Volume (K unit), by Country 2024 & 2032
- Figure 17: Middle East and Africa Acute Care Needleless Connectors Market Revenue Share (%), by Country 2024 & 2032
- Figure 18: Middle East and Africa Acute Care Needleless Connectors Market Volume Share (%), by Country 2024 & 2032
- Figure 19: South America Acute Care Needleless Connectors Market Revenue (Million), by Country 2024 & 2032
- Figure 20: South America Acute Care Needleless Connectors Market Volume (K unit), by Country 2024 & 2032
- Figure 21: South America Acute Care Needleless Connectors Market Revenue Share (%), by Country 2024 & 2032
- Figure 22: South America Acute Care Needleless Connectors Market Volume Share (%), by Country 2024 & 2032
- Figure 23: North America Acute Care Needleless Connectors Market Revenue (Million), by Mechanism 2024 & 2032
- Figure 24: North America Acute Care Needleless Connectors Market Volume (K unit), by Mechanism 2024 & 2032
- Figure 25: North America Acute Care Needleless Connectors Market Revenue Share (%), by Mechanism 2024 & 2032
- Figure 26: North America Acute Care Needleless Connectors Market Volume Share (%), by Mechanism 2024 & 2032
- Figure 27: North America Acute Care Needleless Connectors Market Revenue (Million), by Connector Type 2024 & 2032
- Figure 28: North America Acute Care Needleless Connectors Market Volume (K unit), by Connector Type 2024 & 2032
- Figure 29: North America Acute Care Needleless Connectors Market Revenue Share (%), by Connector Type 2024 & 2032
- Figure 30: North America Acute Care Needleless Connectors Market Volume Share (%), by Connector Type 2024 & 2032
- Figure 31: North America Acute Care Needleless Connectors Market Revenue (Million), by End User 2024 & 2032
- Figure 32: North America Acute Care Needleless Connectors Market Volume (K unit), by End User 2024 & 2032
- Figure 33: North America Acute Care Needleless Connectors Market Revenue Share (%), by End User 2024 & 2032
- Figure 34: North America Acute Care Needleless Connectors Market Volume Share (%), by End User 2024 & 2032
- Figure 35: North America Acute Care Needleless Connectors Market Revenue (Million), by Country 2024 & 2032
- Figure 36: North America Acute Care Needleless Connectors Market Volume (K unit), by Country 2024 & 2032
- Figure 37: North America Acute Care Needleless Connectors Market Revenue Share (%), by Country 2024 & 2032
- Figure 38: North America Acute Care Needleless Connectors Market Volume Share (%), by Country 2024 & 2032
- Figure 39: Europe Acute Care Needleless Connectors Market Revenue (Million), by Mechanism 2024 & 2032
- Figure 40: Europe Acute Care Needleless Connectors Market Volume (K unit), by Mechanism 2024 & 2032
- Figure 41: Europe Acute Care Needleless Connectors Market Revenue Share (%), by Mechanism 2024 & 2032
- Figure 42: Europe Acute Care Needleless Connectors Market Volume Share (%), by Mechanism 2024 & 2032
- Figure 43: Europe Acute Care Needleless Connectors Market Revenue (Million), by Connector Type 2024 & 2032
- Figure 44: Europe Acute Care Needleless Connectors Market Volume (K unit), by Connector Type 2024 & 2032
- Figure 45: Europe Acute Care Needleless Connectors Market Revenue Share (%), by Connector Type 2024 & 2032
- Figure 46: Europe Acute Care Needleless Connectors Market Volume Share (%), by Connector Type 2024 & 2032
- Figure 47: Europe Acute Care Needleless Connectors Market Revenue (Million), by End User 2024 & 2032
- Figure 48: Europe Acute Care Needleless Connectors Market Volume (K unit), by End User 2024 & 2032
- Figure 49: Europe Acute Care Needleless Connectors Market Revenue Share (%), by End User 2024 & 2032
- Figure 50: Europe Acute Care Needleless Connectors Market Volume Share (%), by End User 2024 & 2032
- Figure 51: Europe Acute Care Needleless Connectors Market Revenue (Million), by Country 2024 & 2032
- Figure 52: Europe Acute Care Needleless Connectors Market Volume (K unit), by Country 2024 & 2032
- Figure 53: Europe Acute Care Needleless Connectors Market Revenue Share (%), by Country 2024 & 2032
- Figure 54: Europe Acute Care Needleless Connectors Market Volume Share (%), by Country 2024 & 2032
- Figure 55: Asia Pacific Acute Care Needleless Connectors Market Revenue (Million), by Mechanism 2024 & 2032
- Figure 56: Asia Pacific Acute Care Needleless Connectors Market Volume (K unit), by Mechanism 2024 & 2032
- Figure 57: Asia Pacific Acute Care Needleless Connectors Market Revenue Share (%), by Mechanism 2024 & 2032
- Figure 58: Asia Pacific Acute Care Needleless Connectors Market Volume Share (%), by Mechanism 2024 & 2032
- Figure 59: Asia Pacific Acute Care Needleless Connectors Market Revenue (Million), by Connector Type 2024 & 2032
- Figure 60: Asia Pacific Acute Care Needleless Connectors Market Volume (K unit), by Connector Type 2024 & 2032
- Figure 61: Asia Pacific Acute Care Needleless Connectors Market Revenue Share (%), by Connector Type 2024 & 2032
- Figure 62: Asia Pacific Acute Care Needleless Connectors Market Volume Share (%), by Connector Type 2024 & 2032
- Figure 63: Asia Pacific Acute Care Needleless Connectors Market Revenue (Million), by End User 2024 & 2032
- Figure 64: Asia Pacific Acute Care Needleless Connectors Market Volume (K unit), by End User 2024 & 2032
- Figure 65: Asia Pacific Acute Care Needleless Connectors Market Revenue Share (%), by End User 2024 & 2032
- Figure 66: Asia Pacific Acute Care Needleless Connectors Market Volume Share (%), by End User 2024 & 2032
- Figure 67: Asia Pacific Acute Care Needleless Connectors Market Revenue (Million), by Country 2024 & 2032
- Figure 68: Asia Pacific Acute Care Needleless Connectors Market Volume (K unit), by Country 2024 & 2032
- Figure 69: Asia Pacific Acute Care Needleless Connectors Market Revenue Share (%), by Country 2024 & 2032
- Figure 70: Asia Pacific Acute Care Needleless Connectors Market Volume Share (%), by Country 2024 & 2032
- Figure 71: Middle East and Africa Acute Care Needleless Connectors Market Revenue (Million), by Mechanism 2024 & 2032
- Figure 72: Middle East and Africa Acute Care Needleless Connectors Market Volume (K unit), by Mechanism 2024 & 2032
- Figure 73: Middle East and Africa Acute Care Needleless Connectors Market Revenue Share (%), by Mechanism 2024 & 2032
- Figure 74: Middle East and Africa Acute Care Needleless Connectors Market Volume Share (%), by Mechanism 2024 & 2032
- Figure 75: Middle East and Africa Acute Care Needleless Connectors Market Revenue (Million), by Connector Type 2024 & 2032
- Figure 76: Middle East and Africa Acute Care Needleless Connectors Market Volume (K unit), by Connector Type 2024 & 2032
- Figure 77: Middle East and Africa Acute Care Needleless Connectors Market Revenue Share (%), by Connector Type 2024 & 2032
- Figure 78: Middle East and Africa Acute Care Needleless Connectors Market Volume Share (%), by Connector Type 2024 & 2032
- Figure 79: Middle East and Africa Acute Care Needleless Connectors Market Revenue (Million), by End User 2024 & 2032
- Figure 80: Middle East and Africa Acute Care Needleless Connectors Market Volume (K unit), by End User 2024 & 2032
- Figure 81: Middle East and Africa Acute Care Needleless Connectors Market Revenue Share (%), by End User 2024 & 2032
- Figure 82: Middle East and Africa Acute Care Needleless Connectors Market Volume Share (%), by End User 2024 & 2032
- Figure 83: Middle East and Africa Acute Care Needleless Connectors Market Revenue (Million), by Country 2024 & 2032
- Figure 84: Middle East and Africa Acute Care Needleless Connectors Market Volume (K unit), by Country 2024 & 2032
- Figure 85: Middle East and Africa Acute Care Needleless Connectors Market Revenue Share (%), by Country 2024 & 2032
- Figure 86: Middle East and Africa Acute Care Needleless Connectors Market Volume Share (%), by Country 2024 & 2032
- Figure 87: South America Acute Care Needleless Connectors Market Revenue (Million), by Mechanism 2024 & 2032
- Figure 88: South America Acute Care Needleless Connectors Market Volume (K unit), by Mechanism 2024 & 2032
- Figure 89: South America Acute Care Needleless Connectors Market Revenue Share (%), by Mechanism 2024 & 2032
- Figure 90: South America Acute Care Needleless Connectors Market Volume Share (%), by Mechanism 2024 & 2032
- Figure 91: South America Acute Care Needleless Connectors Market Revenue (Million), by Connector Type 2024 & 2032
- Figure 92: South America Acute Care Needleless Connectors Market Volume (K unit), by Connector Type 2024 & 2032
- Figure 93: South America Acute Care Needleless Connectors Market Revenue Share (%), by Connector Type 2024 & 2032
- Figure 94: South America Acute Care Needleless Connectors Market Volume Share (%), by Connector Type 2024 & 2032
- Figure 95: South America Acute Care Needleless Connectors Market Revenue (Million), by End User 2024 & 2032
- Figure 96: South America Acute Care Needleless Connectors Market Volume (K unit), by End User 2024 & 2032
- Figure 97: South America Acute Care Needleless Connectors Market Revenue Share (%), by End User 2024 & 2032
- Figure 98: South America Acute Care Needleless Connectors Market Volume Share (%), by End User 2024 & 2032
- Figure 99: South America Acute Care Needleless Connectors Market Revenue (Million), by Country 2024 & 2032
- Figure 100: South America Acute Care Needleless Connectors Market Volume (K unit), by Country 2024 & 2032
- Figure 101: South America Acute Care Needleless Connectors Market Revenue Share (%), by Country 2024 & 2032
- Figure 102: South America Acute Care Needleless Connectors Market Volume Share (%), by Country 2024 & 2032
List of Tables
- Table 1: Global Acute Care Needleless Connectors Market Revenue Million Forecast, by Region 2019 & 2032
- Table 2: Global Acute Care Needleless Connectors Market Volume K unit Forecast, by Region 2019 & 2032
- Table 3: Global Acute Care Needleless Connectors Market Revenue Million Forecast, by Mechanism 2019 & 2032
- Table 4: Global Acute Care Needleless Connectors Market Volume K unit Forecast, by Mechanism 2019 & 2032
- Table 5: Global Acute Care Needleless Connectors Market Revenue Million Forecast, by Connector Type 2019 & 2032
- Table 6: Global Acute Care Needleless Connectors Market Volume K unit Forecast, by Connector Type 2019 & 2032
- Table 7: Global Acute Care Needleless Connectors Market Revenue Million Forecast, by End User 2019 & 2032
- Table 8: Global Acute Care Needleless Connectors Market Volume K unit Forecast, by End User 2019 & 2032
- Table 9: Global Acute Care Needleless Connectors Market Revenue Million Forecast, by Region 2019 & 2032
- Table 10: Global Acute Care Needleless Connectors Market Volume K unit Forecast, by Region 2019 & 2032
- Table 11: Global Acute Care Needleless Connectors Market Revenue Million Forecast, by Country 2019 & 2032
- Table 12: Global Acute Care Needleless Connectors Market Volume K unit Forecast, by Country 2019 & 2032
- Table 13: Global Acute Care Needleless Connectors Market Revenue Million Forecast, by Country 2019 & 2032
- Table 14: Global Acute Care Needleless Connectors Market Volume K unit Forecast, by Country 2019 & 2032
- Table 15: Global Acute Care Needleless Connectors Market Revenue Million Forecast, by Country 2019 & 2032
- Table 16: Global Acute Care Needleless Connectors Market Volume K unit Forecast, by Country 2019 & 2032
- Table 17: Global Acute Care Needleless Connectors Market Revenue Million Forecast, by Country 2019 & 2032
- Table 18: Global Acute Care Needleless Connectors Market Volume K unit Forecast, by Country 2019 & 2032
- Table 19: Global Acute Care Needleless Connectors Market Revenue Million Forecast, by Country 2019 & 2032
- Table 20: Global Acute Care Needleless Connectors Market Volume K unit Forecast, by Country 2019 & 2032
- Table 21: Global Acute Care Needleless Connectors Market Revenue Million Forecast, by Mechanism 2019 & 2032
- Table 22: Global Acute Care Needleless Connectors Market Volume K unit Forecast, by Mechanism 2019 & 2032
- Table 23: Global Acute Care Needleless Connectors Market Revenue Million Forecast, by Connector Type 2019 & 2032
- Table 24: Global Acute Care Needleless Connectors Market Volume K unit Forecast, by Connector Type 2019 & 2032
- Table 25: Global Acute Care Needleless Connectors Market Revenue Million Forecast, by End User 2019 & 2032
- Table 26: Global Acute Care Needleless Connectors Market Volume K unit Forecast, by End User 2019 & 2032
- Table 27: Global Acute Care Needleless Connectors Market Revenue Million Forecast, by Country 2019 & 2032
- Table 28: Global Acute Care Needleless Connectors Market Volume K unit Forecast, by Country 2019 & 2032
- Table 29: United States Acute Care Needleless Connectors Market Revenue (Million) Forecast, by Application 2019 & 2032
- Table 30: United States Acute Care Needleless Connectors Market Volume (K unit) Forecast, by Application 2019 & 2032
- Table 31: Canada Acute Care Needleless Connectors Market Revenue (Million) Forecast, by Application 2019 & 2032
- Table 32: Canada Acute Care Needleless Connectors Market Volume (K unit) Forecast, by Application 2019 & 2032
- Table 33: Mexico Acute Care Needleless Connectors Market Revenue (Million) Forecast, by Application 2019 & 2032
- Table 34: Mexico Acute Care Needleless Connectors Market Volume (K unit) Forecast, by Application 2019 & 2032
- Table 35: Global Acute Care Needleless Connectors Market Revenue Million Forecast, by Mechanism 2019 & 2032
- Table 36: Global Acute Care Needleless Connectors Market Volume K unit Forecast, by Mechanism 2019 & 2032
- Table 37: Global Acute Care Needleless Connectors Market Revenue Million Forecast, by Connector Type 2019 & 2032
- Table 38: Global Acute Care Needleless Connectors Market Volume K unit Forecast, by Connector Type 2019 & 2032
- Table 39: Global Acute Care Needleless Connectors Market Revenue Million Forecast, by End User 2019 & 2032
- Table 40: Global Acute Care Needleless Connectors Market Volume K unit Forecast, by End User 2019 & 2032
- Table 41: Global Acute Care Needleless Connectors Market Revenue Million Forecast, by Country 2019 & 2032
- Table 42: Global Acute Care Needleless Connectors Market Volume K unit Forecast, by Country 2019 & 2032
- Table 43: Germany Acute Care Needleless Connectors Market Revenue (Million) Forecast, by Application 2019 & 2032
- Table 44: Germany Acute Care Needleless Connectors Market Volume (K unit) Forecast, by Application 2019 & 2032
- Table 45: United Kingdom Acute Care Needleless Connectors Market Revenue (Million) Forecast, by Application 2019 & 2032
- Table 46: United Kingdom Acute Care Needleless Connectors Market Volume (K unit) Forecast, by Application 2019 & 2032
- Table 47: France Acute Care Needleless Connectors Market Revenue (Million) Forecast, by Application 2019 & 2032
- Table 48: France Acute Care Needleless Connectors Market Volume (K unit) Forecast, by Application 2019 & 2032
- Table 49: Italy Acute Care Needleless Connectors Market Revenue (Million) Forecast, by Application 2019 & 2032
- Table 50: Italy Acute Care Needleless Connectors Market Volume (K unit) Forecast, by Application 2019 & 2032
- Table 51: Spain Acute Care Needleless Connectors Market Revenue (Million) Forecast, by Application 2019 & 2032
- Table 52: Spain Acute Care Needleless Connectors Market Volume (K unit) Forecast, by Application 2019 & 2032
- Table 53: Rest of Europe Acute Care Needleless Connectors Market Revenue (Million) Forecast, by Application 2019 & 2032
- Table 54: Rest of Europe Acute Care Needleless Connectors Market Volume (K unit) Forecast, by Application 2019 & 2032
- Table 55: Global Acute Care Needleless Connectors Market Revenue Million Forecast, by Mechanism 2019 & 2032
- Table 56: Global Acute Care Needleless Connectors Market Volume K unit Forecast, by Mechanism 2019 & 2032
- Table 57: Global Acute Care Needleless Connectors Market Revenue Million Forecast, by Connector Type 2019 & 2032
- Table 58: Global Acute Care Needleless Connectors Market Volume K unit Forecast, by Connector Type 2019 & 2032
- Table 59: Global Acute Care Needleless Connectors Market Revenue Million Forecast, by End User 2019 & 2032
- Table 60: Global Acute Care Needleless Connectors Market Volume K unit Forecast, by End User 2019 & 2032
- Table 61: Global Acute Care Needleless Connectors Market Revenue Million Forecast, by Country 2019 & 2032
- Table 62: Global Acute Care Needleless Connectors Market Volume K unit Forecast, by Country 2019 & 2032
- Table 63: China Acute Care Needleless Connectors Market Revenue (Million) Forecast, by Application 2019 & 2032
- Table 64: China Acute Care Needleless Connectors Market Volume (K unit) Forecast, by Application 2019 & 2032
- Table 65: Japan Acute Care Needleless Connectors Market Revenue (Million) Forecast, by Application 2019 & 2032
- Table 66: Japan Acute Care Needleless Connectors Market Volume (K unit) Forecast, by Application 2019 & 2032
- Table 67: India Acute Care Needleless Connectors Market Revenue (Million) Forecast, by Application 2019 & 2032
- Table 68: India Acute Care Needleless Connectors Market Volume (K unit) Forecast, by Application 2019 & 2032
- Table 69: Australia Acute Care Needleless Connectors Market Revenue (Million) Forecast, by Application 2019 & 2032
- Table 70: Australia Acute Care Needleless Connectors Market Volume (K unit) Forecast, by Application 2019 & 2032
- Table 71: South Korea Acute Care Needleless Connectors Market Revenue (Million) Forecast, by Application 2019 & 2032
- Table 72: South Korea Acute Care Needleless Connectors Market Volume (K unit) Forecast, by Application 2019 & 2032
- Table 73: Rest of Asia Pacific Acute Care Needleless Connectors Market Revenue (Million) Forecast, by Application 2019 & 2032
- Table 74: Rest of Asia Pacific Acute Care Needleless Connectors Market Volume (K unit) Forecast, by Application 2019 & 2032
- Table 75: Global Acute Care Needleless Connectors Market Revenue Million Forecast, by Mechanism 2019 & 2032
- Table 76: Global Acute Care Needleless Connectors Market Volume K unit Forecast, by Mechanism 2019 & 2032
- Table 77: Global Acute Care Needleless Connectors Market Revenue Million Forecast, by Connector Type 2019 & 2032
- Table 78: Global Acute Care Needleless Connectors Market Volume K unit Forecast, by Connector Type 2019 & 2032
- Table 79: Global Acute Care Needleless Connectors Market Revenue Million Forecast, by End User 2019 & 2032
- Table 80: Global Acute Care Needleless Connectors Market Volume K unit Forecast, by End User 2019 & 2032
- Table 81: Global Acute Care Needleless Connectors Market Revenue Million Forecast, by Country 2019 & 2032
- Table 82: Global Acute Care Needleless Connectors Market Volume K unit Forecast, by Country 2019 & 2032
- Table 83: GCC Acute Care Needleless Connectors Market Revenue (Million) Forecast, by Application 2019 & 2032
- Table 84: GCC Acute Care Needleless Connectors Market Volume (K unit) Forecast, by Application 2019 & 2032
- Table 85: South Africa Acute Care Needleless Connectors Market Revenue (Million) Forecast, by Application 2019 & 2032
- Table 86: South Africa Acute Care Needleless Connectors Market Volume (K unit) Forecast, by Application 2019 & 2032
- Table 87: Rest of Middle East and Africa Acute Care Needleless Connectors Market Revenue (Million) Forecast, by Application 2019 & 2032
- Table 88: Rest of Middle East and Africa Acute Care Needleless Connectors Market Volume (K unit) Forecast, by Application 2019 & 2032
- Table 89: Global Acute Care Needleless Connectors Market Revenue Million Forecast, by Mechanism 2019 & 2032
- Table 90: Global Acute Care Needleless Connectors Market Volume K unit Forecast, by Mechanism 2019 & 2032
- Table 91: Global Acute Care Needleless Connectors Market Revenue Million Forecast, by Connector Type 2019 & 2032
- Table 92: Global Acute Care Needleless Connectors Market Volume K unit Forecast, by Connector Type 2019 & 2032
- Table 93: Global Acute Care Needleless Connectors Market Revenue Million Forecast, by End User 2019 & 2032
- Table 94: Global Acute Care Needleless Connectors Market Volume K unit Forecast, by End User 2019 & 2032
- Table 95: Global Acute Care Needleless Connectors Market Revenue Million Forecast, by Country 2019 & 2032
- Table 96: Global Acute Care Needleless Connectors Market Volume K unit Forecast, by Country 2019 & 2032
- Table 97: Brazil Acute Care Needleless Connectors Market Revenue (Million) Forecast, by Application 2019 & 2032
- Table 98: Brazil Acute Care Needleless Connectors Market Volume (K unit) Forecast, by Application 2019 & 2032
- Table 99: Argentina Acute Care Needleless Connectors Market Revenue (Million) Forecast, by Application 2019 & 2032
- Table 100: Argentina Acute Care Needleless Connectors Market Volume (K unit) Forecast, by Application 2019 & 2032
- Table 101: Rest of South America Acute Care Needleless Connectors Market Revenue (Million) Forecast, by Application 2019 & 2032
- Table 102: Rest of South America Acute Care Needleless Connectors Market Volume (K unit) Forecast, by Application 2019 & 2032
Frequently Asked Questions
1. What is the projected Compound Annual Growth Rate (CAGR) of the Acute Care Needleless Connectors Market?
The projected CAGR is approximately 5.83%.
2. Which companies are prominent players in the Acute Care Needleless Connectors Market?
Key companies in the market include Becton Dickinson and Company, ICU Medical, Cardinal Health, CareFusion Corporation, Nexus Medical, Vygon SA, B Braun Melsungen AG, Baxter International Inc, RyMed Technologies.
3. What are the main segments of the Acute Care Needleless Connectors Market?
The market segments include Mechanism, Connector Type, End User.
4. Can you provide details about the market size?
The market size is estimated to be USD XX Million as of 2022.
5. What are some drivers contributing to market growth?
; Technological Advancements in Needleless Connectors; Increasing Emergency Visits in Hospitals.
6. What are the notable trends driving market growth?
Simple Needleless Connectors are Expected Register a High Growth Rate.
7. Are there any restraints impacting market growth?
; Inadequate Staff Training; Risk Factors Associated with Contamination.
8. Can you provide examples of recent developments in the market?
N/A
9. What pricing options are available for accessing the report?
Pricing options include single-user, multi-user, and enterprise licenses priced at USD 4750, USD 5250, and USD 8750 respectively.
10. Is the market size provided in terms of value or volume?
The market size is provided in terms of value, measured in Million and volume, measured in K unit.
11. Are there any specific market keywords associated with the report?
Yes, the market keyword associated with the report is "Acute Care Needleless Connectors Market," which aids in identifying and referencing the specific market segment covered.
12. How do I determine which pricing option suits my needs best?
The pricing options vary based on user requirements and access needs. Individual users may opt for single-user licenses, while businesses requiring broader access may choose multi-user or enterprise licenses for cost-effective access to the report.
13. Are there any additional resources or data provided in the Acute Care Needleless Connectors Market report?
While the report offers comprehensive insights, it's advisable to review the specific contents or supplementary materials provided to ascertain if additional resources or data are available.
14. How can I stay updated on further developments or reports in the Acute Care Needleless Connectors Market?
To stay informed about further developments, trends, and reports in the Acute Care Needleless Connectors Market, consider subscribing to industry newsletters, following relevant companies and organizations, or regularly checking reputable industry news sources and publications.
Methodology
Step 1 - Identification of Relevant Samples Size from Population Database


Step 2 - Approaches for Defining Global Market Size (Value, Volume* & Price*)

Note*: In applicable scenarios
Step 3 - Data Sources
Primary Research
- Web Analytics
- Survey Reports
- Research Institute
- Latest Research Reports
- Opinion Leaders
Secondary Research
- Annual Reports
- White Paper
- Latest Press Release
- Industry Association
- Paid Database
- Investor Presentations

Step 4 - Data Triangulation
Involves using different sources of information in order to increase the validity of a study
These sources are likely to be stakeholders in a program - participants, other researchers, program staff, other community members, and so on.
Then we put all data in single framework & apply various statistical tools to find out the dynamic on the market.
During the analysis stage, feedback from the stakeholder groups would be compared to determine areas of agreement as well as areas of divergence


