
Key Insights
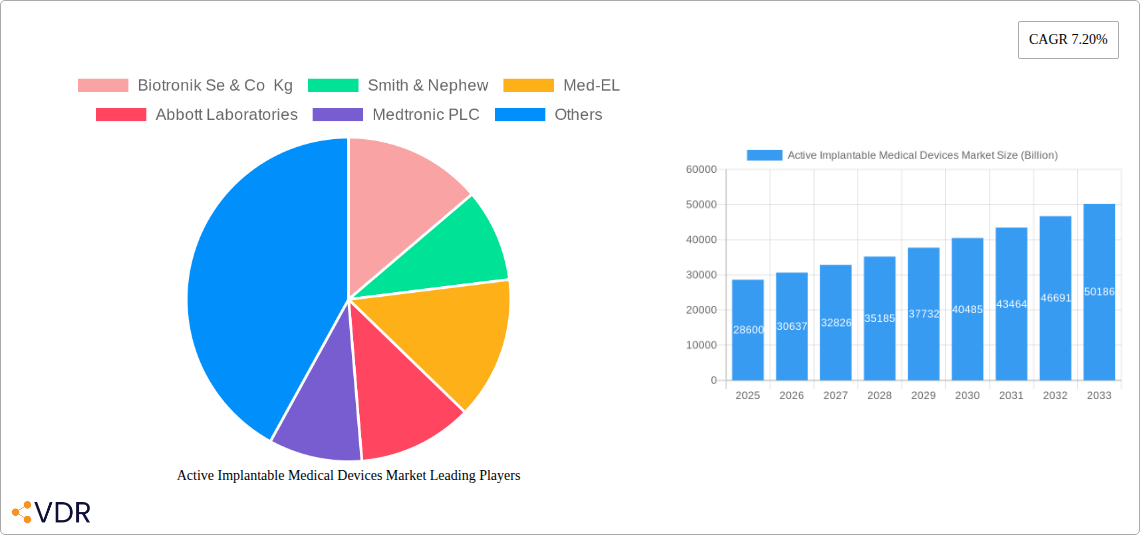
The global Active Implantable Medical Devices market, valued at $28.6 billion in 2025, is projected to experience robust growth, driven by a Compound Annual Growth Rate (CAGR) of 7.20% from 2025 to 2033. This expansion is fueled by several key factors. The aging global population, leading to a higher prevalence of chronic diseases requiring implantable devices such as pacemakers and defibrillators, is a major driver. Technological advancements, including miniaturization, improved battery life, and enhanced functionalities, are also contributing to market growth. Furthermore, increasing healthcare expenditure and rising disposable incomes in developing economies are expanding access to these life-saving technologies. The market is segmented by product type, including Implantable Cardioverter Defibrillators (ICDs), Implantable Cardiac Pacemakers (ICPs), Ventricular Assist Devices (VADs), Implantable Heart Monitors/Insertable Loop Recorders (IHMs/ILRs), Neurostimulators, Implantable Hearing Devices, and others. Competition is fierce among major players like Medtronic, Abbott Laboratories, Boston Scientific, and others, leading to continuous innovation and the development of advanced devices.
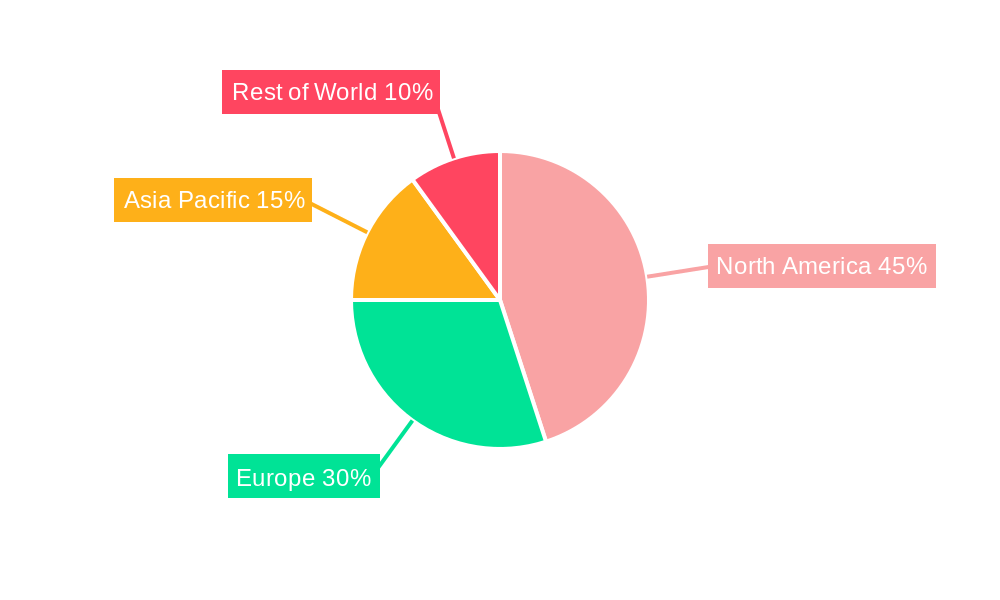
Significant regional variations exist. North America currently holds a substantial market share due to advanced healthcare infrastructure and high adoption rates. However, the Asia-Pacific region is poised for significant growth, driven by rising healthcare awareness, improving healthcare infrastructure, and a burgeoning middle class. While regulatory hurdles and high device costs present challenges, the overall market outlook remains positive, indicating substantial growth opportunities for existing players and new entrants alike. The increasing demand for minimally invasive procedures and the development of sophisticated remote monitoring capabilities are further contributing to the market's expansion. This market demonstrates a strong positive correlation between advancements in medical technology and the increasing demand for improved patient outcomes.
Active Implantable Medical Devices Market: A Comprehensive Report (2019-2033)
This comprehensive report provides an in-depth analysis of the Active Implantable Medical Devices market, encompassing market dynamics, growth trends, regional dominance, product landscape, key players, and future outlook. The study period covers 2019-2033, with 2025 as the base and estimated year. The market is segmented by product type, offering granular insights into various device categories. The report is invaluable for industry professionals, investors, and strategists seeking a thorough understanding of this rapidly evolving sector. The total market size is projected to reach xx Billion by 2033.
Active Implantable Medical Devices Market Market Dynamics & Structure
The Active Implantable Medical Devices market exhibits a moderately consolidated structure with key players such as Medtronic PLC, Abbott Laboratories, and Boston Scientific Corporation holding significant market share. Technological innovation, particularly in miniaturization, improved biocompatibility, and wireless capabilities, is a primary growth driver. Stringent regulatory frameworks, including those governing device approval and safety, impact market entry and product development. The market faces competition from less invasive procedures and alternative therapies. End-user demographics, characterized by an aging global population and increasing prevalence of chronic diseases, significantly influence market demand. Mergers and acquisitions (M&A) activity within the industry is frequent, facilitating technological advancements and market expansion.
- Market Concentration: Moderately consolidated, with top 5 players holding approximately 60% market share in 2025.
- Technological Innovation: Focus on miniaturization, improved battery life, wireless connectivity, and AI-driven diagnostics.
- Regulatory Framework: Stringent approvals (e.g., FDA, CE Mark) create barriers to entry but ensure patient safety.
- Competitive Substitutes: Alternative treatments and minimally invasive procedures pose competitive challenges.
- End-User Demographics: Aging population and increasing prevalence of cardiovascular and neurological diseases fuel market growth.
- M&A Activity: High M&A activity, driving consolidation and technological integration; approximately 15 major deals per year in the last 5 years.
Active Implantable Medical Devices Market Growth Trends & Insights
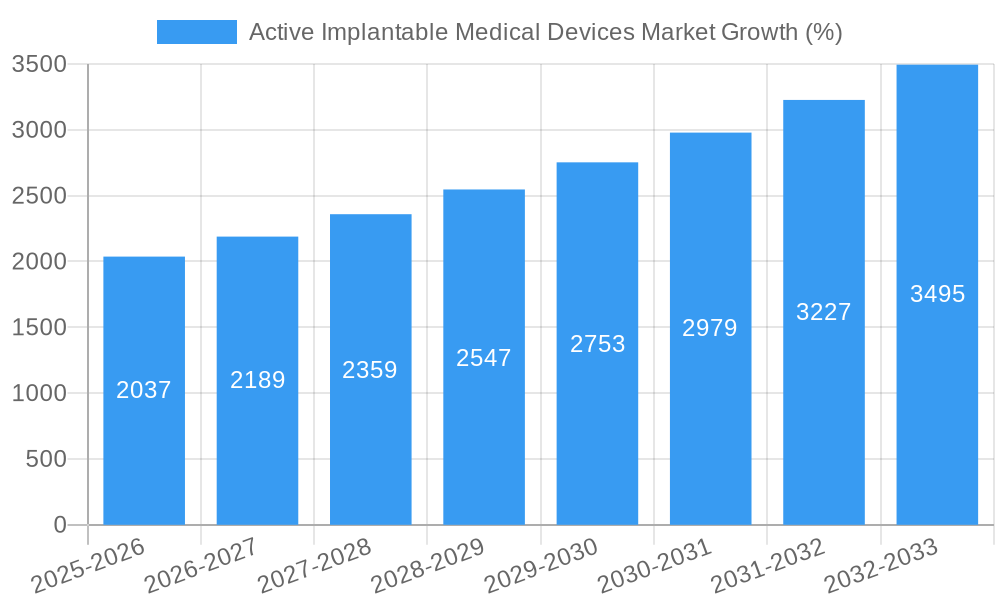
The Active Implantable Medical Devices market witnessed significant growth between 2019 and 2024, fueled by technological advancements and an aging population. The market is projected to experience a Compound Annual Growth Rate (CAGR) of xx% during the forecast period (2025-2033), reaching a value of xx Billion by 2033. Adoption rates are rising steadily, driven by improved device efficacy, reduced invasiveness, and enhanced patient outcomes. Technological disruptions, such as the development of leadless pacemakers and advanced neurostimulators, are reshaping the market landscape. Consumer behavior shifts reflect an increased preference for minimally invasive procedures and improved device aesthetics.
Dominant Regions, Countries, or Segments in Active Implantable Medical Devices Market
North America currently dominates the Active Implantable Medical Devices market, driven by high healthcare expenditure, advanced medical infrastructure, and a large aging population. Within this region, the United States represents the largest segment. Europe holds a significant market share, followed by the Asia-Pacific region, which is experiencing rapid growth due to rising healthcare spending and increased awareness of chronic diseases. The Implantable Cardiac Pacemakers segment currently holds the largest share within the product category, followed closely by Implantable Cardioverter Defibrillators (ICDs).
- North America: High healthcare expenditure, advanced medical infrastructure, and large aging population drive market dominance.
- Europe: Significant market share, driven by robust healthcare systems and adoption of advanced technologies.
- Asia-Pacific: Rapid growth fueled by increasing healthcare spending and rising awareness of cardiovascular and neurological diseases.
- Implantable Cardiac Pacemakers: Largest market segment due to high prevalence of heart conditions.
- Implantable Cardioverter Defibrillators (ICDs): Second largest segment, driven by increasing incidence of arrhythmias.
Active Implantable Medical Devices Market Product Landscape
The Active Implantable Medical Devices market showcases a diverse range of products, including implantable cardioverter defibrillators (ICDs), implantable cardiac pacemakers, ventricular assist devices (VADs), implantable heart monitors/insertable loop recorders, neurostimulators, and implantable hearing devices. Recent innovations focus on reducing device size, enhancing battery life, and incorporating advanced features such as remote monitoring and personalized therapy. Key selling propositions include improved patient comfort, enhanced efficacy, and reduced complications. Technological advancements, such as leadless pacemakers and advanced neurostimulation technologies, are driving product differentiation and market expansion.
Key Drivers, Barriers & Challenges in Active Implantable Medical Devices Market
Key Drivers:
- Aging global population
- Rising prevalence of chronic diseases (cardiovascular, neurological)
- Technological advancements (miniaturization, improved battery life, wireless capabilities)
- Increasing healthcare expenditure
Key Challenges:
- High cost of devices and procedures limiting accessibility.
- Stringent regulatory pathways prolonging time to market.
- Potential complications and adverse events associated with implantation.
- Supply chain disruptions impacting device availability.
Emerging Opportunities in Active Implantable Medical Devices Market
Emerging opportunities include expansion into untapped markets in developing economies, development of innovative device designs tailored to specific patient needs, and growth in remote patient monitoring capabilities for improved care management. Furthermore, integration of artificial intelligence (AI) for diagnostic purposes and personalized therapies presents considerable growth potential.
Growth Accelerators in the Active Implantable Medical Devices Market Industry
Technological breakthroughs, such as biocompatible materials and advanced sensor technologies, are accelerating market growth. Strategic partnerships between device manufacturers and healthcare providers are streamlining product development and market access. Expansion strategies into new geographical markets, particularly in developing economies, are fueling market expansion.
Key Players Shaping the Active Implantable Medical Devices Market Market
- Biotronik Se & Co Kg
- Smith & Nephew
- Med-EL
- Abbott Laboratories
- Medtronic PLC
- Sonova Holding AG
- Stryker Corporation
- Johnson & Johnson Services Inc
- Livanova PLC
- Boston Scientific Corporation
- Cochlear Limited
- Nurotron Biotechnology Co Ltd
Notable Milestones in Active Implantable Medical Devices Market Sector
- August 2022: Medtronic plc launched an investigational extravascular implantable cardioverter defibrillator (EV ICD) system achieving a 98.7% defibrillation success rate in a global clinical trial.
- February 2022: Abbott launched patient implants of a dual-chamber leadless pacemaker system as part of its AVEIR DR i2i pivotal clinical study.
In-Depth Active Implantable Medical Devices Market Market Outlook
The Active Implantable Medical Devices market is poised for sustained growth, driven by technological advancements, an aging population, and rising healthcare spending. Strategic opportunities lie in developing innovative products, expanding into new markets, and forging strategic partnerships to consolidate market share and enhance patient care. The long-term outlook remains positive, with significant potential for further expansion and innovation within this crucial sector.
Active Implantable Medical Devices Market Segmentation
-
1. Product
- 1.1. Implantable Cardioverter Defibrillators
- 1.2. Implantable Cardiac Pacemakers
- 1.3. Ventricular Assist Devices
- 1.4. Implanta
- 1.5. Neurostimulators
- 1.6. Implantable Hearing Devices
- 1.7. Others
Active Implantable Medical Devices Market Segmentation By Geography
-
1. North America
- 1.1. United States
- 1.2. Canada
- 1.3. Mexico
-
2. Europe
- 2.1. Germany
- 2.2. United Kingdom
- 2.3. France
- 2.4. Italy
- 2.5. Spain
- 2.6. Rest of Europe
-
3. Asia Pacific
- 3.1. China
- 3.2. Japan
- 3.3. India
- 3.4. Australia
- 3.5. South Korea
- 3.6. Rest of Asia Pacific
-
4. Middle East and Africa
- 4.1. GCC
- 4.2. South Africa
- 4.3. Rest of Middle East and Africa
-
5. South America
- 5.1. Brazil
- 5.2. Argentina
- 5.3. Rest of South America
Active Implantable Medical Devices Market REPORT HIGHLIGHTS
| Aspects | Details |
|---|---|
| Study Period | 2019-2033 |
| Base Year | 2024 |
| Estimated Year | 2025 |
| Forecast Period | 2025-2033 |
| Historical Period | 2019-2024 |
| Growth Rate | CAGR of 7.20% from 2019-2033 |
| Segmentation |
|
Table of Contents
- 1. Introduction
- 1.1. Research Scope
- 1.2. Market Segmentation
- 1.3. Research Methodology
- 1.4. Definitions and Assumptions
- 2. Executive Summary
- 2.1. Introduction
- 3. Market Dynamics
- 3.1. Introduction
- 3.2. Market Drivers
- 3.2.1. Increasing Burden of Cardiovascular and Neurological Diseases; Investments and Funds to Develop Technologically Advanced Products
- 3.3. Market Restrains
- 3.3.1. Issues Related to the Use of Implantable Medical Devices; High Cost of Implants and Stringent Regulations
- 3.4. Market Trends
- 3.4.1. Implantable Cardiac Pacemaker is Expected to Witness Healthy Growth Over the Forecast Period
- 4. Market Factor Analysis
- 4.1. Porters Five Forces
- 4.2. Supply/Value Chain
- 4.3. PESTEL analysis
- 4.4. Market Entropy
- 4.5. Patent/Trademark Analysis
- 5. Global Active Implantable Medical Devices Market Analysis, Insights and Forecast, 2019-2031
- 5.1. Market Analysis, Insights and Forecast - by Product
- 5.1.1. Implantable Cardioverter Defibrillators
- 5.1.2. Implantable Cardiac Pacemakers
- 5.1.3. Ventricular Assist Devices
- 5.1.4. Implanta
- 5.1.5. Neurostimulators
- 5.1.6. Implantable Hearing Devices
- 5.1.7. Others
- 5.2. Market Analysis, Insights and Forecast - by Region
- 5.2.1. North America
- 5.2.2. Europe
- 5.2.3. Asia Pacific
- 5.2.4. Middle East and Africa
- 5.2.5. South America
- 5.1. Market Analysis, Insights and Forecast - by Product
- 6. North America Active Implantable Medical Devices Market Analysis, Insights and Forecast, 2019-2031
- 6.1. Market Analysis, Insights and Forecast - by Product
- 6.1.1. Implantable Cardioverter Defibrillators
- 6.1.2. Implantable Cardiac Pacemakers
- 6.1.3. Ventricular Assist Devices
- 6.1.4. Implanta
- 6.1.5. Neurostimulators
- 6.1.6. Implantable Hearing Devices
- 6.1.7. Others
- 6.1. Market Analysis, Insights and Forecast - by Product
- 7. Europe Active Implantable Medical Devices Market Analysis, Insights and Forecast, 2019-2031
- 7.1. Market Analysis, Insights and Forecast - by Product
- 7.1.1. Implantable Cardioverter Defibrillators
- 7.1.2. Implantable Cardiac Pacemakers
- 7.1.3. Ventricular Assist Devices
- 7.1.4. Implanta
- 7.1.5. Neurostimulators
- 7.1.6. Implantable Hearing Devices
- 7.1.7. Others
- 7.1. Market Analysis, Insights and Forecast - by Product
- 8. Asia Pacific Active Implantable Medical Devices Market Analysis, Insights and Forecast, 2019-2031
- 8.1. Market Analysis, Insights and Forecast - by Product
- 8.1.1. Implantable Cardioverter Defibrillators
- 8.1.2. Implantable Cardiac Pacemakers
- 8.1.3. Ventricular Assist Devices
- 8.1.4. Implanta
- 8.1.5. Neurostimulators
- 8.1.6. Implantable Hearing Devices
- 8.1.7. Others
- 8.1. Market Analysis, Insights and Forecast - by Product
- 9. Middle East and Africa Active Implantable Medical Devices Market Analysis, Insights and Forecast, 2019-2031
- 9.1. Market Analysis, Insights and Forecast - by Product
- 9.1.1. Implantable Cardioverter Defibrillators
- 9.1.2. Implantable Cardiac Pacemakers
- 9.1.3. Ventricular Assist Devices
- 9.1.4. Implanta
- 9.1.5. Neurostimulators
- 9.1.6. Implantable Hearing Devices
- 9.1.7. Others
- 9.1. Market Analysis, Insights and Forecast - by Product
- 10. South America Active Implantable Medical Devices Market Analysis, Insights and Forecast, 2019-2031
- 10.1. Market Analysis, Insights and Forecast - by Product
- 10.1.1. Implantable Cardioverter Defibrillators
- 10.1.2. Implantable Cardiac Pacemakers
- 10.1.3. Ventricular Assist Devices
- 10.1.4. Implanta
- 10.1.5. Neurostimulators
- 10.1.6. Implantable Hearing Devices
- 10.1.7. Others
- 10.1. Market Analysis, Insights and Forecast - by Product
- 11. North America Active Implantable Medical Devices Market Analysis, Insights and Forecast, 2019-2031
- 11.1. Market Analysis, Insights and Forecast - By Country/Sub-region
- 11.1.1 United States
- 11.1.2 Canada
- 11.1.3 Mexico
- 12. South America Active Implantable Medical Devices Market Analysis, Insights and Forecast, 2019-2031
- 12.1. Market Analysis, Insights and Forecast - By Country/Sub-region
- 12.1.1 Brazil
- 12.1.2 Mexico
- 12.1.3 Rest of South America
- 13. Europe Active Implantable Medical Devices Market Analysis, Insights and Forecast, 2019-2031
- 13.1. Market Analysis, Insights and Forecast - By Country/Sub-region
- 13.1.1 United Kingdom
- 13.1.2 Germany
- 13.1.3 France
- 13.1.4 Italy
- 13.1.5 Spain
- 13.1.6 Russia
- 13.1.7 Rest of Europe
- 14. Asia Pacific Active Implantable Medical Devices Market Analysis, Insights and Forecast, 2019-2031
- 14.1. Market Analysis, Insights and Forecast - By Country/Sub-region
- 14.1.1 China
- 14.1.2 Japan
- 14.1.3 India
- 14.1.4 South Korea
- 14.1.5 Taiwan
- 14.1.6 Australia
- 14.1.7 Rest of Asia-Pacific
- 15. MEA Active Implantable Medical Devices Market Analysis, Insights and Forecast, 2019-2031
- 15.1. Market Analysis, Insights and Forecast - By Country/Sub-region
- 15.1.1 Middle East
- 15.1.2 Africa
- 16. Competitive Analysis
- 16.1. Global Market Share Analysis 2024
- 16.2. Company Profiles
- 16.2.1 Biotronik Se & Co Kg
- 16.2.1.1. Overview
- 16.2.1.2. Products
- 16.2.1.3. SWOT Analysis
- 16.2.1.4. Recent Developments
- 16.2.1.5. Financials (Based on Availability)
- 16.2.2 Smith & Nephew
- 16.2.2.1. Overview
- 16.2.2.2. Products
- 16.2.2.3. SWOT Analysis
- 16.2.2.4. Recent Developments
- 16.2.2.5. Financials (Based on Availability)
- 16.2.3 Med-EL
- 16.2.3.1. Overview
- 16.2.3.2. Products
- 16.2.3.3. SWOT Analysis
- 16.2.3.4. Recent Developments
- 16.2.3.5. Financials (Based on Availability)
- 16.2.4 Abbott Laboratories
- 16.2.4.1. Overview
- 16.2.4.2. Products
- 16.2.4.3. SWOT Analysis
- 16.2.4.4. Recent Developments
- 16.2.4.5. Financials (Based on Availability)
- 16.2.5 Medtronic PLC
- 16.2.5.1. Overview
- 16.2.5.2. Products
- 16.2.5.3. SWOT Analysis
- 16.2.5.4. Recent Developments
- 16.2.5.5. Financials (Based on Availability)
- 16.2.6 Sonova Holding AG
- 16.2.6.1. Overview
- 16.2.6.2. Products
- 16.2.6.3. SWOT Analysis
- 16.2.6.4. Recent Developments
- 16.2.6.5. Financials (Based on Availability)
- 16.2.7 Stryker Corporation*List Not Exhaustive
- 16.2.7.1. Overview
- 16.2.7.2. Products
- 16.2.7.3. SWOT Analysis
- 16.2.7.4. Recent Developments
- 16.2.7.5. Financials (Based on Availability)
- 16.2.8 Johnson & Johnson Services Inc
- 16.2.8.1. Overview
- 16.2.8.2. Products
- 16.2.8.3. SWOT Analysis
- 16.2.8.4. Recent Developments
- 16.2.8.5. Financials (Based on Availability)
- 16.2.9 Livanova PLC
- 16.2.9.1. Overview
- 16.2.9.2. Products
- 16.2.9.3. SWOT Analysis
- 16.2.9.4. Recent Developments
- 16.2.9.5. Financials (Based on Availability)
- 16.2.10 Boston Scientific Corporation
- 16.2.10.1. Overview
- 16.2.10.2. Products
- 16.2.10.3. SWOT Analysis
- 16.2.10.4. Recent Developments
- 16.2.10.5. Financials (Based on Availability)
- 16.2.11 Cochlear Limited
- 16.2.11.1. Overview
- 16.2.11.2. Products
- 16.2.11.3. SWOT Analysis
- 16.2.11.4. Recent Developments
- 16.2.11.5. Financials (Based on Availability)
- 16.2.12 Nurotron Biotechnology Co Ltd
- 16.2.12.1. Overview
- 16.2.12.2. Products
- 16.2.12.3. SWOT Analysis
- 16.2.12.4. Recent Developments
- 16.2.12.5. Financials (Based on Availability)
- 16.2.1 Biotronik Se & Co Kg
List of Figures
- Figure 1: Global Active Implantable Medical Devices Market Revenue Breakdown (Billion, %) by Region 2024 & 2032
- Figure 2: Global Active Implantable Medical Devices Market Volume Breakdown (K Units, %) by Region 2024 & 2032
- Figure 3: North America Active Implantable Medical Devices Market Revenue (Billion), by Country 2024 & 2032
- Figure 4: North America Active Implantable Medical Devices Market Volume (K Units), by Country 2024 & 2032
- Figure 5: North America Active Implantable Medical Devices Market Revenue Share (%), by Country 2024 & 2032
- Figure 6: North America Active Implantable Medical Devices Market Volume Share (%), by Country 2024 & 2032
- Figure 7: South America Active Implantable Medical Devices Market Revenue (Billion), by Country 2024 & 2032
- Figure 8: South America Active Implantable Medical Devices Market Volume (K Units), by Country 2024 & 2032
- Figure 9: South America Active Implantable Medical Devices Market Revenue Share (%), by Country 2024 & 2032
- Figure 10: South America Active Implantable Medical Devices Market Volume Share (%), by Country 2024 & 2032
- Figure 11: Europe Active Implantable Medical Devices Market Revenue (Billion), by Country 2024 & 2032
- Figure 12: Europe Active Implantable Medical Devices Market Volume (K Units), by Country 2024 & 2032
- Figure 13: Europe Active Implantable Medical Devices Market Revenue Share (%), by Country 2024 & 2032
- Figure 14: Europe Active Implantable Medical Devices Market Volume Share (%), by Country 2024 & 2032
- Figure 15: Asia Pacific Active Implantable Medical Devices Market Revenue (Billion), by Country 2024 & 2032
- Figure 16: Asia Pacific Active Implantable Medical Devices Market Volume (K Units), by Country 2024 & 2032
- Figure 17: Asia Pacific Active Implantable Medical Devices Market Revenue Share (%), by Country 2024 & 2032
- Figure 18: Asia Pacific Active Implantable Medical Devices Market Volume Share (%), by Country 2024 & 2032
- Figure 19: MEA Active Implantable Medical Devices Market Revenue (Billion), by Country 2024 & 2032
- Figure 20: MEA Active Implantable Medical Devices Market Volume (K Units), by Country 2024 & 2032
- Figure 21: MEA Active Implantable Medical Devices Market Revenue Share (%), by Country 2024 & 2032
- Figure 22: MEA Active Implantable Medical Devices Market Volume Share (%), by Country 2024 & 2032
- Figure 23: North America Active Implantable Medical Devices Market Revenue (Billion), by Product 2024 & 2032
- Figure 24: North America Active Implantable Medical Devices Market Volume (K Units), by Product 2024 & 2032
- Figure 25: North America Active Implantable Medical Devices Market Revenue Share (%), by Product 2024 & 2032
- Figure 26: North America Active Implantable Medical Devices Market Volume Share (%), by Product 2024 & 2032
- Figure 27: North America Active Implantable Medical Devices Market Revenue (Billion), by Country 2024 & 2032
- Figure 28: North America Active Implantable Medical Devices Market Volume (K Units), by Country 2024 & 2032
- Figure 29: North America Active Implantable Medical Devices Market Revenue Share (%), by Country 2024 & 2032
- Figure 30: North America Active Implantable Medical Devices Market Volume Share (%), by Country 2024 & 2032
- Figure 31: Europe Active Implantable Medical Devices Market Revenue (Billion), by Product 2024 & 2032
- Figure 32: Europe Active Implantable Medical Devices Market Volume (K Units), by Product 2024 & 2032
- Figure 33: Europe Active Implantable Medical Devices Market Revenue Share (%), by Product 2024 & 2032
- Figure 34: Europe Active Implantable Medical Devices Market Volume Share (%), by Product 2024 & 2032
- Figure 35: Europe Active Implantable Medical Devices Market Revenue (Billion), by Country 2024 & 2032
- Figure 36: Europe Active Implantable Medical Devices Market Volume (K Units), by Country 2024 & 2032
- Figure 37: Europe Active Implantable Medical Devices Market Revenue Share (%), by Country 2024 & 2032
- Figure 38: Europe Active Implantable Medical Devices Market Volume Share (%), by Country 2024 & 2032
- Figure 39: Asia Pacific Active Implantable Medical Devices Market Revenue (Billion), by Product 2024 & 2032
- Figure 40: Asia Pacific Active Implantable Medical Devices Market Volume (K Units), by Product 2024 & 2032
- Figure 41: Asia Pacific Active Implantable Medical Devices Market Revenue Share (%), by Product 2024 & 2032
- Figure 42: Asia Pacific Active Implantable Medical Devices Market Volume Share (%), by Product 2024 & 2032
- Figure 43: Asia Pacific Active Implantable Medical Devices Market Revenue (Billion), by Country 2024 & 2032
- Figure 44: Asia Pacific Active Implantable Medical Devices Market Volume (K Units), by Country 2024 & 2032
- Figure 45: Asia Pacific Active Implantable Medical Devices Market Revenue Share (%), by Country 2024 & 2032
- Figure 46: Asia Pacific Active Implantable Medical Devices Market Volume Share (%), by Country 2024 & 2032
- Figure 47: Middle East and Africa Active Implantable Medical Devices Market Revenue (Billion), by Product 2024 & 2032
- Figure 48: Middle East and Africa Active Implantable Medical Devices Market Volume (K Units), by Product 2024 & 2032
- Figure 49: Middle East and Africa Active Implantable Medical Devices Market Revenue Share (%), by Product 2024 & 2032
- Figure 50: Middle East and Africa Active Implantable Medical Devices Market Volume Share (%), by Product 2024 & 2032
- Figure 51: Middle East and Africa Active Implantable Medical Devices Market Revenue (Billion), by Country 2024 & 2032
- Figure 52: Middle East and Africa Active Implantable Medical Devices Market Volume (K Units), by Country 2024 & 2032
- Figure 53: Middle East and Africa Active Implantable Medical Devices Market Revenue Share (%), by Country 2024 & 2032
- Figure 54: Middle East and Africa Active Implantable Medical Devices Market Volume Share (%), by Country 2024 & 2032
- Figure 55: South America Active Implantable Medical Devices Market Revenue (Billion), by Product 2024 & 2032
- Figure 56: South America Active Implantable Medical Devices Market Volume (K Units), by Product 2024 & 2032
- Figure 57: South America Active Implantable Medical Devices Market Revenue Share (%), by Product 2024 & 2032
- Figure 58: South America Active Implantable Medical Devices Market Volume Share (%), by Product 2024 & 2032
- Figure 59: South America Active Implantable Medical Devices Market Revenue (Billion), by Country 2024 & 2032
- Figure 60: South America Active Implantable Medical Devices Market Volume (K Units), by Country 2024 & 2032
- Figure 61: South America Active Implantable Medical Devices Market Revenue Share (%), by Country 2024 & 2032
- Figure 62: South America Active Implantable Medical Devices Market Volume Share (%), by Country 2024 & 2032
List of Tables
- Table 1: Global Active Implantable Medical Devices Market Revenue Billion Forecast, by Region 2019 & 2032
- Table 2: Global Active Implantable Medical Devices Market Volume K Units Forecast, by Region 2019 & 2032
- Table 3: Global Active Implantable Medical Devices Market Revenue Billion Forecast, by Product 2019 & 2032
- Table 4: Global Active Implantable Medical Devices Market Volume K Units Forecast, by Product 2019 & 2032
- Table 5: Global Active Implantable Medical Devices Market Revenue Billion Forecast, by Region 2019 & 2032
- Table 6: Global Active Implantable Medical Devices Market Volume K Units Forecast, by Region 2019 & 2032
- Table 7: Global Active Implantable Medical Devices Market Revenue Billion Forecast, by Country 2019 & 2032
- Table 8: Global Active Implantable Medical Devices Market Volume K Units Forecast, by Country 2019 & 2032
- Table 9: United States Active Implantable Medical Devices Market Revenue (Billion) Forecast, by Application 2019 & 2032
- Table 10: United States Active Implantable Medical Devices Market Volume (K Units) Forecast, by Application 2019 & 2032
- Table 11: Canada Active Implantable Medical Devices Market Revenue (Billion) Forecast, by Application 2019 & 2032
- Table 12: Canada Active Implantable Medical Devices Market Volume (K Units) Forecast, by Application 2019 & 2032
- Table 13: Mexico Active Implantable Medical Devices Market Revenue (Billion) Forecast, by Application 2019 & 2032
- Table 14: Mexico Active Implantable Medical Devices Market Volume (K Units) Forecast, by Application 2019 & 2032
- Table 15: Global Active Implantable Medical Devices Market Revenue Billion Forecast, by Country 2019 & 2032
- Table 16: Global Active Implantable Medical Devices Market Volume K Units Forecast, by Country 2019 & 2032
- Table 17: Brazil Active Implantable Medical Devices Market Revenue (Billion) Forecast, by Application 2019 & 2032
- Table 18: Brazil Active Implantable Medical Devices Market Volume (K Units) Forecast, by Application 2019 & 2032
- Table 19: Mexico Active Implantable Medical Devices Market Revenue (Billion) Forecast, by Application 2019 & 2032
- Table 20: Mexico Active Implantable Medical Devices Market Volume (K Units) Forecast, by Application 2019 & 2032
- Table 21: Rest of South America Active Implantable Medical Devices Market Revenue (Billion) Forecast, by Application 2019 & 2032
- Table 22: Rest of South America Active Implantable Medical Devices Market Volume (K Units) Forecast, by Application 2019 & 2032
- Table 23: Global Active Implantable Medical Devices Market Revenue Billion Forecast, by Country 2019 & 2032
- Table 24: Global Active Implantable Medical Devices Market Volume K Units Forecast, by Country 2019 & 2032
- Table 25: United Kingdom Active Implantable Medical Devices Market Revenue (Billion) Forecast, by Application 2019 & 2032
- Table 26: United Kingdom Active Implantable Medical Devices Market Volume (K Units) Forecast, by Application 2019 & 2032
- Table 27: Germany Active Implantable Medical Devices Market Revenue (Billion) Forecast, by Application 2019 & 2032
- Table 28: Germany Active Implantable Medical Devices Market Volume (K Units) Forecast, by Application 2019 & 2032
- Table 29: France Active Implantable Medical Devices Market Revenue (Billion) Forecast, by Application 2019 & 2032
- Table 30: France Active Implantable Medical Devices Market Volume (K Units) Forecast, by Application 2019 & 2032
- Table 31: Italy Active Implantable Medical Devices Market Revenue (Billion) Forecast, by Application 2019 & 2032
- Table 32: Italy Active Implantable Medical Devices Market Volume (K Units) Forecast, by Application 2019 & 2032
- Table 33: Spain Active Implantable Medical Devices Market Revenue (Billion) Forecast, by Application 2019 & 2032
- Table 34: Spain Active Implantable Medical Devices Market Volume (K Units) Forecast, by Application 2019 & 2032
- Table 35: Russia Active Implantable Medical Devices Market Revenue (Billion) Forecast, by Application 2019 & 2032
- Table 36: Russia Active Implantable Medical Devices Market Volume (K Units) Forecast, by Application 2019 & 2032
- Table 37: Rest of Europe Active Implantable Medical Devices Market Revenue (Billion) Forecast, by Application 2019 & 2032
- Table 38: Rest of Europe Active Implantable Medical Devices Market Volume (K Units) Forecast, by Application 2019 & 2032
- Table 39: Global Active Implantable Medical Devices Market Revenue Billion Forecast, by Country 2019 & 2032
- Table 40: Global Active Implantable Medical Devices Market Volume K Units Forecast, by Country 2019 & 2032
- Table 41: China Active Implantable Medical Devices Market Revenue (Billion) Forecast, by Application 2019 & 2032
- Table 42: China Active Implantable Medical Devices Market Volume (K Units) Forecast, by Application 2019 & 2032
- Table 43: Japan Active Implantable Medical Devices Market Revenue (Billion) Forecast, by Application 2019 & 2032
- Table 44: Japan Active Implantable Medical Devices Market Volume (K Units) Forecast, by Application 2019 & 2032
- Table 45: India Active Implantable Medical Devices Market Revenue (Billion) Forecast, by Application 2019 & 2032
- Table 46: India Active Implantable Medical Devices Market Volume (K Units) Forecast, by Application 2019 & 2032
- Table 47: South Korea Active Implantable Medical Devices Market Revenue (Billion) Forecast, by Application 2019 & 2032
- Table 48: South Korea Active Implantable Medical Devices Market Volume (K Units) Forecast, by Application 2019 & 2032
- Table 49: Taiwan Active Implantable Medical Devices Market Revenue (Billion) Forecast, by Application 2019 & 2032
- Table 50: Taiwan Active Implantable Medical Devices Market Volume (K Units) Forecast, by Application 2019 & 2032
- Table 51: Australia Active Implantable Medical Devices Market Revenue (Billion) Forecast, by Application 2019 & 2032
- Table 52: Australia Active Implantable Medical Devices Market Volume (K Units) Forecast, by Application 2019 & 2032
- Table 53: Rest of Asia-Pacific Active Implantable Medical Devices Market Revenue (Billion) Forecast, by Application 2019 & 2032
- Table 54: Rest of Asia-Pacific Active Implantable Medical Devices Market Volume (K Units) Forecast, by Application 2019 & 2032
- Table 55: Global Active Implantable Medical Devices Market Revenue Billion Forecast, by Country 2019 & 2032
- Table 56: Global Active Implantable Medical Devices Market Volume K Units Forecast, by Country 2019 & 2032
- Table 57: Middle East Active Implantable Medical Devices Market Revenue (Billion) Forecast, by Application 2019 & 2032
- Table 58: Middle East Active Implantable Medical Devices Market Volume (K Units) Forecast, by Application 2019 & 2032
- Table 59: Africa Active Implantable Medical Devices Market Revenue (Billion) Forecast, by Application 2019 & 2032
- Table 60: Africa Active Implantable Medical Devices Market Volume (K Units) Forecast, by Application 2019 & 2032
- Table 61: Global Active Implantable Medical Devices Market Revenue Billion Forecast, by Product 2019 & 2032
- Table 62: Global Active Implantable Medical Devices Market Volume K Units Forecast, by Product 2019 & 2032
- Table 63: Global Active Implantable Medical Devices Market Revenue Billion Forecast, by Country 2019 & 2032
- Table 64: Global Active Implantable Medical Devices Market Volume K Units Forecast, by Country 2019 & 2032
- Table 65: United States Active Implantable Medical Devices Market Revenue (Billion) Forecast, by Application 2019 & 2032
- Table 66: United States Active Implantable Medical Devices Market Volume (K Units) Forecast, by Application 2019 & 2032
- Table 67: Canada Active Implantable Medical Devices Market Revenue (Billion) Forecast, by Application 2019 & 2032
- Table 68: Canada Active Implantable Medical Devices Market Volume (K Units) Forecast, by Application 2019 & 2032
- Table 69: Mexico Active Implantable Medical Devices Market Revenue (Billion) Forecast, by Application 2019 & 2032
- Table 70: Mexico Active Implantable Medical Devices Market Volume (K Units) Forecast, by Application 2019 & 2032
- Table 71: Global Active Implantable Medical Devices Market Revenue Billion Forecast, by Product 2019 & 2032
- Table 72: Global Active Implantable Medical Devices Market Volume K Units Forecast, by Product 2019 & 2032
- Table 73: Global Active Implantable Medical Devices Market Revenue Billion Forecast, by Country 2019 & 2032
- Table 74: Global Active Implantable Medical Devices Market Volume K Units Forecast, by Country 2019 & 2032
- Table 75: Germany Active Implantable Medical Devices Market Revenue (Billion) Forecast, by Application 2019 & 2032
- Table 76: Germany Active Implantable Medical Devices Market Volume (K Units) Forecast, by Application 2019 & 2032
- Table 77: United Kingdom Active Implantable Medical Devices Market Revenue (Billion) Forecast, by Application 2019 & 2032
- Table 78: United Kingdom Active Implantable Medical Devices Market Volume (K Units) Forecast, by Application 2019 & 2032
- Table 79: France Active Implantable Medical Devices Market Revenue (Billion) Forecast, by Application 2019 & 2032
- Table 80: France Active Implantable Medical Devices Market Volume (K Units) Forecast, by Application 2019 & 2032
- Table 81: Italy Active Implantable Medical Devices Market Revenue (Billion) Forecast, by Application 2019 & 2032
- Table 82: Italy Active Implantable Medical Devices Market Volume (K Units) Forecast, by Application 2019 & 2032
- Table 83: Spain Active Implantable Medical Devices Market Revenue (Billion) Forecast, by Application 2019 & 2032
- Table 84: Spain Active Implantable Medical Devices Market Volume (K Units) Forecast, by Application 2019 & 2032
- Table 85: Rest of Europe Active Implantable Medical Devices Market Revenue (Billion) Forecast, by Application 2019 & 2032
- Table 86: Rest of Europe Active Implantable Medical Devices Market Volume (K Units) Forecast, by Application 2019 & 2032
- Table 87: Global Active Implantable Medical Devices Market Revenue Billion Forecast, by Product 2019 & 2032
- Table 88: Global Active Implantable Medical Devices Market Volume K Units Forecast, by Product 2019 & 2032
- Table 89: Global Active Implantable Medical Devices Market Revenue Billion Forecast, by Country 2019 & 2032
- Table 90: Global Active Implantable Medical Devices Market Volume K Units Forecast, by Country 2019 & 2032
- Table 91: China Active Implantable Medical Devices Market Revenue (Billion) Forecast, by Application 2019 & 2032
- Table 92: China Active Implantable Medical Devices Market Volume (K Units) Forecast, by Application 2019 & 2032
- Table 93: Japan Active Implantable Medical Devices Market Revenue (Billion) Forecast, by Application 2019 & 2032
- Table 94: Japan Active Implantable Medical Devices Market Volume (K Units) Forecast, by Application 2019 & 2032
- Table 95: India Active Implantable Medical Devices Market Revenue (Billion) Forecast, by Application 2019 & 2032
- Table 96: India Active Implantable Medical Devices Market Volume (K Units) Forecast, by Application 2019 & 2032
- Table 97: Australia Active Implantable Medical Devices Market Revenue (Billion) Forecast, by Application 2019 & 2032
- Table 98: Australia Active Implantable Medical Devices Market Volume (K Units) Forecast, by Application 2019 & 2032
- Table 99: South Korea Active Implantable Medical Devices Market Revenue (Billion) Forecast, by Application 2019 & 2032
- Table 100: South Korea Active Implantable Medical Devices Market Volume (K Units) Forecast, by Application 2019 & 2032
- Table 101: Rest of Asia Pacific Active Implantable Medical Devices Market Revenue (Billion) Forecast, by Application 2019 & 2032
- Table 102: Rest of Asia Pacific Active Implantable Medical Devices Market Volume (K Units) Forecast, by Application 2019 & 2032
- Table 103: Global Active Implantable Medical Devices Market Revenue Billion Forecast, by Product 2019 & 2032
- Table 104: Global Active Implantable Medical Devices Market Volume K Units Forecast, by Product 2019 & 2032
- Table 105: Global Active Implantable Medical Devices Market Revenue Billion Forecast, by Country 2019 & 2032
- Table 106: Global Active Implantable Medical Devices Market Volume K Units Forecast, by Country 2019 & 2032
- Table 107: GCC Active Implantable Medical Devices Market Revenue (Billion) Forecast, by Application 2019 & 2032
- Table 108: GCC Active Implantable Medical Devices Market Volume (K Units) Forecast, by Application 2019 & 2032
- Table 109: South Africa Active Implantable Medical Devices Market Revenue (Billion) Forecast, by Application 2019 & 2032
- Table 110: South Africa Active Implantable Medical Devices Market Volume (K Units) Forecast, by Application 2019 & 2032
- Table 111: Rest of Middle East and Africa Active Implantable Medical Devices Market Revenue (Billion) Forecast, by Application 2019 & 2032
- Table 112: Rest of Middle East and Africa Active Implantable Medical Devices Market Volume (K Units) Forecast, by Application 2019 & 2032
- Table 113: Global Active Implantable Medical Devices Market Revenue Billion Forecast, by Product 2019 & 2032
- Table 114: Global Active Implantable Medical Devices Market Volume K Units Forecast, by Product 2019 & 2032
- Table 115: Global Active Implantable Medical Devices Market Revenue Billion Forecast, by Country 2019 & 2032
- Table 116: Global Active Implantable Medical Devices Market Volume K Units Forecast, by Country 2019 & 2032
- Table 117: Brazil Active Implantable Medical Devices Market Revenue (Billion) Forecast, by Application 2019 & 2032
- Table 118: Brazil Active Implantable Medical Devices Market Volume (K Units) Forecast, by Application 2019 & 2032
- Table 119: Argentina Active Implantable Medical Devices Market Revenue (Billion) Forecast, by Application 2019 & 2032
- Table 120: Argentina Active Implantable Medical Devices Market Volume (K Units) Forecast, by Application 2019 & 2032
- Table 121: Rest of South America Active Implantable Medical Devices Market Revenue (Billion) Forecast, by Application 2019 & 2032
- Table 122: Rest of South America Active Implantable Medical Devices Market Volume (K Units) Forecast, by Application 2019 & 2032
Frequently Asked Questions
1. What is the projected Compound Annual Growth Rate (CAGR) of the Active Implantable Medical Devices Market?
The projected CAGR is approximately 7.20%.
2. Which companies are prominent players in the Active Implantable Medical Devices Market?
Key companies in the market include Biotronik Se & Co Kg, Smith & Nephew, Med-EL, Abbott Laboratories, Medtronic PLC, Sonova Holding AG, Stryker Corporation*List Not Exhaustive, Johnson & Johnson Services Inc, Livanova PLC, Boston Scientific Corporation, Cochlear Limited, Nurotron Biotechnology Co Ltd.
3. What are the main segments of the Active Implantable Medical Devices Market?
The market segments include Product.
4. Can you provide details about the market size?
The market size is estimated to be USD 28.6 Billion as of 2022.
5. What are some drivers contributing to market growth?
Increasing Burden of Cardiovascular and Neurological Diseases; Investments and Funds to Develop Technologically Advanced Products.
6. What are the notable trends driving market growth?
Implantable Cardiac Pacemaker is Expected to Witness Healthy Growth Over the Forecast Period.
7. Are there any restraints impacting market growth?
Issues Related to the Use of Implantable Medical Devices; High Cost of Implants and Stringent Regulations.
8. Can you provide examples of recent developments in the market?
In August 2022, Medtronic plc launched an investigational extravascular implantable cardioverter defibrillator (EV ICD) system defibrillator with the lead placed under the breastbone, outside of the heart and veins achieved a defibrillation success rate of 98.7%, and met its safety endpoints in a global clinical trial.
9. What pricing options are available for accessing the report?
Pricing options include single-user, multi-user, and enterprise licenses priced at USD 4750, USD 5250, and USD 8750 respectively.
10. Is the market size provided in terms of value or volume?
The market size is provided in terms of value, measured in Billion and volume, measured in K Units.
11. Are there any specific market keywords associated with the report?
Yes, the market keyword associated with the report is "Active Implantable Medical Devices Market," which aids in identifying and referencing the specific market segment covered.
12. How do I determine which pricing option suits my needs best?
The pricing options vary based on user requirements and access needs. Individual users may opt for single-user licenses, while businesses requiring broader access may choose multi-user or enterprise licenses for cost-effective access to the report.
13. Are there any additional resources or data provided in the Active Implantable Medical Devices Market report?
While the report offers comprehensive insights, it's advisable to review the specific contents or supplementary materials provided to ascertain if additional resources or data are available.
14. How can I stay updated on further developments or reports in the Active Implantable Medical Devices Market?
To stay informed about further developments, trends, and reports in the Active Implantable Medical Devices Market, consider subscribing to industry newsletters, following relevant companies and organizations, or regularly checking reputable industry news sources and publications.
Methodology
Step 1 - Identification of Relevant Samples Size from Population Database


Step 2 - Approaches for Defining Global Market Size (Value, Volume* & Price*)

Note*: In applicable scenarios
Step 3 - Data Sources
Primary Research
- Web Analytics
- Survey Reports
- Research Institute
- Latest Research Reports
- Opinion Leaders
Secondary Research
- Annual Reports
- White Paper
- Latest Press Release
- Industry Association
- Paid Database
- Investor Presentations

Step 4 - Data Triangulation
Involves using different sources of information in order to increase the validity of a study
These sources are likely to be stakeholders in a program - participants, other researchers, program staff, other community members, and so on.
Then we put all data in single framework & apply various statistical tools to find out the dynamic on the market.
During the analysis stage, feedback from the stakeholder groups would be compared to determine areas of agreement as well as areas of divergence


