
Key Insights
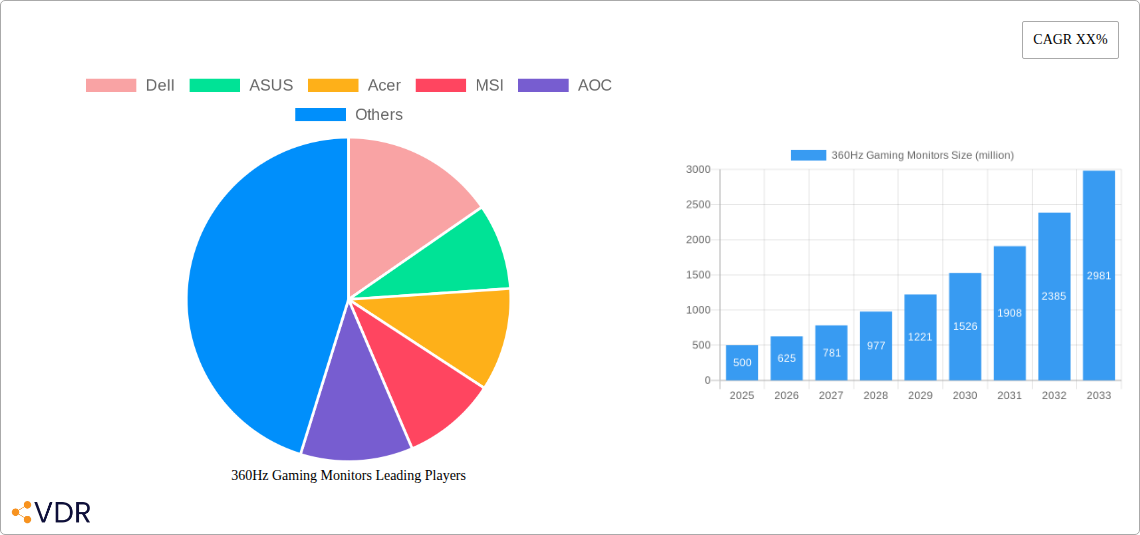
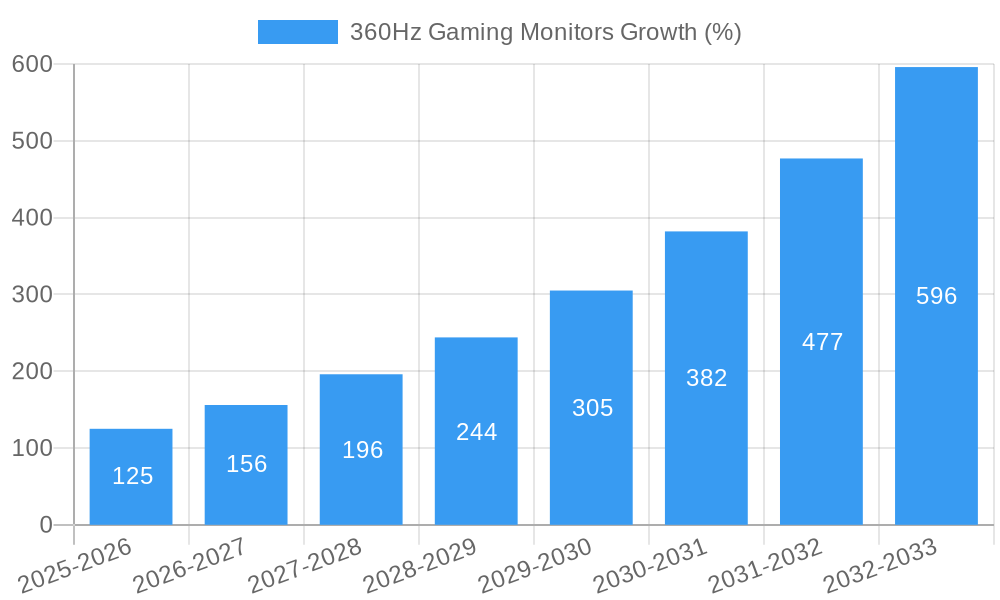
The 360Hz gaming monitor market is experiencing robust growth, driven by the increasing popularity of competitive esports and the demand for superior visual performance in high-frame-rate gaming. The market, estimated at $500 million in 2025, is projected to exhibit a Compound Annual Growth Rate (CAGR) of 25% from 2025 to 2033. This significant expansion is fueled by several key factors. Firstly, advancements in display technology are making 360Hz monitors more accessible and affordable. Secondly, the rising number of professional and amateur gamers actively seeking a competitive edge is creating strong demand. Thirdly, the increasing adoption of high-refresh-rate capable graphics cards ensures that these monitors can be fully utilized, further stimulating market growth. Leading brands like Dell, ASUS, Acer, MSI, and AOC are heavily invested in this segment, constantly innovating to deliver superior features and performance at different price points.
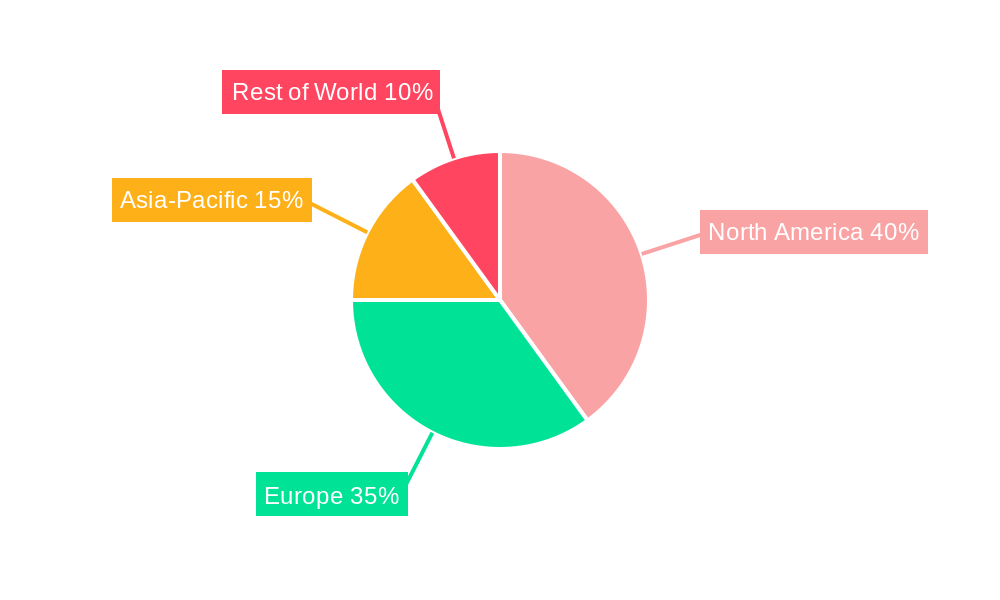
However, the market also faces some restraints. The high price point of 360Hz monitors compared to standard gaming monitors limits accessibility for budget-conscious consumers. Additionally, the perceived marginal benefit of a 360Hz refresh rate over a 240Hz refresh rate for some gamers might hinder wider adoption. Despite these challenges, the ongoing technological advancements and growing demand from the esports community are expected to outweigh these limitations, ensuring continued market expansion throughout the forecast period. Market segmentation is primarily based on screen size, resolution, panel type (e.g., TN, IPS), and features such as adaptive sync technology (G-Sync, FreeSync). Regional data shows a strong concentration of demand in North America and Europe, with Asia-Pacific emerging as a significant growth area in the coming years.
360Hz Gaming Monitors Market Report: 2019-2033
This comprehensive report provides an in-depth analysis of the global 360Hz gaming monitor market, encompassing historical data (2019-2024), current estimations (2025), and future projections (2025-2033). The study focuses on market dynamics, growth trends, regional dominance, product landscape, key players (including Dell, ASUS, Acer, MSI, and AOC), and emerging opportunities within the parent market of gaming peripherals and the child market of high-refresh-rate displays. This report is invaluable for industry professionals, investors, and strategic decision-makers seeking a comprehensive understanding of this rapidly evolving market segment.
360Hz Gaming Monitors Market Dynamics & Structure
The 360Hz gaming monitor market is characterized by moderate concentration, with key players holding significant market share. Technological innovation, driven by advancements in panel technology and display processing, is a major driver. Regulatory frameworks concerning electronic waste and energy efficiency also influence the market. Competitive substitutes include high-refresh-rate monitors with lower refresh rates (e.g., 240Hz) and curved gaming monitors. The end-user demographic is primarily young, tech-savvy gamers with high disposable income. M&A activity in this sector has been relatively low (xx million USD in deals during the historical period), reflecting a focus on organic growth and technological advancement.
- Market Concentration: Moderately concentrated, with top 5 players holding approximately 70% market share in 2025.
- Technological Innovation: Rapid advancements in display panel technology (e.g., faster response times, improved color accuracy) are key drivers.
- Regulatory Framework: Compliance with energy efficiency standards and e-waste regulations impacts production and pricing.
- Competitive Substitutes: 240Hz and curved monitors offer competition, especially at lower price points.
- End-User Demographics: Primarily young, male gamers aged 18-35 with a high interest in competitive gaming.
- M&A Activity: Low volume during 2019-2024 (xx million USD), with a focus on internal R&D.
360Hz Gaming Monitors Growth Trends & Insights
The global 360Hz gaming monitor market experienced significant growth during the historical period (2019-2024), driven by increasing demand for competitive advantage in esports and a rising preference for immersive gaming experiences. The market size reached xx million units in 2024, exhibiting a Compound Annual Growth Rate (CAGR) of xx% during this period. The adoption rate has been particularly high in North America and East Asia. Technological advancements like improved panel response times and reduced motion blur have further accelerated market penetration. Shifting consumer preferences towards higher refresh rates and smoother gameplay are key factors. We project a continued, albeit slightly moderated, growth trajectory for the forecast period (2025-2033), with a projected CAGR of xx% and a market size reaching xx million units by 2033. This moderation reflects market saturation in key regions and potential price sensitivity among consumers.
Dominant Regions, Countries, or Segments in 360Hz Gaming Monitors
North America and East Asia currently dominate the 360Hz gaming monitor market, accounting for approximately 75% of global sales in 2025. This dominance is fueled by several factors:
- North America: Strong gaming culture, high disposable incomes, and early adoption of advanced technologies.
- East Asia: Large and rapidly growing gaming market, significant manufacturing capabilities, and supportive government policies promoting technological advancement.
- Other Regions: Europe and other parts of Asia are witnessing increasing growth, but at a slower pace compared to North America and East Asia.
The high-end gaming segment, characterized by premium features and pricing, drives the majority of market growth, while the budget segment is showing slower growth.
360Hz Gaming Monitors Product Landscape
360Hz gaming monitors are characterized by their ultra-high refresh rates, low response times (typically 1ms), and advanced panel technologies like IPS and TN. These features deliver incredibly smooth and responsive gameplay, minimizing motion blur and input lag. Key selling propositions include superior competitive advantage in esports, immersive gaming experiences, and reduced eye strain. Recent innovations focus on improving color accuracy, HDR support, and integration with adaptive sync technologies like G-Sync and FreeSync.
Key Drivers, Barriers & Challenges in 360Hz Gaming Monitors
Key Drivers:
- Esports Growth: The rising popularity of esports fuels demand for high-performance displays.
- Technological Advancements: Continuous improvements in panel technology reduce costs and enhance performance.
- Consumer Demand: Gamers are increasingly seeking better visual fidelity and smoother gameplay.
Challenges and Restraints:
- High Price Point: The cost of these monitors remains relatively high, limiting their accessibility to a niche market segment.
- Limited Availability: Production capacity constraints can impact supply.
- Competition: 240Hz and other high-refresh-rate monitors offer compelling alternatives at lower prices.
- Supply Chain Disruptions: Global events can impact the availability of key components.
Emerging Opportunities in 360Hz Gaming Monitors
- Expansion into Developing Markets: Growing gaming communities in emerging economies present significant opportunities.
- Development of More Affordable Models: Reducing costs through technological advancements will broaden market appeal.
- Integration with VR/AR Technologies: 360Hz displays can enhance the experience of virtual and augmented reality applications.
Growth Accelerators in the 360Hz Gaming Monitors Industry
Continued technological breakthroughs in panel production, leading to reduced manufacturing costs and improved performance, will be a key catalyst for long-term growth. Strategic partnerships between monitor manufacturers and PC component providers, facilitating seamless integration of hardware and software, will further drive market expansion. Furthermore, aggressive marketing strategies targeting both casual and competitive gamers are crucial for sustained growth.
Key Players Shaping the 360Hz Gaming Monitors Market
Notable Milestones in 360Hz Gaming Monitors Sector
- 2020: First commercially available 360Hz gaming monitors launched by several major brands.
- 2022: Significant improvements in panel response times and color accuracy.
- 2023: Increased adoption of HDR support and integration of adaptive sync technologies.
- 2024: Introduction of more affordable 360Hz models targeting a wider audience.
In-Depth 360Hz Gaming Monitors Market Outlook
The 360Hz gaming monitor market is poised for continued growth, driven by technological innovation, expanding adoption in key regions, and increasing demand from a growing number of gamers. Future opportunities lie in developing more affordable and accessible models, expanding into new market segments, and integrating these displays with next-generation gaming and VR/AR technologies. Strategic partnerships and aggressive marketing efforts will be key to capturing the projected substantial market expansion over the forecast period.
360Hz Gaming Monitors Segmentation
-
1. Application
- 1.1. Online Sales
- 1.2. Offline Sales
-
2. Types
- 2.1. Response Time 0.3ms GTG
- 2.2. Response Time 0.5ms GTG
- 2.3. Response Time 1ms GTG
- 2.4. Other
360Hz Gaming Monitors Segmentation By Geography
-
1. North America
- 1.1. United States
- 1.2. Canada
- 1.3. Mexico
-
2. South America
- 2.1. Brazil
- 2.2. Argentina
- 2.3. Rest of South America
-
3. Europe
- 3.1. United Kingdom
- 3.2. Germany
- 3.3. France
- 3.4. Italy
- 3.5. Spain
- 3.6. Russia
- 3.7. Benelux
- 3.8. Nordics
- 3.9. Rest of Europe
-
4. Middle East & Africa
- 4.1. Turkey
- 4.2. Israel
- 4.3. GCC
- 4.4. North Africa
- 4.5. South Africa
- 4.6. Rest of Middle East & Africa
-
5. Asia Pacific
- 5.1. China
- 5.2. India
- 5.3. Japan
- 5.4. South Korea
- 5.5. ASEAN
- 5.6. Oceania
- 5.7. Rest of Asia Pacific
360Hz Gaming Monitors REPORT HIGHLIGHTS
| Aspects | Details |
|---|---|
| Study Period | 2019-2033 |
| Base Year | 2024 |
| Estimated Year | 2025 |
| Forecast Period | 2025-2033 |
| Historical Period | 2019-2024 |
| Growth Rate | CAGR of XX% from 2019-2033 |
| Segmentation |
|
Table of Contents
- 1. Introduction
- 1.1. Research Scope
- 1.2. Market Segmentation
- 1.3. Research Methodology
- 1.4. Definitions and Assumptions
- 2. Executive Summary
- 2.1. Introduction
- 3. Market Dynamics
- 3.1. Introduction
- 3.2. Market Drivers
- 3.3. Market Restrains
- 3.4. Market Trends
- 4. Market Factor Analysis
- 4.1. Porters Five Forces
- 4.2. Supply/Value Chain
- 4.3. PESTEL analysis
- 4.4. Market Entropy
- 4.5. Patent/Trademark Analysis
- 5. Global 360Hz Gaming Monitors Analysis, Insights and Forecast, 2019-2031
- 5.1. Market Analysis, Insights and Forecast - by Application
- 5.1.1. Online Sales
- 5.1.2. Offline Sales
- 5.2. Market Analysis, Insights and Forecast - by Types
- 5.2.1. Response Time 0.3ms GTG
- 5.2.2. Response Time 0.5ms GTG
- 5.2.3. Response Time 1ms GTG
- 5.2.4. Other
- 5.3. Market Analysis, Insights and Forecast - by Region
- 5.3.1. North America
- 5.3.2. South America
- 5.3.3. Europe
- 5.3.4. Middle East & Africa
- 5.3.5. Asia Pacific
- 5.1. Market Analysis, Insights and Forecast - by Application
- 6. North America 360Hz Gaming Monitors Analysis, Insights and Forecast, 2019-2031
- 6.1. Market Analysis, Insights and Forecast - by Application
- 6.1.1. Online Sales
- 6.1.2. Offline Sales
- 6.2. Market Analysis, Insights and Forecast - by Types
- 6.2.1. Response Time 0.3ms GTG
- 6.2.2. Response Time 0.5ms GTG
- 6.2.3. Response Time 1ms GTG
- 6.2.4. Other
- 6.1. Market Analysis, Insights and Forecast - by Application
- 7. South America 360Hz Gaming Monitors Analysis, Insights and Forecast, 2019-2031
- 7.1. Market Analysis, Insights and Forecast - by Application
- 7.1.1. Online Sales
- 7.1.2. Offline Sales
- 7.2. Market Analysis, Insights and Forecast - by Types
- 7.2.1. Response Time 0.3ms GTG
- 7.2.2. Response Time 0.5ms GTG
- 7.2.3. Response Time 1ms GTG
- 7.2.4. Other
- 7.1. Market Analysis, Insights and Forecast - by Application
- 8. Europe 360Hz Gaming Monitors Analysis, Insights and Forecast, 2019-2031
- 8.1. Market Analysis, Insights and Forecast - by Application
- 8.1.1. Online Sales
- 8.1.2. Offline Sales
- 8.2. Market Analysis, Insights and Forecast - by Types
- 8.2.1. Response Time 0.3ms GTG
- 8.2.2. Response Time 0.5ms GTG
- 8.2.3. Response Time 1ms GTG
- 8.2.4. Other
- 8.1. Market Analysis, Insights and Forecast - by Application
- 9. Middle East & Africa 360Hz Gaming Monitors Analysis, Insights and Forecast, 2019-2031
- 9.1. Market Analysis, Insights and Forecast - by Application
- 9.1.1. Online Sales
- 9.1.2. Offline Sales
- 9.2. Market Analysis, Insights and Forecast - by Types
- 9.2.1. Response Time 0.3ms GTG
- 9.2.2. Response Time 0.5ms GTG
- 9.2.3. Response Time 1ms GTG
- 9.2.4. Other
- 9.1. Market Analysis, Insights and Forecast - by Application
- 10. Asia Pacific 360Hz Gaming Monitors Analysis, Insights and Forecast, 2019-2031
- 10.1. Market Analysis, Insights and Forecast - by Application
- 10.1.1. Online Sales
- 10.1.2. Offline Sales
- 10.2. Market Analysis, Insights and Forecast - by Types
- 10.2.1. Response Time 0.3ms GTG
- 10.2.2. Response Time 0.5ms GTG
- 10.2.3. Response Time 1ms GTG
- 10.2.4. Other
- 10.1. Market Analysis, Insights and Forecast - by Application
- 11. Competitive Analysis
- 11.1. Global Market Share Analysis 2024
- 11.2. Company Profiles
- 11.2.1 Dell
- 11.2.1.1. Overview
- 11.2.1.2. Products
- 11.2.1.3. SWOT Analysis
- 11.2.1.4. Recent Developments
- 11.2.1.5. Financials (Based on Availability)
- 11.2.2 ASUS
- 11.2.2.1. Overview
- 11.2.2.2. Products
- 11.2.2.3. SWOT Analysis
- 11.2.2.4. Recent Developments
- 11.2.2.5. Financials (Based on Availability)
- 11.2.3 Acer
- 11.2.3.1. Overview
- 11.2.3.2. Products
- 11.2.3.3. SWOT Analysis
- 11.2.3.4. Recent Developments
- 11.2.3.5. Financials (Based on Availability)
- 11.2.4 MSI
- 11.2.4.1. Overview
- 11.2.4.2. Products
- 11.2.4.3. SWOT Analysis
- 11.2.4.4. Recent Developments
- 11.2.4.5. Financials (Based on Availability)
- 11.2.5 AOC
- 11.2.5.1. Overview
- 11.2.5.2. Products
- 11.2.5.3. SWOT Analysis
- 11.2.5.4. Recent Developments
- 11.2.5.5. Financials (Based on Availability)
- 11.2.1 Dell
List of Figures
- Figure 1: Global 360Hz Gaming Monitors Revenue Breakdown (million, %) by Region 2024 & 2032
- Figure 2: North America 360Hz Gaming Monitors Revenue (million), by Application 2024 & 2032
- Figure 3: North America 360Hz Gaming Monitors Revenue Share (%), by Application 2024 & 2032
- Figure 4: North America 360Hz Gaming Monitors Revenue (million), by Types 2024 & 2032
- Figure 5: North America 360Hz Gaming Monitors Revenue Share (%), by Types 2024 & 2032
- Figure 6: North America 360Hz Gaming Monitors Revenue (million), by Country 2024 & 2032
- Figure 7: North America 360Hz Gaming Monitors Revenue Share (%), by Country 2024 & 2032
- Figure 8: South America 360Hz Gaming Monitors Revenue (million), by Application 2024 & 2032
- Figure 9: South America 360Hz Gaming Monitors Revenue Share (%), by Application 2024 & 2032
- Figure 10: South America 360Hz Gaming Monitors Revenue (million), by Types 2024 & 2032
- Figure 11: South America 360Hz Gaming Monitors Revenue Share (%), by Types 2024 & 2032
- Figure 12: South America 360Hz Gaming Monitors Revenue (million), by Country 2024 & 2032
- Figure 13: South America 360Hz Gaming Monitors Revenue Share (%), by Country 2024 & 2032
- Figure 14: Europe 360Hz Gaming Monitors Revenue (million), by Application 2024 & 2032
- Figure 15: Europe 360Hz Gaming Monitors Revenue Share (%), by Application 2024 & 2032
- Figure 16: Europe 360Hz Gaming Monitors Revenue (million), by Types 2024 & 2032
- Figure 17: Europe 360Hz Gaming Monitors Revenue Share (%), by Types 2024 & 2032
- Figure 18: Europe 360Hz Gaming Monitors Revenue (million), by Country 2024 & 2032
- Figure 19: Europe 360Hz Gaming Monitors Revenue Share (%), by Country 2024 & 2032
- Figure 20: Middle East & Africa 360Hz Gaming Monitors Revenue (million), by Application 2024 & 2032
- Figure 21: Middle East & Africa 360Hz Gaming Monitors Revenue Share (%), by Application 2024 & 2032
- Figure 22: Middle East & Africa 360Hz Gaming Monitors Revenue (million), by Types 2024 & 2032
- Figure 23: Middle East & Africa 360Hz Gaming Monitors Revenue Share (%), by Types 2024 & 2032
- Figure 24: Middle East & Africa 360Hz Gaming Monitors Revenue (million), by Country 2024 & 2032
- Figure 25: Middle East & Africa 360Hz Gaming Monitors Revenue Share (%), by Country 2024 & 2032
- Figure 26: Asia Pacific 360Hz Gaming Monitors Revenue (million), by Application 2024 & 2032
- Figure 27: Asia Pacific 360Hz Gaming Monitors Revenue Share (%), by Application 2024 & 2032
- Figure 28: Asia Pacific 360Hz Gaming Monitors Revenue (million), by Types 2024 & 2032
- Figure 29: Asia Pacific 360Hz Gaming Monitors Revenue Share (%), by Types 2024 & 2032
- Figure 30: Asia Pacific 360Hz Gaming Monitors Revenue (million), by Country 2024 & 2032
- Figure 31: Asia Pacific 360Hz Gaming Monitors Revenue Share (%), by Country 2024 & 2032
List of Tables
- Table 1: Global 360Hz Gaming Monitors Revenue million Forecast, by Region 2019 & 2032
- Table 2: Global 360Hz Gaming Monitors Revenue million Forecast, by Application 2019 & 2032
- Table 3: Global 360Hz Gaming Monitors Revenue million Forecast, by Types 2019 & 2032
- Table 4: Global 360Hz Gaming Monitors Revenue million Forecast, by Region 2019 & 2032
- Table 5: Global 360Hz Gaming Monitors Revenue million Forecast, by Application 2019 & 2032
- Table 6: Global 360Hz Gaming Monitors Revenue million Forecast, by Types 2019 & 2032
- Table 7: Global 360Hz Gaming Monitors Revenue million Forecast, by Country 2019 & 2032
- Table 8: United States 360Hz Gaming Monitors Revenue (million) Forecast, by Application 2019 & 2032
- Table 9: Canada 360Hz Gaming Monitors Revenue (million) Forecast, by Application 2019 & 2032
- Table 10: Mexico 360Hz Gaming Monitors Revenue (million) Forecast, by Application 2019 & 2032
- Table 11: Global 360Hz Gaming Monitors Revenue million Forecast, by Application 2019 & 2032
- Table 12: Global 360Hz Gaming Monitors Revenue million Forecast, by Types 2019 & 2032
- Table 13: Global 360Hz Gaming Monitors Revenue million Forecast, by Country 2019 & 2032
- Table 14: Brazil 360Hz Gaming Monitors Revenue (million) Forecast, by Application 2019 & 2032
- Table 15: Argentina 360Hz Gaming Monitors Revenue (million) Forecast, by Application 2019 & 2032
- Table 16: Rest of South America 360Hz Gaming Monitors Revenue (million) Forecast, by Application 2019 & 2032
- Table 17: Global 360Hz Gaming Monitors Revenue million Forecast, by Application 2019 & 2032
- Table 18: Global 360Hz Gaming Monitors Revenue million Forecast, by Types 2019 & 2032
- Table 19: Global 360Hz Gaming Monitors Revenue million Forecast, by Country 2019 & 2032
- Table 20: United Kingdom 360Hz Gaming Monitors Revenue (million) Forecast, by Application 2019 & 2032
- Table 21: Germany 360Hz Gaming Monitors Revenue (million) Forecast, by Application 2019 & 2032
- Table 22: France 360Hz Gaming Monitors Revenue (million) Forecast, by Application 2019 & 2032
- Table 23: Italy 360Hz Gaming Monitors Revenue (million) Forecast, by Application 2019 & 2032
- Table 24: Spain 360Hz Gaming Monitors Revenue (million) Forecast, by Application 2019 & 2032
- Table 25: Russia 360Hz Gaming Monitors Revenue (million) Forecast, by Application 2019 & 2032
- Table 26: Benelux 360Hz Gaming Monitors Revenue (million) Forecast, by Application 2019 & 2032
- Table 27: Nordics 360Hz Gaming Monitors Revenue (million) Forecast, by Application 2019 & 2032
- Table 28: Rest of Europe 360Hz Gaming Monitors Revenue (million) Forecast, by Application 2019 & 2032
- Table 29: Global 360Hz Gaming Monitors Revenue million Forecast, by Application 2019 & 2032
- Table 30: Global 360Hz Gaming Monitors Revenue million Forecast, by Types 2019 & 2032
- Table 31: Global 360Hz Gaming Monitors Revenue million Forecast, by Country 2019 & 2032
- Table 32: Turkey 360Hz Gaming Monitors Revenue (million) Forecast, by Application 2019 & 2032
- Table 33: Israel 360Hz Gaming Monitors Revenue (million) Forecast, by Application 2019 & 2032
- Table 34: GCC 360Hz Gaming Monitors Revenue (million) Forecast, by Application 2019 & 2032
- Table 35: North Africa 360Hz Gaming Monitors Revenue (million) Forecast, by Application 2019 & 2032
- Table 36: South Africa 360Hz Gaming Monitors Revenue (million) Forecast, by Application 2019 & 2032
- Table 37: Rest of Middle East & Africa 360Hz Gaming Monitors Revenue (million) Forecast, by Application 2019 & 2032
- Table 38: Global 360Hz Gaming Monitors Revenue million Forecast, by Application 2019 & 2032
- Table 39: Global 360Hz Gaming Monitors Revenue million Forecast, by Types 2019 & 2032
- Table 40: Global 360Hz Gaming Monitors Revenue million Forecast, by Country 2019 & 2032
- Table 41: China 360Hz Gaming Monitors Revenue (million) Forecast, by Application 2019 & 2032
- Table 42: India 360Hz Gaming Monitors Revenue (million) Forecast, by Application 2019 & 2032
- Table 43: Japan 360Hz Gaming Monitors Revenue (million) Forecast, by Application 2019 & 2032
- Table 44: South Korea 360Hz Gaming Monitors Revenue (million) Forecast, by Application 2019 & 2032
- Table 45: ASEAN 360Hz Gaming Monitors Revenue (million) Forecast, by Application 2019 & 2032
- Table 46: Oceania 360Hz Gaming Monitors Revenue (million) Forecast, by Application 2019 & 2032
- Table 47: Rest of Asia Pacific 360Hz Gaming Monitors Revenue (million) Forecast, by Application 2019 & 2032
Frequently Asked Questions
1. What is the projected Compound Annual Growth Rate (CAGR) of the 360Hz Gaming Monitors?
The projected CAGR is approximately XX%.
2. Which companies are prominent players in the 360Hz Gaming Monitors?
Key companies in the market include Dell, ASUS, Acer, MSI, AOC.
3. What are the main segments of the 360Hz Gaming Monitors?
The market segments include Application, Types.
4. Can you provide details about the market size?
The market size is estimated to be USD XXX million as of 2022.
5. What are some drivers contributing to market growth?
N/A
6. What are the notable trends driving market growth?
N/A
7. Are there any restraints impacting market growth?
N/A
8. Can you provide examples of recent developments in the market?
N/A
9. What pricing options are available for accessing the report?
Pricing options include single-user, multi-user, and enterprise licenses priced at USD 2900.00, USD 4350.00, and USD 5800.00 respectively.
10. Is the market size provided in terms of value or volume?
The market size is provided in terms of value, measured in million.
11. Are there any specific market keywords associated with the report?
Yes, the market keyword associated with the report is "360Hz Gaming Monitors," which aids in identifying and referencing the specific market segment covered.
12. How do I determine which pricing option suits my needs best?
The pricing options vary based on user requirements and access needs. Individual users may opt for single-user licenses, while businesses requiring broader access may choose multi-user or enterprise licenses for cost-effective access to the report.
13. Are there any additional resources or data provided in the 360Hz Gaming Monitors report?
While the report offers comprehensive insights, it's advisable to review the specific contents or supplementary materials provided to ascertain if additional resources or data are available.
14. How can I stay updated on further developments or reports in the 360Hz Gaming Monitors?
To stay informed about further developments, trends, and reports in the 360Hz Gaming Monitors, consider subscribing to industry newsletters, following relevant companies and organizations, or regularly checking reputable industry news sources and publications.
Methodology
Step 1 - Identification of Relevant Samples Size from Population Database


Step 2 - Approaches for Defining Global Market Size (Value, Volume* & Price*)

Note*: In applicable scenarios
Step 3 - Data Sources
Primary Research
- Web Analytics
- Survey Reports
- Research Institute
- Latest Research Reports
- Opinion Leaders
Secondary Research
- Annual Reports
- White Paper
- Latest Press Release
- Industry Association
- Paid Database
- Investor Presentations

Step 4 - Data Triangulation
Involves using different sources of information in order to increase the validity of a study
These sources are likely to be stakeholders in a program - participants, other researchers, program staff, other community members, and so on.
Then we put all data in single framework & apply various statistical tools to find out the dynamic on the market.
During the analysis stage, feedback from the stakeholder groups would be compared to determine areas of agreement as well as areas of divergence


