
Key Insights
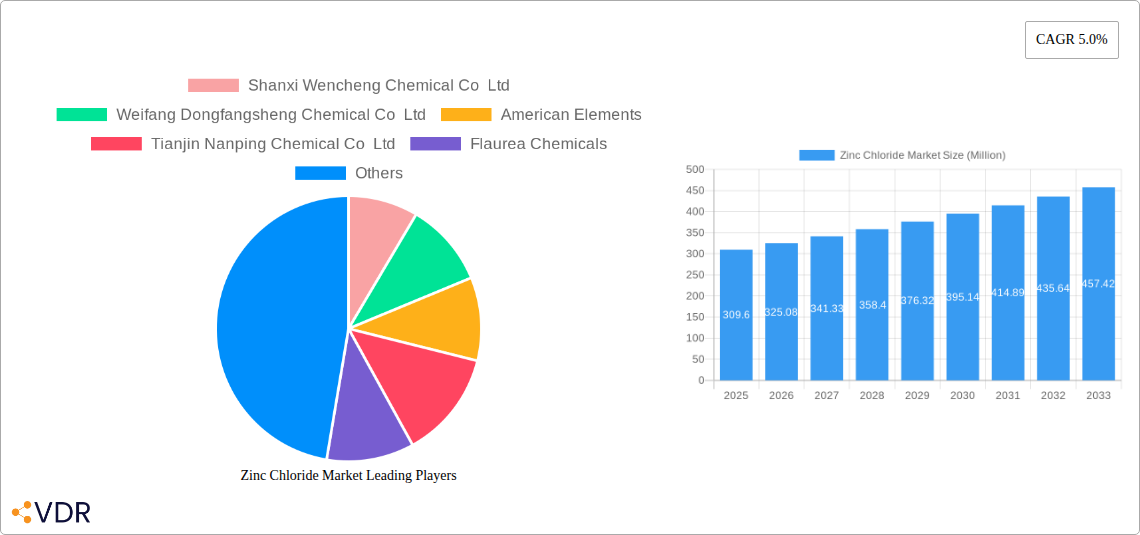
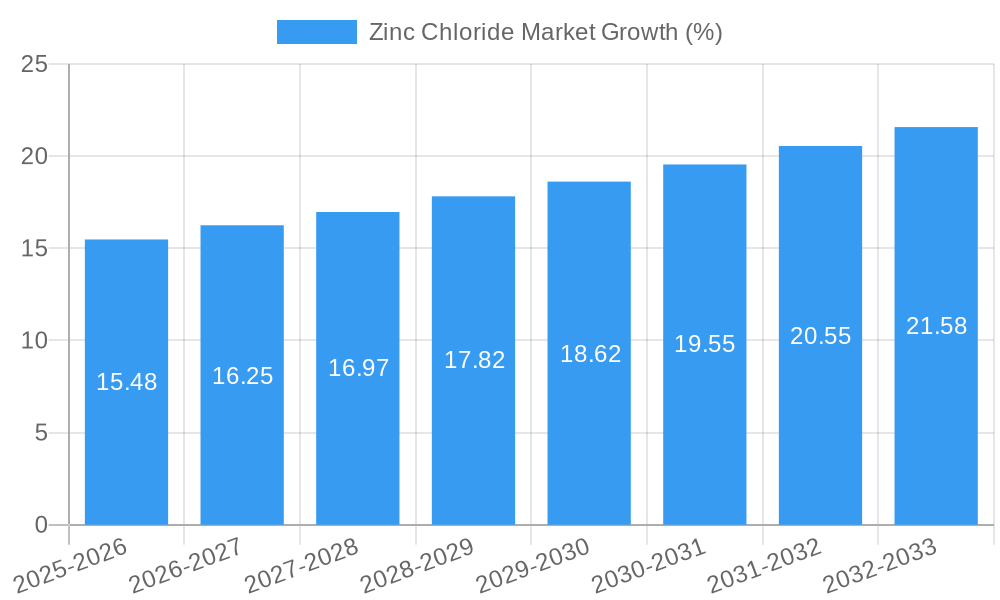
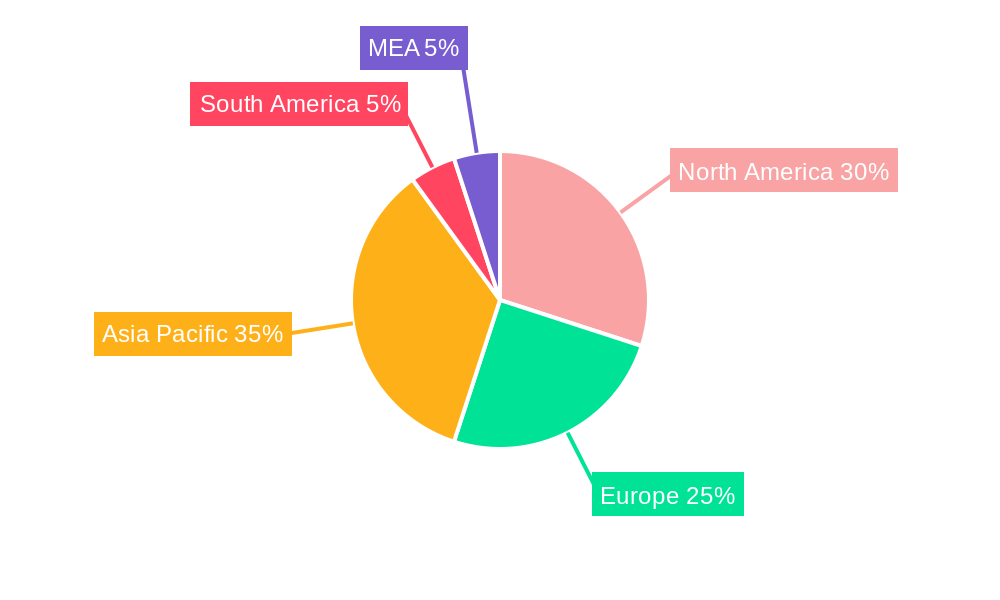
The Zinc Chloride market, valued at $309.6 million in 2025, is projected to experience robust growth, driven by its increasing applications in water treatment, particularly in industrial wastewater purification and municipal water treatment plants. The rising demand for efficient and cost-effective water treatment solutions globally is a primary catalyst. Furthermore, the chemical industry's reliance on zinc chloride as a catalyst in various chemical processes, including organic synthesis and polymerization, fuels market expansion. Growth in the oil and gas sector, requiring zinc chloride for well completion and drilling fluids, also contributes significantly. While the textile industry utilizes zinc chloride for dyeing and finishing processes, its application in metallurgy for galvanizing and metal treatment further broadens the market scope. However, stringent environmental regulations concerning the handling and disposal of zinc chloride, along with fluctuating raw material prices, pose challenges to market growth. The market is segmented by application (water treatment, catalyst, other applications) and end-user industry (chemicals, oil and gas, textile, metallurgy, other end-user industries). North America and Asia-Pacific are expected to dominate the market due to strong industrial growth and increasing environmental awareness. Competitive landscape analysis reveals key players such as Shanxi Wencheng Chemical Co Ltd, Weifang Dongfangsheng Chemical Co Ltd, and American Elements, among others, vying for market share through strategic expansions, technological innovations, and partnerships. The forecast period (2025-2033) anticipates a continued upward trajectory, with a Compound Annual Growth Rate (CAGR) of 5.0%, indicating substantial market potential for stakeholders.
The projected growth of the Zinc Chloride market hinges on several factors. Technological advancements leading to more efficient and environmentally friendly zinc chloride production processes are expected to positively impact the market. The rising focus on sustainable practices across various industries will drive the adoption of zinc chloride in eco-friendly applications. Furthermore, government initiatives promoting water conservation and industrial wastewater treatment are expected to bolster the demand for zinc chloride in water treatment applications. However, potential risks include price volatility of raw materials, like zinc metal, which directly impacts the cost of zinc chloride production. Ongoing research and development into alternative chemicals might present some level of competition. Nevertheless, the overall positive outlook for the Zinc Chloride market stems from its established applications across diverse sectors and the potential for innovative applications in emerging fields. The regional distribution is likely to witness dynamic shifts with the growth of developing economies in Asia-Pacific and Latin America.
Zinc Chloride Market: A Comprehensive Report (2019-2033)
This in-depth report provides a comprehensive analysis of the global Zinc Chloride market, encompassing market dynamics, growth trends, regional dominance, product landscape, key players, and future outlook. The report covers the period from 2019 to 2033, with 2025 serving as the base and estimated year. The study delves into various segments, including applications (Water Treatment, Catalyst, Other Applications) and end-user industries (Chemicals, Oil and Gas, Textile, Metallurgy, Other End-user Industries), offering valuable insights for industry professionals, investors, and stakeholders. The market size is projected in Million units.
Zinc Chloride Market Market Dynamics & Structure
The Zinc Chloride market, valued at xx Million in 2025, exhibits a moderately concentrated structure with key players holding significant market shares. Technological innovation, primarily in production efficiency and purity enhancement, is a key driver, while stringent environmental regulations are shaping manufacturing practices. Competitive substitutes, such as alternative coagulants in water treatment, pose a challenge. Market consolidation through mergers and acquisitions (M&A) is anticipated to increase, with xx M&A deals recorded between 2019 and 2024. End-user demographics are shifting towards increased demand from emerging economies, particularly in the water treatment and chemical sectors.
- Market Concentration: Moderately concentrated, with top 5 players holding approximately xx% market share in 2025.
- Technological Innovation: Focus on improving production efficiency and product purity, leading to cost reductions and wider applications.
- Regulatory Framework: Stringent environmental regulations influencing manufacturing processes and waste management.
- Competitive Substitutes: Alternative coagulants and other chemicals present competitive pressure in specific applications.
- M&A Activity: An average of xx M&A deals per year observed between 2019-2024, indicative of industry consolidation.
- End-User Demographics: Growing demand from emerging economies, especially in water treatment and chemical industries.
Zinc Chloride Market Growth Trends & Insights
The Zinc Chloride market is projected to witness robust growth, with a Compound Annual Growth Rate (CAGR) of xx% during the forecast period (2025-2033). This growth is driven by increasing demand from various end-user sectors, including water treatment (driven by urbanization and stricter water quality standards), the chemical industry (as a catalyst and reagent), and metallurgy (for various applications including galvanizing). Technological advancements in production processes, leading to cost-effective and high-purity Zinc Chloride, are further boosting market expansion. Market penetration in emerging economies remains relatively low, presenting significant growth opportunities. Consumer behavior shifts towards sustainable solutions are also impacting the market, with a growing emphasis on eco-friendly manufacturing and application methods. Detailed breakdown of market size evolution and adoption rates across various segments will be included.
Dominant Regions, Countries, or Segments in Zinc Chloride Market
The Asia-Pacific region currently dominates the Zinc Chloride market, holding approximately xx% of the global market share in 2025, driven by rapid industrialization and burgeoning infrastructure development in countries like China and India. Within applications, water treatment is the largest segment, accounting for approximately xx% of market revenue in 2025, followed by the chemical industry. The strong growth in these sectors, coupled with favorable government policies promoting industrial development and environmental protection, are key drivers of market dominance.
- Asia-Pacific Dominance: Driven by rapid industrialization, infrastructure development, and strong demand from water treatment and chemical sectors in China and India.
- Water Treatment Segment Leadership: High demand for effective and cost-efficient water purification solutions across various industries and geographies.
- Chemical Industry's Significant Contribution: Zinc Chloride's crucial role as a catalyst and reagent in various chemical processes.
- Growth Potential in Other Regions: Untapped market potential exists in North America and Europe driven by focus on sustainable solutions.
Zinc Chloride Market Product Landscape
The Zinc Chloride market offers a range of products with varying purity levels and particle sizes to meet diverse application needs. Recent innovations focus on enhancing purity for specialized applications, improving handling properties through advanced formulations, and developing sustainable production processes. Unique selling propositions often revolve around superior purity, consistent quality, cost-effectiveness, and tailored solutions for specific industry applications.
Key Drivers, Barriers & Challenges in Zinc Chloride Market
Key Drivers:
- Increasing demand from the water treatment sector due to urbanization and stricter regulations.
- Growing applications in the chemical industry as a catalyst and reagent.
- Expanding use in metallurgical processes, including galvanizing.
- Technological advancements leading to improved production efficiency and product purity.
Key Challenges and Restraints:
- Fluctuations in raw material prices, impacting production costs.
- Stringent environmental regulations requiring costly waste management practices.
- Competition from alternative coagulants and other chemicals in specific applications.
- Supply chain disruptions due to geopolitical factors and regional conflicts. This resulted in a xx% increase in prices in Q2 2024.
Emerging Opportunities in Zinc Chloride Market
Emerging opportunities lie in exploring untapped markets in developing economies, developing specialized high-purity Zinc Chloride for niche applications (e.g., pharmaceuticals), and focusing on sustainable and eco-friendly production methods. The growing focus on water conservation and wastewater treatment presents substantial opportunities for growth.
Growth Accelerators in the Zinc Chloride Market Industry
Long-term growth will be accelerated by technological breakthroughs in production processes, leading to higher efficiency and reduced costs. Strategic partnerships between manufacturers and end-users will enable tailored solutions and improved market penetration. Expansion into new geographic markets and diversification into high-growth application segments will also play a crucial role in driving future market expansion.
Key Players Shaping the Zinc Chloride Market Market
- Shanxi Wencheng Chemical Co Ltd
- Weifang Dongfangsheng Chemical Co Ltd
- American Elements
- Tianjin Nanping Chemical Co Ltd
- Flaurea Chemicals
- Vijaychem Industries
- Zaclon LLC
- Lipmes
- TIB Chemicals AG
- Global Chemical Co Ltd
Notable Milestones in Zinc Chloride Market Sector
- 2021-Q3: Introduction of a new high-purity Zinc Chloride by American Elements.
- 2022-Q1: Shanxi Wencheng Chemical Co Ltd expands its production facility in China.
- 2023-Q4: Merger between two smaller Zinc Chloride producers in Europe.
In-Depth Zinc Chloride Market Market Outlook
The Zinc Chloride market presents significant long-term growth potential, driven by a confluence of factors, including rising demand from key end-user sectors, technological advancements leading to improved efficiency and product quality, and a growing focus on sustainable solutions. Strategic investments in research and development, expansion into new geographic markets, and strategic partnerships will be crucial for capturing the emerging opportunities and securing a leading position in this dynamic market. The market is expected to reach xx Million by 2033.
Zinc Chloride Market Segmentation
-
1. Application
- 1.1. Water Treatment
- 1.2. Catalyst
- 1.3. Other Applications
-
2. End-user Industry
- 2.1. Chemicals
- 2.2. Oil and Gas
- 2.3. Textile
- 2.4. Metallurgy
- 2.5. Other End-user Industries
Zinc Chloride Market Segmentation By Geography
-
1. Asia Pacific
- 1.1. China
- 1.2. India
- 1.3. Japan
- 1.4. South Korea
- 1.5. Rest of Asia Pacific
-
2. North America
- 2.1. United States
- 2.2. Canada
- 2.3. Mexico
-
3. Europe
- 3.1. Germany
- 3.2. United Kingdom
- 3.3. France
- 3.4. Italy
- 3.5. Rest of Europe
-
4. South America
- 4.1. Brazil
- 4.2. Argentina
- 4.3. Rest of South America
- 5. Middle East
-
6. Saudi Arabia
- 6.1. South Africa
- 6.2. Rest of Middle East
Zinc Chloride Market REPORT HIGHLIGHTS
| Aspects | Details |
|---|---|
| Study Period | 2019-2033 |
| Base Year | 2024 |
| Estimated Year | 2025 |
| Forecast Period | 2025-2033 |
| Historical Period | 2019-2024 |
| Growth Rate | CAGR of 5.0% from 2019-2033 |
| Segmentation |
|
Table of Contents
- 1. Introduction
- 1.1. Research Scope
- 1.2. Market Segmentation
- 1.3. Research Methodology
- 1.4. Definitions and Assumptions
- 2. Executive Summary
- 2.1. Introduction
- 3. Market Dynamics
- 3.1. Introduction
- 3.2. Market Drivers
- 3.2.1. ; Growing Demand from the Textile Industry; Increasing Synthesis of Chemicals
- 3.3. Market Restrains
- 3.3.1. ; Hazardous Nature of Metal Oxide Nanoparticles; Unfavorable Conditions Arising Due to COVID-19 Outbreak
- 3.4. Market Trends
- 3.4.1. Increasing Usage in the Textile Processing Industry
- 4. Market Factor Analysis
- 4.1. Porters Five Forces
- 4.2. Supply/Value Chain
- 4.3. PESTEL analysis
- 4.4. Market Entropy
- 4.5. Patent/Trademark Analysis
- 5. Global Zinc Chloride Market Analysis, Insights and Forecast, 2019-2031
- 5.1. Market Analysis, Insights and Forecast - by Application
- 5.1.1. Water Treatment
- 5.1.2. Catalyst
- 5.1.3. Other Applications
- 5.2. Market Analysis, Insights and Forecast - by End-user Industry
- 5.2.1. Chemicals
- 5.2.2. Oil and Gas
- 5.2.3. Textile
- 5.2.4. Metallurgy
- 5.2.5. Other End-user Industries
- 5.3. Market Analysis, Insights and Forecast - by Region
- 5.3.1. Asia Pacific
- 5.3.2. North America
- 5.3.3. Europe
- 5.3.4. South America
- 5.3.5. Middle East
- 5.3.6. Saudi Arabia
- 5.1. Market Analysis, Insights and Forecast - by Application
- 6. Asia Pacific Zinc Chloride Market Analysis, Insights and Forecast, 2019-2031
- 6.1. Market Analysis, Insights and Forecast - by Application
- 6.1.1. Water Treatment
- 6.1.2. Catalyst
- 6.1.3. Other Applications
- 6.2. Market Analysis, Insights and Forecast - by End-user Industry
- 6.2.1. Chemicals
- 6.2.2. Oil and Gas
- 6.2.3. Textile
- 6.2.4. Metallurgy
- 6.2.5. Other End-user Industries
- 6.1. Market Analysis, Insights and Forecast - by Application
- 7. North America Zinc Chloride Market Analysis, Insights and Forecast, 2019-2031
- 7.1. Market Analysis, Insights and Forecast - by Application
- 7.1.1. Water Treatment
- 7.1.2. Catalyst
- 7.1.3. Other Applications
- 7.2. Market Analysis, Insights and Forecast - by End-user Industry
- 7.2.1. Chemicals
- 7.2.2. Oil and Gas
- 7.2.3. Textile
- 7.2.4. Metallurgy
- 7.2.5. Other End-user Industries
- 7.1. Market Analysis, Insights and Forecast - by Application
- 8. Europe Zinc Chloride Market Analysis, Insights and Forecast, 2019-2031
- 8.1. Market Analysis, Insights and Forecast - by Application
- 8.1.1. Water Treatment
- 8.1.2. Catalyst
- 8.1.3. Other Applications
- 8.2. Market Analysis, Insights and Forecast - by End-user Industry
- 8.2.1. Chemicals
- 8.2.2. Oil and Gas
- 8.2.3. Textile
- 8.2.4. Metallurgy
- 8.2.5. Other End-user Industries
- 8.1. Market Analysis, Insights and Forecast - by Application
- 9. South America Zinc Chloride Market Analysis, Insights and Forecast, 2019-2031
- 9.1. Market Analysis, Insights and Forecast - by Application
- 9.1.1. Water Treatment
- 9.1.2. Catalyst
- 9.1.3. Other Applications
- 9.2. Market Analysis, Insights and Forecast - by End-user Industry
- 9.2.1. Chemicals
- 9.2.2. Oil and Gas
- 9.2.3. Textile
- 9.2.4. Metallurgy
- 9.2.5. Other End-user Industries
- 9.1. Market Analysis, Insights and Forecast - by Application
- 10. Middle East Zinc Chloride Market Analysis, Insights and Forecast, 2019-2031
- 10.1. Market Analysis, Insights and Forecast - by Application
- 10.1.1. Water Treatment
- 10.1.2. Catalyst
- 10.1.3. Other Applications
- 10.2. Market Analysis, Insights and Forecast - by End-user Industry
- 10.2.1. Chemicals
- 10.2.2. Oil and Gas
- 10.2.3. Textile
- 10.2.4. Metallurgy
- 10.2.5. Other End-user Industries
- 10.1. Market Analysis, Insights and Forecast - by Application
- 11. Saudi Arabia Zinc Chloride Market Analysis, Insights and Forecast, 2019-2031
- 11.1. Market Analysis, Insights and Forecast - by Application
- 11.1.1. Water Treatment
- 11.1.2. Catalyst
- 11.1.3. Other Applications
- 11.2. Market Analysis, Insights and Forecast - by End-user Industry
- 11.2.1. Chemicals
- 11.2.2. Oil and Gas
- 11.2.3. Textile
- 11.2.4. Metallurgy
- 11.2.5. Other End-user Industries
- 11.1. Market Analysis, Insights and Forecast - by Application
- 12. North America Zinc Chloride Market Analysis, Insights and Forecast, 2019-2031
- 12.1. Market Analysis, Insights and Forecast - By Country/Sub-region
- 12.1.1 United States
- 12.1.2 Canada
- 12.1.3 Mexico
- 13. Europe Zinc Chloride Market Analysis, Insights and Forecast, 2019-2031
- 13.1. Market Analysis, Insights and Forecast - By Country/Sub-region
- 13.1.1 Germany
- 13.1.2 France
- 13.1.3 Italy
- 13.1.4 United Kingdom
- 13.1.5 Netherlands
- 13.1.6 Rest of Europe
- 14. Asia Pacific Zinc Chloride Market Analysis, Insights and Forecast, 2019-2031
- 14.1. Market Analysis, Insights and Forecast - By Country/Sub-region
- 14.1.1 China
- 14.1.2 Japan
- 14.1.3 India
- 14.1.4 South Korea
- 14.1.5 Taiwan
- 14.1.6 Australia
- 14.1.7 Rest of Asia-Pacific
- 15. South America Zinc Chloride Market Analysis, Insights and Forecast, 2019-2031
- 15.1. Market Analysis, Insights and Forecast - By Country/Sub-region
- 15.1.1 Brazil
- 15.1.2 Argentina
- 15.1.3 Rest of South America
- 16. MEA Zinc Chloride Market Analysis, Insights and Forecast, 2019-2031
- 16.1. Market Analysis, Insights and Forecast - By Country/Sub-region
- 16.1.1 Middle East
- 16.1.2 Africa
- 17. Competitive Analysis
- 17.1. Global Market Share Analysis 2024
- 17.2. Company Profiles
- 17.2.1 Shanxi Wencheng Chemical Co Ltd
- 17.2.1.1. Overview
- 17.2.1.2. Products
- 17.2.1.3. SWOT Analysis
- 17.2.1.4. Recent Developments
- 17.2.1.5. Financials (Based on Availability)
- 17.2.2 Weifang Dongfangsheng Chemical Co Ltd
- 17.2.2.1. Overview
- 17.2.2.2. Products
- 17.2.2.3. SWOT Analysis
- 17.2.2.4. Recent Developments
- 17.2.2.5. Financials (Based on Availability)
- 17.2.3 American Elements
- 17.2.3.1. Overview
- 17.2.3.2. Products
- 17.2.3.3. SWOT Analysis
- 17.2.3.4. Recent Developments
- 17.2.3.5. Financials (Based on Availability)
- 17.2.4 Tianjin Nanping Chemical Co Ltd
- 17.2.4.1. Overview
- 17.2.4.2. Products
- 17.2.4.3. SWOT Analysis
- 17.2.4.4. Recent Developments
- 17.2.4.5. Financials (Based on Availability)
- 17.2.5 Flaurea Chemicals
- 17.2.5.1. Overview
- 17.2.5.2. Products
- 17.2.5.3. SWOT Analysis
- 17.2.5.4. Recent Developments
- 17.2.5.5. Financials (Based on Availability)
- 17.2.6 Vijaychem Industries
- 17.2.6.1. Overview
- 17.2.6.2. Products
- 17.2.6.3. SWOT Analysis
- 17.2.6.4. Recent Developments
- 17.2.6.5. Financials (Based on Availability)
- 17.2.7 Zaclon LLC
- 17.2.7.1. Overview
- 17.2.7.2. Products
- 17.2.7.3. SWOT Analysis
- 17.2.7.4. Recent Developments
- 17.2.7.5. Financials (Based on Availability)
- 17.2.8 Lipmes
- 17.2.8.1. Overview
- 17.2.8.2. Products
- 17.2.8.3. SWOT Analysis
- 17.2.8.4. Recent Developments
- 17.2.8.5. Financials (Based on Availability)
- 17.2.9 TIB Chemicals AG
- 17.2.9.1. Overview
- 17.2.9.2. Products
- 17.2.9.3. SWOT Analysis
- 17.2.9.4. Recent Developments
- 17.2.9.5. Financials (Based on Availability)
- 17.2.10 Global Chemical Co Ltd
- 17.2.10.1. Overview
- 17.2.10.2. Products
- 17.2.10.3. SWOT Analysis
- 17.2.10.4. Recent Developments
- 17.2.10.5. Financials (Based on Availability)
- 17.2.1 Shanxi Wencheng Chemical Co Ltd
List of Figures
- Figure 1: Global Zinc Chloride Market Revenue Breakdown (Million, %) by Region 2024 & 2032
- Figure 2: Global Zinc Chloride Market Volume Breakdown (K Tons, %) by Region 2024 & 2032
- Figure 3: North America Zinc Chloride Market Revenue (Million), by Country 2024 & 2032
- Figure 4: North America Zinc Chloride Market Volume (K Tons), by Country 2024 & 2032
- Figure 5: North America Zinc Chloride Market Revenue Share (%), by Country 2024 & 2032
- Figure 6: North America Zinc Chloride Market Volume Share (%), by Country 2024 & 2032
- Figure 7: Europe Zinc Chloride Market Revenue (Million), by Country 2024 & 2032
- Figure 8: Europe Zinc Chloride Market Volume (K Tons), by Country 2024 & 2032
- Figure 9: Europe Zinc Chloride Market Revenue Share (%), by Country 2024 & 2032
- Figure 10: Europe Zinc Chloride Market Volume Share (%), by Country 2024 & 2032
- Figure 11: Asia Pacific Zinc Chloride Market Revenue (Million), by Country 2024 & 2032
- Figure 12: Asia Pacific Zinc Chloride Market Volume (K Tons), by Country 2024 & 2032
- Figure 13: Asia Pacific Zinc Chloride Market Revenue Share (%), by Country 2024 & 2032
- Figure 14: Asia Pacific Zinc Chloride Market Volume Share (%), by Country 2024 & 2032
- Figure 15: South America Zinc Chloride Market Revenue (Million), by Country 2024 & 2032
- Figure 16: South America Zinc Chloride Market Volume (K Tons), by Country 2024 & 2032
- Figure 17: South America Zinc Chloride Market Revenue Share (%), by Country 2024 & 2032
- Figure 18: South America Zinc Chloride Market Volume Share (%), by Country 2024 & 2032
- Figure 19: MEA Zinc Chloride Market Revenue (Million), by Country 2024 & 2032
- Figure 20: MEA Zinc Chloride Market Volume (K Tons), by Country 2024 & 2032
- Figure 21: MEA Zinc Chloride Market Revenue Share (%), by Country 2024 & 2032
- Figure 22: MEA Zinc Chloride Market Volume Share (%), by Country 2024 & 2032
- Figure 23: Asia Pacific Zinc Chloride Market Revenue (Million), by Application 2024 & 2032
- Figure 24: Asia Pacific Zinc Chloride Market Volume (K Tons), by Application 2024 & 2032
- Figure 25: Asia Pacific Zinc Chloride Market Revenue Share (%), by Application 2024 & 2032
- Figure 26: Asia Pacific Zinc Chloride Market Volume Share (%), by Application 2024 & 2032
- Figure 27: Asia Pacific Zinc Chloride Market Revenue (Million), by End-user Industry 2024 & 2032
- Figure 28: Asia Pacific Zinc Chloride Market Volume (K Tons), by End-user Industry 2024 & 2032
- Figure 29: Asia Pacific Zinc Chloride Market Revenue Share (%), by End-user Industry 2024 & 2032
- Figure 30: Asia Pacific Zinc Chloride Market Volume Share (%), by End-user Industry 2024 & 2032
- Figure 31: Asia Pacific Zinc Chloride Market Revenue (Million), by Country 2024 & 2032
- Figure 32: Asia Pacific Zinc Chloride Market Volume (K Tons), by Country 2024 & 2032
- Figure 33: Asia Pacific Zinc Chloride Market Revenue Share (%), by Country 2024 & 2032
- Figure 34: Asia Pacific Zinc Chloride Market Volume Share (%), by Country 2024 & 2032
- Figure 35: North America Zinc Chloride Market Revenue (Million), by Application 2024 & 2032
- Figure 36: North America Zinc Chloride Market Volume (K Tons), by Application 2024 & 2032
- Figure 37: North America Zinc Chloride Market Revenue Share (%), by Application 2024 & 2032
- Figure 38: North America Zinc Chloride Market Volume Share (%), by Application 2024 & 2032
- Figure 39: North America Zinc Chloride Market Revenue (Million), by End-user Industry 2024 & 2032
- Figure 40: North America Zinc Chloride Market Volume (K Tons), by End-user Industry 2024 & 2032
- Figure 41: North America Zinc Chloride Market Revenue Share (%), by End-user Industry 2024 & 2032
- Figure 42: North America Zinc Chloride Market Volume Share (%), by End-user Industry 2024 & 2032
- Figure 43: North America Zinc Chloride Market Revenue (Million), by Country 2024 & 2032
- Figure 44: North America Zinc Chloride Market Volume (K Tons), by Country 2024 & 2032
- Figure 45: North America Zinc Chloride Market Revenue Share (%), by Country 2024 & 2032
- Figure 46: North America Zinc Chloride Market Volume Share (%), by Country 2024 & 2032
- Figure 47: Europe Zinc Chloride Market Revenue (Million), by Application 2024 & 2032
- Figure 48: Europe Zinc Chloride Market Volume (K Tons), by Application 2024 & 2032
- Figure 49: Europe Zinc Chloride Market Revenue Share (%), by Application 2024 & 2032
- Figure 50: Europe Zinc Chloride Market Volume Share (%), by Application 2024 & 2032
- Figure 51: Europe Zinc Chloride Market Revenue (Million), by End-user Industry 2024 & 2032
- Figure 52: Europe Zinc Chloride Market Volume (K Tons), by End-user Industry 2024 & 2032
- Figure 53: Europe Zinc Chloride Market Revenue Share (%), by End-user Industry 2024 & 2032
- Figure 54: Europe Zinc Chloride Market Volume Share (%), by End-user Industry 2024 & 2032
- Figure 55: Europe Zinc Chloride Market Revenue (Million), by Country 2024 & 2032
- Figure 56: Europe Zinc Chloride Market Volume (K Tons), by Country 2024 & 2032
- Figure 57: Europe Zinc Chloride Market Revenue Share (%), by Country 2024 & 2032
- Figure 58: Europe Zinc Chloride Market Volume Share (%), by Country 2024 & 2032
- Figure 59: South America Zinc Chloride Market Revenue (Million), by Application 2024 & 2032
- Figure 60: South America Zinc Chloride Market Volume (K Tons), by Application 2024 & 2032
- Figure 61: South America Zinc Chloride Market Revenue Share (%), by Application 2024 & 2032
- Figure 62: South America Zinc Chloride Market Volume Share (%), by Application 2024 & 2032
- Figure 63: South America Zinc Chloride Market Revenue (Million), by End-user Industry 2024 & 2032
- Figure 64: South America Zinc Chloride Market Volume (K Tons), by End-user Industry 2024 & 2032
- Figure 65: South America Zinc Chloride Market Revenue Share (%), by End-user Industry 2024 & 2032
- Figure 66: South America Zinc Chloride Market Volume Share (%), by End-user Industry 2024 & 2032
- Figure 67: South America Zinc Chloride Market Revenue (Million), by Country 2024 & 2032
- Figure 68: South America Zinc Chloride Market Volume (K Tons), by Country 2024 & 2032
- Figure 69: South America Zinc Chloride Market Revenue Share (%), by Country 2024 & 2032
- Figure 70: South America Zinc Chloride Market Volume Share (%), by Country 2024 & 2032
- Figure 71: Middle East Zinc Chloride Market Revenue (Million), by Application 2024 & 2032
- Figure 72: Middle East Zinc Chloride Market Volume (K Tons), by Application 2024 & 2032
- Figure 73: Middle East Zinc Chloride Market Revenue Share (%), by Application 2024 & 2032
- Figure 74: Middle East Zinc Chloride Market Volume Share (%), by Application 2024 & 2032
- Figure 75: Middle East Zinc Chloride Market Revenue (Million), by End-user Industry 2024 & 2032
- Figure 76: Middle East Zinc Chloride Market Volume (K Tons), by End-user Industry 2024 & 2032
- Figure 77: Middle East Zinc Chloride Market Revenue Share (%), by End-user Industry 2024 & 2032
- Figure 78: Middle East Zinc Chloride Market Volume Share (%), by End-user Industry 2024 & 2032
- Figure 79: Middle East Zinc Chloride Market Revenue (Million), by Country 2024 & 2032
- Figure 80: Middle East Zinc Chloride Market Volume (K Tons), by Country 2024 & 2032
- Figure 81: Middle East Zinc Chloride Market Revenue Share (%), by Country 2024 & 2032
- Figure 82: Middle East Zinc Chloride Market Volume Share (%), by Country 2024 & 2032
- Figure 83: Saudi Arabia Zinc Chloride Market Revenue (Million), by Application 2024 & 2032
- Figure 84: Saudi Arabia Zinc Chloride Market Volume (K Tons), by Application 2024 & 2032
- Figure 85: Saudi Arabia Zinc Chloride Market Revenue Share (%), by Application 2024 & 2032
- Figure 86: Saudi Arabia Zinc Chloride Market Volume Share (%), by Application 2024 & 2032
- Figure 87: Saudi Arabia Zinc Chloride Market Revenue (Million), by End-user Industry 2024 & 2032
- Figure 88: Saudi Arabia Zinc Chloride Market Volume (K Tons), by End-user Industry 2024 & 2032
- Figure 89: Saudi Arabia Zinc Chloride Market Revenue Share (%), by End-user Industry 2024 & 2032
- Figure 90: Saudi Arabia Zinc Chloride Market Volume Share (%), by End-user Industry 2024 & 2032
- Figure 91: Saudi Arabia Zinc Chloride Market Revenue (Million), by Country 2024 & 2032
- Figure 92: Saudi Arabia Zinc Chloride Market Volume (K Tons), by Country 2024 & 2032
- Figure 93: Saudi Arabia Zinc Chloride Market Revenue Share (%), by Country 2024 & 2032
- Figure 94: Saudi Arabia Zinc Chloride Market Volume Share (%), by Country 2024 & 2032
List of Tables
- Table 1: Global Zinc Chloride Market Revenue Million Forecast, by Region 2019 & 2032
- Table 2: Global Zinc Chloride Market Volume K Tons Forecast, by Region 2019 & 2032
- Table 3: Global Zinc Chloride Market Revenue Million Forecast, by Application 2019 & 2032
- Table 4: Global Zinc Chloride Market Volume K Tons Forecast, by Application 2019 & 2032
- Table 5: Global Zinc Chloride Market Revenue Million Forecast, by End-user Industry 2019 & 2032
- Table 6: Global Zinc Chloride Market Volume K Tons Forecast, by End-user Industry 2019 & 2032
- Table 7: Global Zinc Chloride Market Revenue Million Forecast, by Region 2019 & 2032
- Table 8: Global Zinc Chloride Market Volume K Tons Forecast, by Region 2019 & 2032
- Table 9: Global Zinc Chloride Market Revenue Million Forecast, by Country 2019 & 2032
- Table 10: Global Zinc Chloride Market Volume K Tons Forecast, by Country 2019 & 2032
- Table 11: United States Zinc Chloride Market Revenue (Million) Forecast, by Application 2019 & 2032
- Table 12: United States Zinc Chloride Market Volume (K Tons) Forecast, by Application 2019 & 2032
- Table 13: Canada Zinc Chloride Market Revenue (Million) Forecast, by Application 2019 & 2032
- Table 14: Canada Zinc Chloride Market Volume (K Tons) Forecast, by Application 2019 & 2032
- Table 15: Mexico Zinc Chloride Market Revenue (Million) Forecast, by Application 2019 & 2032
- Table 16: Mexico Zinc Chloride Market Volume (K Tons) Forecast, by Application 2019 & 2032
- Table 17: Global Zinc Chloride Market Revenue Million Forecast, by Country 2019 & 2032
- Table 18: Global Zinc Chloride Market Volume K Tons Forecast, by Country 2019 & 2032
- Table 19: Germany Zinc Chloride Market Revenue (Million) Forecast, by Application 2019 & 2032
- Table 20: Germany Zinc Chloride Market Volume (K Tons) Forecast, by Application 2019 & 2032
- Table 21: France Zinc Chloride Market Revenue (Million) Forecast, by Application 2019 & 2032
- Table 22: France Zinc Chloride Market Volume (K Tons) Forecast, by Application 2019 & 2032
- Table 23: Italy Zinc Chloride Market Revenue (Million) Forecast, by Application 2019 & 2032
- Table 24: Italy Zinc Chloride Market Volume (K Tons) Forecast, by Application 2019 & 2032
- Table 25: United Kingdom Zinc Chloride Market Revenue (Million) Forecast, by Application 2019 & 2032
- Table 26: United Kingdom Zinc Chloride Market Volume (K Tons) Forecast, by Application 2019 & 2032
- Table 27: Netherlands Zinc Chloride Market Revenue (Million) Forecast, by Application 2019 & 2032
- Table 28: Netherlands Zinc Chloride Market Volume (K Tons) Forecast, by Application 2019 & 2032
- Table 29: Rest of Europe Zinc Chloride Market Revenue (Million) Forecast, by Application 2019 & 2032
- Table 30: Rest of Europe Zinc Chloride Market Volume (K Tons) Forecast, by Application 2019 & 2032
- Table 31: Global Zinc Chloride Market Revenue Million Forecast, by Country 2019 & 2032
- Table 32: Global Zinc Chloride Market Volume K Tons Forecast, by Country 2019 & 2032
- Table 33: China Zinc Chloride Market Revenue (Million) Forecast, by Application 2019 & 2032
- Table 34: China Zinc Chloride Market Volume (K Tons) Forecast, by Application 2019 & 2032
- Table 35: Japan Zinc Chloride Market Revenue (Million) Forecast, by Application 2019 & 2032
- Table 36: Japan Zinc Chloride Market Volume (K Tons) Forecast, by Application 2019 & 2032
- Table 37: India Zinc Chloride Market Revenue (Million) Forecast, by Application 2019 & 2032
- Table 38: India Zinc Chloride Market Volume (K Tons) Forecast, by Application 2019 & 2032
- Table 39: South Korea Zinc Chloride Market Revenue (Million) Forecast, by Application 2019 & 2032
- Table 40: South Korea Zinc Chloride Market Volume (K Tons) Forecast, by Application 2019 & 2032
- Table 41: Taiwan Zinc Chloride Market Revenue (Million) Forecast, by Application 2019 & 2032
- Table 42: Taiwan Zinc Chloride Market Volume (K Tons) Forecast, by Application 2019 & 2032
- Table 43: Australia Zinc Chloride Market Revenue (Million) Forecast, by Application 2019 & 2032
- Table 44: Australia Zinc Chloride Market Volume (K Tons) Forecast, by Application 2019 & 2032
- Table 45: Rest of Asia-Pacific Zinc Chloride Market Revenue (Million) Forecast, by Application 2019 & 2032
- Table 46: Rest of Asia-Pacific Zinc Chloride Market Volume (K Tons) Forecast, by Application 2019 & 2032
- Table 47: Global Zinc Chloride Market Revenue Million Forecast, by Country 2019 & 2032
- Table 48: Global Zinc Chloride Market Volume K Tons Forecast, by Country 2019 & 2032
- Table 49: Brazil Zinc Chloride Market Revenue (Million) Forecast, by Application 2019 & 2032
- Table 50: Brazil Zinc Chloride Market Volume (K Tons) Forecast, by Application 2019 & 2032
- Table 51: Argentina Zinc Chloride Market Revenue (Million) Forecast, by Application 2019 & 2032
- Table 52: Argentina Zinc Chloride Market Volume (K Tons) Forecast, by Application 2019 & 2032
- Table 53: Rest of South America Zinc Chloride Market Revenue (Million) Forecast, by Application 2019 & 2032
- Table 54: Rest of South America Zinc Chloride Market Volume (K Tons) Forecast, by Application 2019 & 2032
- Table 55: Global Zinc Chloride Market Revenue Million Forecast, by Country 2019 & 2032
- Table 56: Global Zinc Chloride Market Volume K Tons Forecast, by Country 2019 & 2032
- Table 57: Middle East Zinc Chloride Market Revenue (Million) Forecast, by Application 2019 & 2032
- Table 58: Middle East Zinc Chloride Market Volume (K Tons) Forecast, by Application 2019 & 2032
- Table 59: Africa Zinc Chloride Market Revenue (Million) Forecast, by Application 2019 & 2032
- Table 60: Africa Zinc Chloride Market Volume (K Tons) Forecast, by Application 2019 & 2032
- Table 61: Global Zinc Chloride Market Revenue Million Forecast, by Application 2019 & 2032
- Table 62: Global Zinc Chloride Market Volume K Tons Forecast, by Application 2019 & 2032
- Table 63: Global Zinc Chloride Market Revenue Million Forecast, by End-user Industry 2019 & 2032
- Table 64: Global Zinc Chloride Market Volume K Tons Forecast, by End-user Industry 2019 & 2032
- Table 65: Global Zinc Chloride Market Revenue Million Forecast, by Country 2019 & 2032
- Table 66: Global Zinc Chloride Market Volume K Tons Forecast, by Country 2019 & 2032
- Table 67: China Zinc Chloride Market Revenue (Million) Forecast, by Application 2019 & 2032
- Table 68: China Zinc Chloride Market Volume (K Tons) Forecast, by Application 2019 & 2032
- Table 69: India Zinc Chloride Market Revenue (Million) Forecast, by Application 2019 & 2032
- Table 70: India Zinc Chloride Market Volume (K Tons) Forecast, by Application 2019 & 2032
- Table 71: Japan Zinc Chloride Market Revenue (Million) Forecast, by Application 2019 & 2032
- Table 72: Japan Zinc Chloride Market Volume (K Tons) Forecast, by Application 2019 & 2032
- Table 73: South Korea Zinc Chloride Market Revenue (Million) Forecast, by Application 2019 & 2032
- Table 74: South Korea Zinc Chloride Market Volume (K Tons) Forecast, by Application 2019 & 2032
- Table 75: Rest of Asia Pacific Zinc Chloride Market Revenue (Million) Forecast, by Application 2019 & 2032
- Table 76: Rest of Asia Pacific Zinc Chloride Market Volume (K Tons) Forecast, by Application 2019 & 2032
- Table 77: Global Zinc Chloride Market Revenue Million Forecast, by Application 2019 & 2032
- Table 78: Global Zinc Chloride Market Volume K Tons Forecast, by Application 2019 & 2032
- Table 79: Global Zinc Chloride Market Revenue Million Forecast, by End-user Industry 2019 & 2032
- Table 80: Global Zinc Chloride Market Volume K Tons Forecast, by End-user Industry 2019 & 2032
- Table 81: Global Zinc Chloride Market Revenue Million Forecast, by Country 2019 & 2032
- Table 82: Global Zinc Chloride Market Volume K Tons Forecast, by Country 2019 & 2032
- Table 83: United States Zinc Chloride Market Revenue (Million) Forecast, by Application 2019 & 2032
- Table 84: United States Zinc Chloride Market Volume (K Tons) Forecast, by Application 2019 & 2032
- Table 85: Canada Zinc Chloride Market Revenue (Million) Forecast, by Application 2019 & 2032
- Table 86: Canada Zinc Chloride Market Volume (K Tons) Forecast, by Application 2019 & 2032
- Table 87: Mexico Zinc Chloride Market Revenue (Million) Forecast, by Application 2019 & 2032
- Table 88: Mexico Zinc Chloride Market Volume (K Tons) Forecast, by Application 2019 & 2032
- Table 89: Global Zinc Chloride Market Revenue Million Forecast, by Application 2019 & 2032
- Table 90: Global Zinc Chloride Market Volume K Tons Forecast, by Application 2019 & 2032
- Table 91: Global Zinc Chloride Market Revenue Million Forecast, by End-user Industry 2019 & 2032
- Table 92: Global Zinc Chloride Market Volume K Tons Forecast, by End-user Industry 2019 & 2032
- Table 93: Global Zinc Chloride Market Revenue Million Forecast, by Country 2019 & 2032
- Table 94: Global Zinc Chloride Market Volume K Tons Forecast, by Country 2019 & 2032
- Table 95: Germany Zinc Chloride Market Revenue (Million) Forecast, by Application 2019 & 2032
- Table 96: Germany Zinc Chloride Market Volume (K Tons) Forecast, by Application 2019 & 2032
- Table 97: United Kingdom Zinc Chloride Market Revenue (Million) Forecast, by Application 2019 & 2032
- Table 98: United Kingdom Zinc Chloride Market Volume (K Tons) Forecast, by Application 2019 & 2032
- Table 99: France Zinc Chloride Market Revenue (Million) Forecast, by Application 2019 & 2032
- Table 100: France Zinc Chloride Market Volume (K Tons) Forecast, by Application 2019 & 2032
- Table 101: Italy Zinc Chloride Market Revenue (Million) Forecast, by Application 2019 & 2032
- Table 102: Italy Zinc Chloride Market Volume (K Tons) Forecast, by Application 2019 & 2032
- Table 103: Rest of Europe Zinc Chloride Market Revenue (Million) Forecast, by Application 2019 & 2032
- Table 104: Rest of Europe Zinc Chloride Market Volume (K Tons) Forecast, by Application 2019 & 2032
- Table 105: Global Zinc Chloride Market Revenue Million Forecast, by Application 2019 & 2032
- Table 106: Global Zinc Chloride Market Volume K Tons Forecast, by Application 2019 & 2032
- Table 107: Global Zinc Chloride Market Revenue Million Forecast, by End-user Industry 2019 & 2032
- Table 108: Global Zinc Chloride Market Volume K Tons Forecast, by End-user Industry 2019 & 2032
- Table 109: Global Zinc Chloride Market Revenue Million Forecast, by Country 2019 & 2032
- Table 110: Global Zinc Chloride Market Volume K Tons Forecast, by Country 2019 & 2032
- Table 111: Brazil Zinc Chloride Market Revenue (Million) Forecast, by Application 2019 & 2032
- Table 112: Brazil Zinc Chloride Market Volume (K Tons) Forecast, by Application 2019 & 2032
- Table 113: Argentina Zinc Chloride Market Revenue (Million) Forecast, by Application 2019 & 2032
- Table 114: Argentina Zinc Chloride Market Volume (K Tons) Forecast, by Application 2019 & 2032
- Table 115: Rest of South America Zinc Chloride Market Revenue (Million) Forecast, by Application 2019 & 2032
- Table 116: Rest of South America Zinc Chloride Market Volume (K Tons) Forecast, by Application 2019 & 2032
- Table 117: Global Zinc Chloride Market Revenue Million Forecast, by Application 2019 & 2032
- Table 118: Global Zinc Chloride Market Volume K Tons Forecast, by Application 2019 & 2032
- Table 119: Global Zinc Chloride Market Revenue Million Forecast, by End-user Industry 2019 & 2032
- Table 120: Global Zinc Chloride Market Volume K Tons Forecast, by End-user Industry 2019 & 2032
- Table 121: Global Zinc Chloride Market Revenue Million Forecast, by Country 2019 & 2032
- Table 122: Global Zinc Chloride Market Volume K Tons Forecast, by Country 2019 & 2032
- Table 123: Global Zinc Chloride Market Revenue Million Forecast, by Application 2019 & 2032
- Table 124: Global Zinc Chloride Market Volume K Tons Forecast, by Application 2019 & 2032
- Table 125: Global Zinc Chloride Market Revenue Million Forecast, by End-user Industry 2019 & 2032
- Table 126: Global Zinc Chloride Market Volume K Tons Forecast, by End-user Industry 2019 & 2032
- Table 127: Global Zinc Chloride Market Revenue Million Forecast, by Country 2019 & 2032
- Table 128: Global Zinc Chloride Market Volume K Tons Forecast, by Country 2019 & 2032
- Table 129: South Africa Zinc Chloride Market Revenue (Million) Forecast, by Application 2019 & 2032
- Table 130: South Africa Zinc Chloride Market Volume (K Tons) Forecast, by Application 2019 & 2032
- Table 131: Rest of Middle East Zinc Chloride Market Revenue (Million) Forecast, by Application 2019 & 2032
- Table 132: Rest of Middle East Zinc Chloride Market Volume (K Tons) Forecast, by Application 2019 & 2032
Frequently Asked Questions
1. What is the projected Compound Annual Growth Rate (CAGR) of the Zinc Chloride Market?
The projected CAGR is approximately 5.0%.
2. Which companies are prominent players in the Zinc Chloride Market?
Key companies in the market include Shanxi Wencheng Chemical Co Ltd, Weifang Dongfangsheng Chemical Co Ltd, American Elements, Tianjin Nanping Chemical Co Ltd, Flaurea Chemicals, Vijaychem Industries, Zaclon LLC, Lipmes, TIB Chemicals AG, Global Chemical Co Ltd.
3. What are the main segments of the Zinc Chloride Market?
The market segments include Application, End-user Industry.
4. Can you provide details about the market size?
The market size is estimated to be USD 309.6 Million as of 2022.
5. What are some drivers contributing to market growth?
; Growing Demand from the Textile Industry; Increasing Synthesis of Chemicals.
6. What are the notable trends driving market growth?
Increasing Usage in the Textile Processing Industry.
7. Are there any restraints impacting market growth?
; Hazardous Nature of Metal Oxide Nanoparticles; Unfavorable Conditions Arising Due to COVID-19 Outbreak.
8. Can you provide examples of recent developments in the market?
N/A
9. What pricing options are available for accessing the report?
Pricing options include single-user, multi-user, and enterprise licenses priced at USD 4750, USD 5250, and USD 8750 respectively.
10. Is the market size provided in terms of value or volume?
The market size is provided in terms of value, measured in Million and volume, measured in K Tons.
11. Are there any specific market keywords associated with the report?
Yes, the market keyword associated with the report is "Zinc Chloride Market," which aids in identifying and referencing the specific market segment covered.
12. How do I determine which pricing option suits my needs best?
The pricing options vary based on user requirements and access needs. Individual users may opt for single-user licenses, while businesses requiring broader access may choose multi-user or enterprise licenses for cost-effective access to the report.
13. Are there any additional resources or data provided in the Zinc Chloride Market report?
While the report offers comprehensive insights, it's advisable to review the specific contents or supplementary materials provided to ascertain if additional resources or data are available.
14. How can I stay updated on further developments or reports in the Zinc Chloride Market?
To stay informed about further developments, trends, and reports in the Zinc Chloride Market, consider subscribing to industry newsletters, following relevant companies and organizations, or regularly checking reputable industry news sources and publications.
Methodology
Step 1 - Identification of Relevant Samples Size from Population Database


Step 2 - Approaches for Defining Global Market Size (Value, Volume* & Price*)

Note*: In applicable scenarios
Step 3 - Data Sources
Primary Research
- Web Analytics
- Survey Reports
- Research Institute
- Latest Research Reports
- Opinion Leaders
Secondary Research
- Annual Reports
- White Paper
- Latest Press Release
- Industry Association
- Paid Database
- Investor Presentations

Step 4 - Data Triangulation
Involves using different sources of information in order to increase the validity of a study
These sources are likely to be stakeholders in a program - participants, other researchers, program staff, other community members, and so on.
Then we put all data in single framework & apply various statistical tools to find out the dynamic on the market.
During the analysis stage, feedback from the stakeholder groups would be compared to determine areas of agreement as well as areas of divergence


