

Key Insights
The global waterproofing chemicals market is forecast to reach $79.82 billion by 2033, expanding at a Compound Annual Growth Rate (CAGR) of 9.2% from the base year 2025. Growth is propelled by robust construction activity, particularly in emerging economies across Asia-Pacific and South America, alongside increasing urbanization and infrastructure development. Growing awareness of water damage costs and the demand for durable, aesthetically pleasing homes are also driving adoption. Innovations in eco-friendly and high-performance waterproofing solutions are further supporting market expansion. The residential segment is expected to see significant growth, influenced by rising disposable incomes and consumer preferences for quality housing. Challenges include raw material price volatility and environmental regulations, while intensified competition from established and emerging players is anticipated.
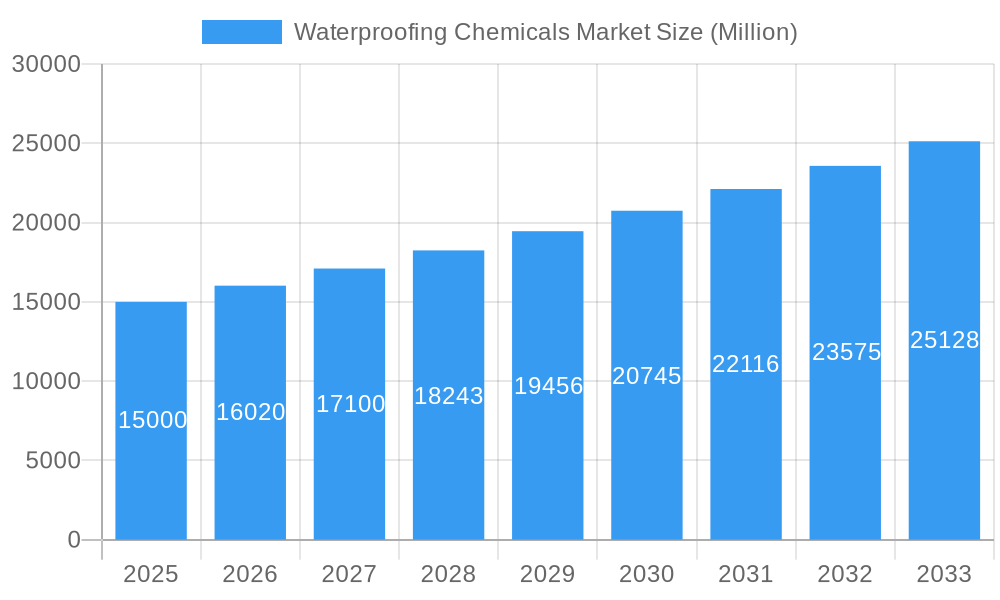
Waterproofing Chemicals Market Market Size (In Billion)
Market segmentation highlights substantial opportunities within various end-use sectors and technologies. Commercial and industrial applications are projected to lead, driven by the demand for durable solutions in large-scale projects. Infrastructure development, including bridges, tunnels, and dams, presents a key growth area requiring specialized, high-performance waterproofing. Epoxy- and polyurethane-based chemicals are expected to maintain market dominance due to their superior performance, while water-based alternatives are gaining traction for their environmental advantages. Asia-Pacific is anticipated to lead market growth due to rapid infrastructure and construction expansion, followed by North America and Europe. Emerging markets in South America and the Middle East & Africa are poised for considerable growth, offering lucrative expansion prospects.
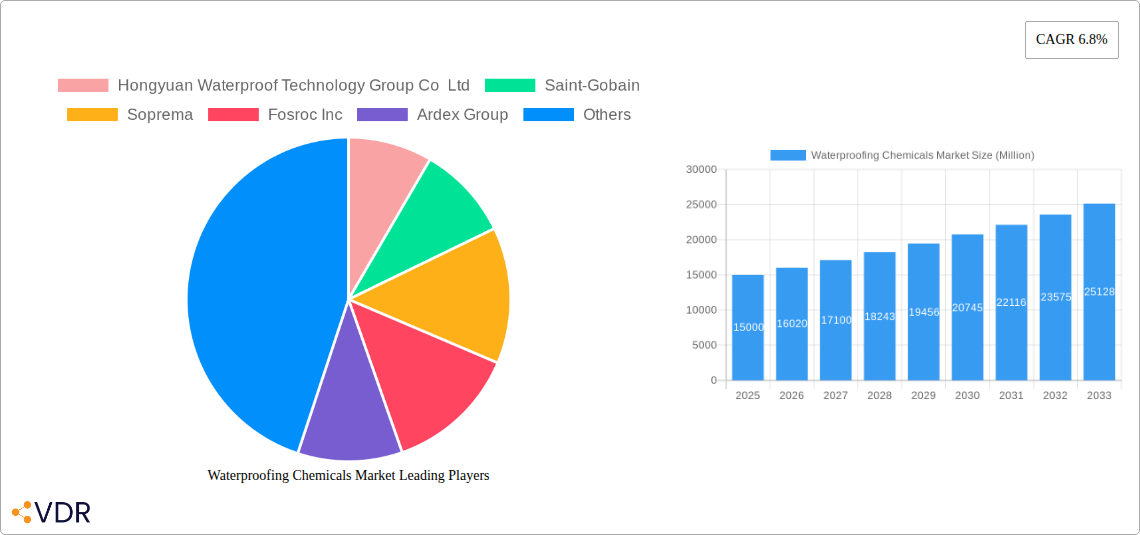
Waterproofing Chemicals Market Company Market Share
Waterproofing Chemicals Market: A Comprehensive Report (2019-2033)
This in-depth report provides a comprehensive analysis of the Waterproofing Chemicals Market, encompassing market dynamics, growth trends, regional insights, product landscapes, and key player strategies. The study period covers 2019-2033, with 2025 as the base year and a forecast period extending to 2033. The report's detailed segmentation includes End-Use Sectors (Commercial, Industrial & Institutional, Infrastructure, Residential) and Technologies (Epoxy-based, Polyurethane-based, Water-based, Other). This report is invaluable for industry professionals, investors, and strategic decision-makers seeking to understand and capitalize on the opportunities within this growing market. The market size is estimated at xx Million in 2025.
Waterproofing Chemicals Market Market Dynamics & Structure
The global waterproofing chemicals market is characterized by moderate concentration, with several key players dominating significant market shares. Technological innovation, driven by the need for sustainable and high-performance solutions, is a major growth driver. Stringent regulatory frameworks concerning environmental impact and building codes influence product development and market adoption. The market faces competition from traditional waterproofing methods, but the advantages of chemical solutions—like enhanced durability and ease of application—are fostering growth. End-user demographics, particularly in rapidly developing economies with extensive infrastructure projects, significantly impact demand. Mergers and acquisitions (M&A) activity is increasing, indicating consolidation and expansion strategies among key players.
- Market Concentration: Moderately concentrated, with top 10 players holding approximately xx% market share in 2025.
- Technological Innovation: Focus on eco-friendly, high-performance formulations (e.g., UV-resistant, self-healing).
- Regulatory Landscape: Compliance with VOC emissions, water pollution, and building codes are crucial.
- Competitive Substitutes: Traditional methods (e.g., asphalt, membrane) face competition from enhanced chemical solutions.
- M&A Activity: Increased consolidation through acquisitions and strategic partnerships (e.g., Sika AG’s acquisition of United Gilsonite Laboratories). An estimated xx M&A deals occurred between 2019 and 2024.
- Innovation Barriers: High R&D costs, stringent regulatory approvals, and the need to balance performance with environmental considerations.
Waterproofing Chemicals Market Growth Trends & Insights
The global waterproofing chemicals market is experiencing robust growth, driven by increasing urbanization, infrastructural development, and the rising demand for durable and sustainable building materials. The market witnessed a CAGR of xx% during the historical period (2019-2024) and is projected to maintain a CAGR of xx% during the forecast period (2025-2033). This growth is fueled by technological advancements leading to higher-performing and environmentally friendly products. Shifts in consumer preferences toward energy-efficient and sustainable buildings further contribute to market expansion. Market penetration remains relatively high in developed regions, but significant growth opportunities exist in emerging markets with rapid infrastructure development. The adoption rate of advanced waterproofing technologies, like polyurethane-based solutions, is steadily increasing due to their superior performance characteristics.
Dominant Regions, Countries, or Segments in Waterproofing Chemicals Market
The Asia-Pacific region is currently the dominant market for waterproofing chemicals, driven by rapid urbanization, substantial infrastructure investments, and a growing construction sector. Within this region, countries like China and India are key growth contributors. In terms of end-use sectors, infrastructure projects (including bridges, tunnels, and dams) and the commercial and industrial sectors (high-rise buildings, manufacturing plants) are major drivers of demand. The Epoxy-based segment holds a significant market share owing to its high durability and resistance to chemicals.
Key Drivers:
- Rapid urbanization and infrastructure development in Asia-Pacific and other emerging economies.
- Increasing construction activities in commercial and industrial sectors globally.
- Growing demand for sustainable and high-performance building materials.
- Supportive government policies and investments in infrastructure projects.
Dominance Factors:
- High construction activity and infrastructure projects in Asia-Pacific.
- Cost-effectiveness and performance advantages of Epoxy-based waterproofing solutions.
- Growing awareness of the importance of building durability and longevity.
- Favorable regulatory environment in certain regions.
Waterproofing Chemicals Market Product Landscape
The waterproofing chemicals market offers a diverse range of products, including epoxy-based, polyurethane-based, and water-based solutions, each catering to specific applications and requirements. Recent innovations focus on enhancing durability, UV resistance, flexibility, and ease of application. Unique selling propositions often center around superior performance, environmental friendliness (low VOC emissions), and ease of installation, particularly relevant to the increasingly skilled labor shortage in the construction industry. Technological advancements include self-healing capabilities and integrated monitoring systems for enhanced performance and longevity.
Key Drivers, Barriers & Challenges in Waterproofing Chemicals Market
Key Drivers:
- Increasing urbanization and infrastructure development.
- Rising demand for sustainable and energy-efficient buildings.
- Technological advancements in waterproofing chemicals.
- Stringent building codes and regulations driving adoption of high-performance materials.
Key Challenges:
- Fluctuations in raw material prices impacting profitability.
- Stringent environmental regulations and compliance costs.
- Intense competition from established players and new entrants.
- Supply chain disruptions impacting availability and timely project completion. Estimated impact: xx% decrease in production in 2024 due to supply chain issues.
Emerging Opportunities in Waterproofing Chemicals Market
- Expanding into untapped markets in developing economies.
- Development of innovative applications in specialized sectors (e.g., green buildings, renewable energy infrastructure).
- Growing demand for eco-friendly and sustainable waterproofing solutions.
- Increasing adoption of smart building technologies integrated with waterproofing systems.
Growth Accelerators in the Waterproofing Chemicals Market Industry
Long-term growth in the waterproofing chemicals market will be fueled by continued technological advancements, strategic partnerships between chemical manufacturers and construction companies, and expansion into new geographic markets. The development of self-healing and smart waterproofing materials will drive demand, while collaborations with construction firms will ensure seamless integration into building projects. Focusing on sustainability and environmental impact will attract environmentally conscious builders and governments.
Key Players Shaping the Waterproofing Chemicals Market Market
- Hongyuan Waterproof Technology Group Co Ltd
- Saint-Gobain
- Soprema
- Fosroc Inc
- Ardex Group
- MAPEI S p A
- Sika AG
- Keshun Waterproof Technology Co ltd
- Standard Industries Inc
- Oriental Yuhong
Notable Milestones in Waterproofing Chemicals Market Sector
- January 2022: SOPREMA launched Alsan Flashing Neo, a next-generation waterproofing chemical eliminating the need for primers. This innovation significantly reduces application time and cost.
- May 2022: Sika AG acquired United Gilsonite Laboratories, expanding its US market presence and product portfolio. This acquisition enhanced Sika's competitiveness and market share.
- November 2022: MAPEI invested in its German subsidiary, Sopro Bauchemie, increasing production capacity and R&D capabilities. This strengthens MAPEI’s position in the European market.
In-Depth Waterproofing Chemicals Market Market Outlook
The future of the waterproofing chemicals market is bright, with continued growth driven by technological innovation, infrastructure development, and increasing awareness of sustainable building practices. Strategic partnerships, market expansion into developing economies, and the development of specialized waterproofing solutions for niche applications will drive substantial market growth in the coming years. The market's potential is considerable, particularly in regions undergoing rapid urbanization and infrastructure modernization. The focus on eco-friendly and high-performance products will be key to success in this competitive market.
Waterproofing Chemicals Market Segmentation
-
1. End Use Sector
- 1.1. Commercial
- 1.2. Industrial and Institutional
- 1.3. Infrastructure
- 1.4. Residential
-
2. Technology
- 2.1. Epoxy-based
- 2.2. Polyurethane-based
- 2.3. Water-based
- 2.4. Other Technologies
Waterproofing Chemicals Market Segmentation By Geography
-
1. North America
- 1.1. United States
- 1.2. Canada
- 1.3. Mexico
-
2. South America
- 2.1. Brazil
- 2.2. Argentina
- 2.3. Rest of South America
-
3. Europe
- 3.1. United Kingdom
- 3.2. Germany
- 3.3. France
- 3.4. Italy
- 3.5. Spain
- 3.6. Russia
- 3.7. Benelux
- 3.8. Nordics
- 3.9. Rest of Europe
-
4. Middle East & Africa
- 4.1. Turkey
- 4.2. Israel
- 4.3. GCC
- 4.4. North Africa
- 4.5. South Africa
- 4.6. Rest of Middle East & Africa
-
5. Asia Pacific
- 5.1. China
- 5.2. India
- 5.3. Japan
- 5.4. South Korea
- 5.5. ASEAN
- 5.6. Oceania
- 5.7. Rest of Asia Pacific
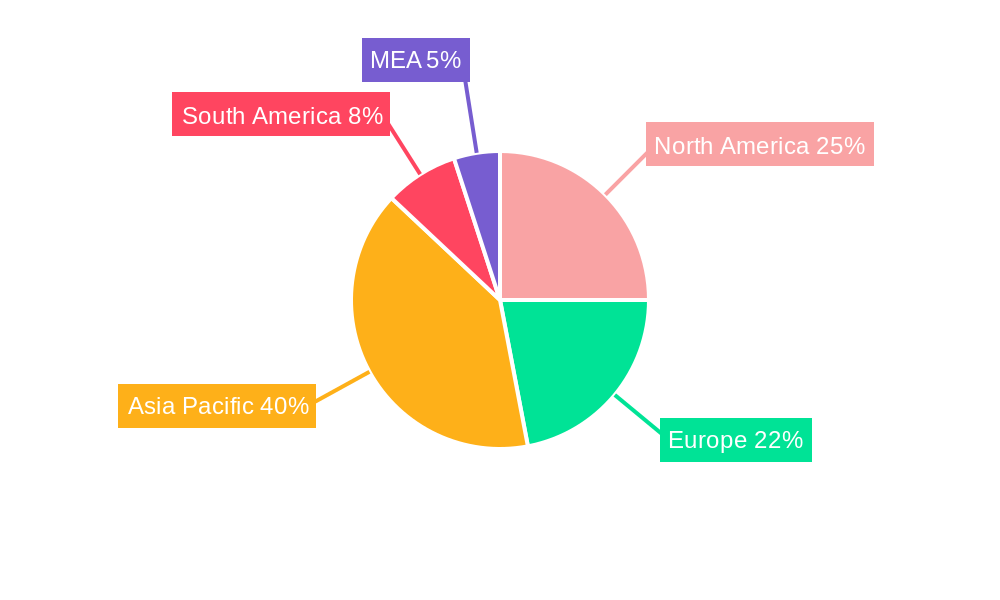
Waterproofing Chemicals Market Regional Market Share
Geographic Coverage of Waterproofing Chemicals Market
Waterproofing Chemicals Market REPORT HIGHLIGHTS
| Aspects | Details |
|---|---|
| Study Period | 2020-2034 |
| Base Year | 2025 |
| Estimated Year | 2026 |
| Forecast Period | 2026-2034 |
| Historical Period | 2020-2025 |
| Growth Rate | CAGR of 9.88% from 2020-2034 |
| Segmentation |
|
Table of Contents
- 1. Introduction
- 1.1. Research Scope
- 1.2. Market Segmentation
- 1.3. Research Objective
- 1.4. Definitions and Assumptions
- 2. Executive Summary
- 2.1. Market Snapshot
- 3. Market Dynamics
- 3.1. Market Drivers
- 3.2. Market Restrains
- 3.3. Market Trends
- 3.4. Market Opportunities
- 4. Market Factor Analysis
- 4.1. Porters Five Forces
- 4.1.1. Bargaining Power of Suppliers
- 4.1.2. Bargaining Power of Buyers
- 4.1.3. Threat of New Entrants
- 4.1.4. Threat of Substitutes
- 4.1.5. Competitive Rivalry
- 4.2. PESTEL analysis
- 4.3. BCG Analysis
- 4.3.1. Stars (High Growth, High Market Share)
- 4.3.2. Cash Cows (Low Growth, High Market Share)
- 4.3.3. Question Mark (High Growth, Low Market Share)
- 4.3.4. Dogs (Low Growth, Low Market Share)
- 4.4. Ansoff Matrix Analysis
- 4.5. Supply Chain Analysis
- 4.6. Regulatory Landscape
- 4.7. Current Market Potential and Opportunity Assessment (TAM–SAM–SOM Framework)
- 4.8. VDR Analyst Note
- 4.1. Porters Five Forces
- 5. Market Analysis, Insights and Forecast 2021-2033
- 5.1. Market Analysis, Insights and Forecast - by End Use Sector
- 5.1.1. Commercial
- 5.1.2. Industrial and Institutional
- 5.1.3. Infrastructure
- 5.1.4. Residential
- 5.2. Market Analysis, Insights and Forecast - by Technology
- 5.2.1. Epoxy-based
- 5.2.2. Polyurethane-based
- 5.2.3. Water-based
- 5.2.4. Other Technologies
- 5.3. Market Analysis, Insights and Forecast - by Region
- 5.3.1. North America
- 5.3.2. South America
- 5.3.3. Europe
- 5.3.4. Middle East & Africa
- 5.3.5. Asia Pacific
- 5.1. Market Analysis, Insights and Forecast - by End Use Sector
- 6. Global Waterproofing Chemicals Market Analysis, Insights and Forecast, 2021-2033
- 6.1. Market Analysis, Insights and Forecast - by End Use Sector
- 6.1.1. Commercial
- 6.1.2. Industrial and Institutional
- 6.1.3. Infrastructure
- 6.1.4. Residential
- 6.2. Market Analysis, Insights and Forecast - by Technology
- 6.2.1. Epoxy-based
- 6.2.2. Polyurethane-based
- 6.2.3. Water-based
- 6.2.4. Other Technologies
- 6.1. Market Analysis, Insights and Forecast - by End Use Sector
- 7. North America Waterproofing Chemicals Market Analysis, Insights and Forecast, 2021-2033
- 7.1. Market Analysis, Insights and Forecast - by End Use Sector
- 7.1.1. Commercial
- 7.1.2. Industrial and Institutional
- 7.1.3. Infrastructure
- 7.1.4. Residential
- 7.2. Market Analysis, Insights and Forecast - by Technology
- 7.2.1. Epoxy-based
- 7.2.2. Polyurethane-based
- 7.2.3. Water-based
- 7.2.4. Other Technologies
- 7.1. Market Analysis, Insights and Forecast - by End Use Sector
- 8. South America Waterproofing Chemicals Market Analysis, Insights and Forecast, 2021-2033
- 8.1. Market Analysis, Insights and Forecast - by End Use Sector
- 8.1.1. Commercial
- 8.1.2. Industrial and Institutional
- 8.1.3. Infrastructure
- 8.1.4. Residential
- 8.2. Market Analysis, Insights and Forecast - by Technology
- 8.2.1. Epoxy-based
- 8.2.2. Polyurethane-based
- 8.2.3. Water-based
- 8.2.4. Other Technologies
- 8.1. Market Analysis, Insights and Forecast - by End Use Sector
- 9. Europe Waterproofing Chemicals Market Analysis, Insights and Forecast, 2021-2033
- 9.1. Market Analysis, Insights and Forecast - by End Use Sector
- 9.1.1. Commercial
- 9.1.2. Industrial and Institutional
- 9.1.3. Infrastructure
- 9.1.4. Residential
- 9.2. Market Analysis, Insights and Forecast - by Technology
- 9.2.1. Epoxy-based
- 9.2.2. Polyurethane-based
- 9.2.3. Water-based
- 9.2.4. Other Technologies
- 9.1. Market Analysis, Insights and Forecast - by End Use Sector
- 10. Middle East & Africa Waterproofing Chemicals Market Analysis, Insights and Forecast, 2021-2033
- 10.1. Market Analysis, Insights and Forecast - by End Use Sector
- 10.1.1. Commercial
- 10.1.2. Industrial and Institutional
- 10.1.3. Infrastructure
- 10.1.4. Residential
- 10.2. Market Analysis, Insights and Forecast - by Technology
- 10.2.1. Epoxy-based
- 10.2.2. Polyurethane-based
- 10.2.3. Water-based
- 10.2.4. Other Technologies
- 10.1. Market Analysis, Insights and Forecast - by End Use Sector
- 11. Asia Pacific Waterproofing Chemicals Market Analysis, Insights and Forecast, 2021-2033
- 11.1. Market Analysis, Insights and Forecast - by End Use Sector
- 11.1.1. Commercial
- 11.1.2. Industrial and Institutional
- 11.1.3. Infrastructure
- 11.1.4. Residential
- 11.2. Market Analysis, Insights and Forecast - by Technology
- 11.2.1. Epoxy-based
- 11.2.2. Polyurethane-based
- 11.2.3. Water-based
- 11.2.4. Other Technologies
- 11.1. Market Analysis, Insights and Forecast - by End Use Sector
- 12. Competitive Analysis
- 12.1. Company Profiles
- 12.1.1 Hongyuan Waterproof Technology Group Co Ltd
- 12.1.1.1. Company Overview
- 12.1.1.2. Products
- 12.1.1.3. Company Financials
- 12.1.1.4. SWOT Analysis
- 12.1.2 Saint-Gobain
- 12.1.2.1. Company Overview
- 12.1.2.2. Products
- 12.1.2.3. Company Financials
- 12.1.2.4. SWOT Analysis
- 12.1.3 Soprema
- 12.1.3.1. Company Overview
- 12.1.3.2. Products
- 12.1.3.3. Company Financials
- 12.1.3.4. SWOT Analysis
- 12.1.4 Fosroc Inc
- 12.1.4.1. Company Overview
- 12.1.4.2. Products
- 12.1.4.3. Company Financials
- 12.1.4.4. SWOT Analysis
- 12.1.5 Ardex Group
- 12.1.5.1. Company Overview
- 12.1.5.2. Products
- 12.1.5.3. Company Financials
- 12.1.5.4. SWOT Analysis
- 12.1.6 MAPEI S p A
- 12.1.6.1. Company Overview
- 12.1.6.2. Products
- 12.1.6.3. Company Financials
- 12.1.6.4. SWOT Analysis
- 12.1.7 Sika AG
- 12.1.7.1. Company Overview
- 12.1.7.2. Products
- 12.1.7.3. Company Financials
- 12.1.7.4. SWOT Analysis
- 12.1.8 Keshun Waterproof Technology Co ltd
- 12.1.8.1. Company Overview
- 12.1.8.2. Products
- 12.1.8.3. Company Financials
- 12.1.8.4. SWOT Analysis
- 12.1.9 Standard Industries Inc
- 12.1.9.1. Company Overview
- 12.1.9.2. Products
- 12.1.9.3. Company Financials
- 12.1.9.4. SWOT Analysis
- 12.1.10 Oriental Yuhong
- 12.1.10.1. Company Overview
- 12.1.10.2. Products
- 12.1.10.3. Company Financials
- 12.1.10.4. SWOT Analysis
- 12.1.1 Hongyuan Waterproof Technology Group Co Ltd
- 12.2. Market Entropy
- 12.2.1 Company's Key Areas Served
- 12.2.2 Recent Developments
- 12.3. Company Market Share Analysis 2025
- 12.3.1 Top 5 Companies Market Share Analysis
- 12.3.2 Top 3 Companies Market Share Analysis
- 12.4. List of Potential Customers
- 13. Research Methodology
List of Figures
- Figure 1: Global Waterproofing Chemicals Market Revenue Breakdown (billion, %) by Region 2025 & 2033
- Figure 2: Global Waterproofing Chemicals Market Volume Breakdown (K Tons, %) by Region 2025 & 2033
- Figure 3: North America Waterproofing Chemicals Market Revenue (billion), by End Use Sector 2025 & 2033
- Figure 4: North America Waterproofing Chemicals Market Volume (K Tons), by End Use Sector 2025 & 2033
- Figure 5: North America Waterproofing Chemicals Market Revenue Share (%), by End Use Sector 2025 & 2033
- Figure 6: North America Waterproofing Chemicals Market Volume Share (%), by End Use Sector 2025 & 2033
- Figure 7: North America Waterproofing Chemicals Market Revenue (billion), by Technology 2025 & 2033
- Figure 8: North America Waterproofing Chemicals Market Volume (K Tons), by Technology 2025 & 2033
- Figure 9: North America Waterproofing Chemicals Market Revenue Share (%), by Technology 2025 & 2033
- Figure 10: North America Waterproofing Chemicals Market Volume Share (%), by Technology 2025 & 2033
- Figure 11: North America Waterproofing Chemicals Market Revenue (billion), by Country 2025 & 2033
- Figure 12: North America Waterproofing Chemicals Market Volume (K Tons), by Country 2025 & 2033
- Figure 13: North America Waterproofing Chemicals Market Revenue Share (%), by Country 2025 & 2033
- Figure 14: North America Waterproofing Chemicals Market Volume Share (%), by Country 2025 & 2033
- Figure 15: South America Waterproofing Chemicals Market Revenue (billion), by End Use Sector 2025 & 2033
- Figure 16: South America Waterproofing Chemicals Market Volume (K Tons), by End Use Sector 2025 & 2033
- Figure 17: South America Waterproofing Chemicals Market Revenue Share (%), by End Use Sector 2025 & 2033
- Figure 18: South America Waterproofing Chemicals Market Volume Share (%), by End Use Sector 2025 & 2033
- Figure 19: South America Waterproofing Chemicals Market Revenue (billion), by Technology 2025 & 2033
- Figure 20: South America Waterproofing Chemicals Market Volume (K Tons), by Technology 2025 & 2033
- Figure 21: South America Waterproofing Chemicals Market Revenue Share (%), by Technology 2025 & 2033
- Figure 22: South America Waterproofing Chemicals Market Volume Share (%), by Technology 2025 & 2033
- Figure 23: South America Waterproofing Chemicals Market Revenue (billion), by Country 2025 & 2033
- Figure 24: South America Waterproofing Chemicals Market Volume (K Tons), by Country 2025 & 2033
- Figure 25: South America Waterproofing Chemicals Market Revenue Share (%), by Country 2025 & 2033
- Figure 26: South America Waterproofing Chemicals Market Volume Share (%), by Country 2025 & 2033
- Figure 27: Europe Waterproofing Chemicals Market Revenue (billion), by End Use Sector 2025 & 2033
- Figure 28: Europe Waterproofing Chemicals Market Volume (K Tons), by End Use Sector 2025 & 2033
- Figure 29: Europe Waterproofing Chemicals Market Revenue Share (%), by End Use Sector 2025 & 2033
- Figure 30: Europe Waterproofing Chemicals Market Volume Share (%), by End Use Sector 2025 & 2033
- Figure 31: Europe Waterproofing Chemicals Market Revenue (billion), by Technology 2025 & 2033
- Figure 32: Europe Waterproofing Chemicals Market Volume (K Tons), by Technology 2025 & 2033
- Figure 33: Europe Waterproofing Chemicals Market Revenue Share (%), by Technology 2025 & 2033
- Figure 34: Europe Waterproofing Chemicals Market Volume Share (%), by Technology 2025 & 2033
- Figure 35: Europe Waterproofing Chemicals Market Revenue (billion), by Country 2025 & 2033
- Figure 36: Europe Waterproofing Chemicals Market Volume (K Tons), by Country 2025 & 2033
- Figure 37: Europe Waterproofing Chemicals Market Revenue Share (%), by Country 2025 & 2033
- Figure 38: Europe Waterproofing Chemicals Market Volume Share (%), by Country 2025 & 2033
- Figure 39: Middle East & Africa Waterproofing Chemicals Market Revenue (billion), by End Use Sector 2025 & 2033
- Figure 40: Middle East & Africa Waterproofing Chemicals Market Volume (K Tons), by End Use Sector 2025 & 2033
- Figure 41: Middle East & Africa Waterproofing Chemicals Market Revenue Share (%), by End Use Sector 2025 & 2033
- Figure 42: Middle East & Africa Waterproofing Chemicals Market Volume Share (%), by End Use Sector 2025 & 2033
- Figure 43: Middle East & Africa Waterproofing Chemicals Market Revenue (billion), by Technology 2025 & 2033
- Figure 44: Middle East & Africa Waterproofing Chemicals Market Volume (K Tons), by Technology 2025 & 2033
- Figure 45: Middle East & Africa Waterproofing Chemicals Market Revenue Share (%), by Technology 2025 & 2033
- Figure 46: Middle East & Africa Waterproofing Chemicals Market Volume Share (%), by Technology 2025 & 2033
- Figure 47: Middle East & Africa Waterproofing Chemicals Market Revenue (billion), by Country 2025 & 2033
- Figure 48: Middle East & Africa Waterproofing Chemicals Market Volume (K Tons), by Country 2025 & 2033
- Figure 49: Middle East & Africa Waterproofing Chemicals Market Revenue Share (%), by Country 2025 & 2033
- Figure 50: Middle East & Africa Waterproofing Chemicals Market Volume Share (%), by Country 2025 & 2033
- Figure 51: Asia Pacific Waterproofing Chemicals Market Revenue (billion), by End Use Sector 2025 & 2033
- Figure 52: Asia Pacific Waterproofing Chemicals Market Volume (K Tons), by End Use Sector 2025 & 2033
- Figure 53: Asia Pacific Waterproofing Chemicals Market Revenue Share (%), by End Use Sector 2025 & 2033
- Figure 54: Asia Pacific Waterproofing Chemicals Market Volume Share (%), by End Use Sector 2025 & 2033
- Figure 55: Asia Pacific Waterproofing Chemicals Market Revenue (billion), by Technology 2025 & 2033
- Figure 56: Asia Pacific Waterproofing Chemicals Market Volume (K Tons), by Technology 2025 & 2033
- Figure 57: Asia Pacific Waterproofing Chemicals Market Revenue Share (%), by Technology 2025 & 2033
- Figure 58: Asia Pacific Waterproofing Chemicals Market Volume Share (%), by Technology 2025 & 2033
- Figure 59: Asia Pacific Waterproofing Chemicals Market Revenue (billion), by Country 2025 & 2033
- Figure 60: Asia Pacific Waterproofing Chemicals Market Volume (K Tons), by Country 2025 & 2033
- Figure 61: Asia Pacific Waterproofing Chemicals Market Revenue Share (%), by Country 2025 & 2033
- Figure 62: Asia Pacific Waterproofing Chemicals Market Volume Share (%), by Country 2025 & 2033
List of Tables
- Table 1: Global Waterproofing Chemicals Market Revenue billion Forecast, by End Use Sector 2020 & 2033
- Table 2: Global Waterproofing Chemicals Market Volume K Tons Forecast, by End Use Sector 2020 & 2033
- Table 3: Global Waterproofing Chemicals Market Revenue billion Forecast, by Technology 2020 & 2033
- Table 4: Global Waterproofing Chemicals Market Volume K Tons Forecast, by Technology 2020 & 2033
- Table 5: Global Waterproofing Chemicals Market Revenue billion Forecast, by Region 2020 & 2033
- Table 6: Global Waterproofing Chemicals Market Volume K Tons Forecast, by Region 2020 & 2033
- Table 7: Global Waterproofing Chemicals Market Revenue billion Forecast, by End Use Sector 2020 & 2033
- Table 8: Global Waterproofing Chemicals Market Volume K Tons Forecast, by End Use Sector 2020 & 2033
- Table 9: Global Waterproofing Chemicals Market Revenue billion Forecast, by Technology 2020 & 2033
- Table 10: Global Waterproofing Chemicals Market Volume K Tons Forecast, by Technology 2020 & 2033
- Table 11: Global Waterproofing Chemicals Market Revenue billion Forecast, by Country 2020 & 2033
- Table 12: Global Waterproofing Chemicals Market Volume K Tons Forecast, by Country 2020 & 2033
- Table 13: United States Waterproofing Chemicals Market Revenue (billion) Forecast, by Application 2020 & 2033
- Table 14: United States Waterproofing Chemicals Market Volume (K Tons) Forecast, by Application 2020 & 2033
- Table 15: Canada Waterproofing Chemicals Market Revenue (billion) Forecast, by Application 2020 & 2033
- Table 16: Canada Waterproofing Chemicals Market Volume (K Tons) Forecast, by Application 2020 & 2033
- Table 17: Mexico Waterproofing Chemicals Market Revenue (billion) Forecast, by Application 2020 & 2033
- Table 18: Mexico Waterproofing Chemicals Market Volume (K Tons) Forecast, by Application 2020 & 2033
- Table 19: Global Waterproofing Chemicals Market Revenue billion Forecast, by End Use Sector 2020 & 2033
- Table 20: Global Waterproofing Chemicals Market Volume K Tons Forecast, by End Use Sector 2020 & 2033
- Table 21: Global Waterproofing Chemicals Market Revenue billion Forecast, by Technology 2020 & 2033
- Table 22: Global Waterproofing Chemicals Market Volume K Tons Forecast, by Technology 2020 & 2033
- Table 23: Global Waterproofing Chemicals Market Revenue billion Forecast, by Country 2020 & 2033
- Table 24: Global Waterproofing Chemicals Market Volume K Tons Forecast, by Country 2020 & 2033
- Table 25: Brazil Waterproofing Chemicals Market Revenue (billion) Forecast, by Application 2020 & 2033
- Table 26: Brazil Waterproofing Chemicals Market Volume (K Tons) Forecast, by Application 2020 & 2033
- Table 27: Argentina Waterproofing Chemicals Market Revenue (billion) Forecast, by Application 2020 & 2033
- Table 28: Argentina Waterproofing Chemicals Market Volume (K Tons) Forecast, by Application 2020 & 2033
- Table 29: Rest of South America Waterproofing Chemicals Market Revenue (billion) Forecast, by Application 2020 & 2033
- Table 30: Rest of South America Waterproofing Chemicals Market Volume (K Tons) Forecast, by Application 2020 & 2033
- Table 31: Global Waterproofing Chemicals Market Revenue billion Forecast, by End Use Sector 2020 & 2033
- Table 32: Global Waterproofing Chemicals Market Volume K Tons Forecast, by End Use Sector 2020 & 2033
- Table 33: Global Waterproofing Chemicals Market Revenue billion Forecast, by Technology 2020 & 2033
- Table 34: Global Waterproofing Chemicals Market Volume K Tons Forecast, by Technology 2020 & 2033
- Table 35: Global Waterproofing Chemicals Market Revenue billion Forecast, by Country 2020 & 2033
- Table 36: Global Waterproofing Chemicals Market Volume K Tons Forecast, by Country 2020 & 2033
- Table 37: United Kingdom Waterproofing Chemicals Market Revenue (billion) Forecast, by Application 2020 & 2033
- Table 38: United Kingdom Waterproofing Chemicals Market Volume (K Tons) Forecast, by Application 2020 & 2033
- Table 39: Germany Waterproofing Chemicals Market Revenue (billion) Forecast, by Application 2020 & 2033
- Table 40: Germany Waterproofing Chemicals Market Volume (K Tons) Forecast, by Application 2020 & 2033
- Table 41: France Waterproofing Chemicals Market Revenue (billion) Forecast, by Application 2020 & 2033
- Table 42: France Waterproofing Chemicals Market Volume (K Tons) Forecast, by Application 2020 & 2033
- Table 43: Italy Waterproofing Chemicals Market Revenue (billion) Forecast, by Application 2020 & 2033
- Table 44: Italy Waterproofing Chemicals Market Volume (K Tons) Forecast, by Application 2020 & 2033
- Table 45: Spain Waterproofing Chemicals Market Revenue (billion) Forecast, by Application 2020 & 2033
- Table 46: Spain Waterproofing Chemicals Market Volume (K Tons) Forecast, by Application 2020 & 2033
- Table 47: Russia Waterproofing Chemicals Market Revenue (billion) Forecast, by Application 2020 & 2033
- Table 48: Russia Waterproofing Chemicals Market Volume (K Tons) Forecast, by Application 2020 & 2033
- Table 49: Benelux Waterproofing Chemicals Market Revenue (billion) Forecast, by Application 2020 & 2033
- Table 50: Benelux Waterproofing Chemicals Market Volume (K Tons) Forecast, by Application 2020 & 2033
- Table 51: Nordics Waterproofing Chemicals Market Revenue (billion) Forecast, by Application 2020 & 2033
- Table 52: Nordics Waterproofing Chemicals Market Volume (K Tons) Forecast, by Application 2020 & 2033
- Table 53: Rest of Europe Waterproofing Chemicals Market Revenue (billion) Forecast, by Application 2020 & 2033
- Table 54: Rest of Europe Waterproofing Chemicals Market Volume (K Tons) Forecast, by Application 2020 & 2033
- Table 55: Global Waterproofing Chemicals Market Revenue billion Forecast, by End Use Sector 2020 & 2033
- Table 56: Global Waterproofing Chemicals Market Volume K Tons Forecast, by End Use Sector 2020 & 2033
- Table 57: Global Waterproofing Chemicals Market Revenue billion Forecast, by Technology 2020 & 2033
- Table 58: Global Waterproofing Chemicals Market Volume K Tons Forecast, by Technology 2020 & 2033
- Table 59: Global Waterproofing Chemicals Market Revenue billion Forecast, by Country 2020 & 2033
- Table 60: Global Waterproofing Chemicals Market Volume K Tons Forecast, by Country 2020 & 2033
- Table 61: Turkey Waterproofing Chemicals Market Revenue (billion) Forecast, by Application 2020 & 2033
- Table 62: Turkey Waterproofing Chemicals Market Volume (K Tons) Forecast, by Application 2020 & 2033
- Table 63: Israel Waterproofing Chemicals Market Revenue (billion) Forecast, by Application 2020 & 2033
- Table 64: Israel Waterproofing Chemicals Market Volume (K Tons) Forecast, by Application 2020 & 2033
- Table 65: GCC Waterproofing Chemicals Market Revenue (billion) Forecast, by Application 2020 & 2033
- Table 66: GCC Waterproofing Chemicals Market Volume (K Tons) Forecast, by Application 2020 & 2033
- Table 67: North Africa Waterproofing Chemicals Market Revenue (billion) Forecast, by Application 2020 & 2033
- Table 68: North Africa Waterproofing Chemicals Market Volume (K Tons) Forecast, by Application 2020 & 2033
- Table 69: South Africa Waterproofing Chemicals Market Revenue (billion) Forecast, by Application 2020 & 2033
- Table 70: South Africa Waterproofing Chemicals Market Volume (K Tons) Forecast, by Application 2020 & 2033
- Table 71: Rest of Middle East & Africa Waterproofing Chemicals Market Revenue (billion) Forecast, by Application 2020 & 2033
- Table 72: Rest of Middle East & Africa Waterproofing Chemicals Market Volume (K Tons) Forecast, by Application 2020 & 2033
- Table 73: Global Waterproofing Chemicals Market Revenue billion Forecast, by End Use Sector 2020 & 2033
- Table 74: Global Waterproofing Chemicals Market Volume K Tons Forecast, by End Use Sector 2020 & 2033
- Table 75: Global Waterproofing Chemicals Market Revenue billion Forecast, by Technology 2020 & 2033
- Table 76: Global Waterproofing Chemicals Market Volume K Tons Forecast, by Technology 2020 & 2033
- Table 77: Global Waterproofing Chemicals Market Revenue billion Forecast, by Country 2020 & 2033
- Table 78: Global Waterproofing Chemicals Market Volume K Tons Forecast, by Country 2020 & 2033
- Table 79: China Waterproofing Chemicals Market Revenue (billion) Forecast, by Application 2020 & 2033
- Table 80: China Waterproofing Chemicals Market Volume (K Tons) Forecast, by Application 2020 & 2033
- Table 81: India Waterproofing Chemicals Market Revenue (billion) Forecast, by Application 2020 & 2033
- Table 82: India Waterproofing Chemicals Market Volume (K Tons) Forecast, by Application 2020 & 2033
- Table 83: Japan Waterproofing Chemicals Market Revenue (billion) Forecast, by Application 2020 & 2033
- Table 84: Japan Waterproofing Chemicals Market Volume (K Tons) Forecast, by Application 2020 & 2033
- Table 85: South Korea Waterproofing Chemicals Market Revenue (billion) Forecast, by Application 2020 & 2033
- Table 86: South Korea Waterproofing Chemicals Market Volume (K Tons) Forecast, by Application 2020 & 2033
- Table 87: ASEAN Waterproofing Chemicals Market Revenue (billion) Forecast, by Application 2020 & 2033
- Table 88: ASEAN Waterproofing Chemicals Market Volume (K Tons) Forecast, by Application 2020 & 2033
- Table 89: Oceania Waterproofing Chemicals Market Revenue (billion) Forecast, by Application 2020 & 2033
- Table 90: Oceania Waterproofing Chemicals Market Volume (K Tons) Forecast, by Application 2020 & 2033
- Table 91: Rest of Asia Pacific Waterproofing Chemicals Market Revenue (billion) Forecast, by Application 2020 & 2033
- Table 92: Rest of Asia Pacific Waterproofing Chemicals Market Volume (K Tons) Forecast, by Application 2020 & 2033
Frequently Asked Questions
1. What is the projected Compound Annual Growth Rate (CAGR) of the Waterproofing Chemicals Market?
The projected CAGR is approximately 9.88%.
2. Which companies are prominent players in the Waterproofing Chemicals Market?
Key companies in the market include Hongyuan Waterproof Technology Group Co Ltd, Saint-Gobain, Soprema, Fosroc Inc, Ardex Group, MAPEI S p A, Sika AG, Keshun Waterproof Technology Co ltd, Standard Industries Inc, Oriental Yuhong.
3. What are the main segments of the Waterproofing Chemicals Market?
The market segments include End Use Sector, Technology.
4. Can you provide details about the market size?
The market size is estimated to be USD 22.58 billion as of 2022.
5. What are some drivers contributing to market growth?
; Banning/ Limiting Use of Plastics used in packaging applications.
6. What are the notable trends driving market growth?
OTHER KEY INDUSTRY TRENDS COVERED IN THE REPORT.
7. Are there any restraints impacting market growth?
; Harmful Amines in Dyes; Paperless Green Initiatives.
8. Can you provide examples of recent developments in the market?
November 2022: MAPEI invested in its German subsidiary, Sopro Bauchemie, which manufactures concrete admixtures, anchors & grouts, dry-mix mortars, and waterproofing solutions, to expand its production capacity and upgrade its research and development facilities.May 2022: Sika AG recently completed its acquisition of United Gilsonite Laboratories, a company based in the United States. This move was aimed at bolstering Sika AG's range of waterproofing solutions within the US market.January 2022: SOPREMA has developed a next-generation waterproofing chemical called Alsan Flashing Neo, which can waterproof any substrate without a primer.
9. What pricing options are available for accessing the report?
Pricing options include single-user, multi-user, and enterprise licenses priced at USD 3800, USD 4500, and USD 5800 respectively.
10. Is the market size provided in terms of value or volume?
The market size is provided in terms of value, measured in billion and volume, measured in K Tons.
11. Are there any specific market keywords associated with the report?
Yes, the market keyword associated with the report is "Waterproofing Chemicals Market," which aids in identifying and referencing the specific market segment covered.
12. How do I determine which pricing option suits my needs best?
The pricing options vary based on user requirements and access needs. Individual users may opt for single-user licenses, while businesses requiring broader access may choose multi-user or enterprise licenses for cost-effective access to the report.
13. Are there any additional resources or data provided in the Waterproofing Chemicals Market report?
While the report offers comprehensive insights, it's advisable to review the specific contents or supplementary materials provided to ascertain if additional resources or data are available.
14. How can I stay updated on further developments or reports in the Waterproofing Chemicals Market?
To stay informed about further developments, trends, and reports in the Waterproofing Chemicals Market, consider subscribing to industry newsletters, following relevant companies and organizations, or regularly checking reputable industry news sources and publications.
Methodology
Step 1 - Identification of Relevant Samples Size from Population Database


Step 2 - Approaches for Defining Global Market Size (Value, Volume* & Price*)

Note*: In applicable scenarios
Step 3 - Data Sources
Primary Research
- Web Analytics
- Survey Reports
- Research Institute
- Latest Research Reports
- Opinion Leaders
Secondary Research
- Annual Reports
- White Paper
- Latest Press Release
- Industry Association
- Paid Database
- Investor Presentations

Step 4 - Data Triangulation
Involves using different sources of information in order to increase the validity of a study
These sources are likely to be stakeholders in a program - participants, other researchers, program staff, other community members, and so on.
Then we put all data in single framework & apply various statistical tools to find out the dynamic on the market.
During the analysis stage, feedback from the stakeholder groups would be compared to determine areas of agreement as well as areas of divergence