

Key Insights
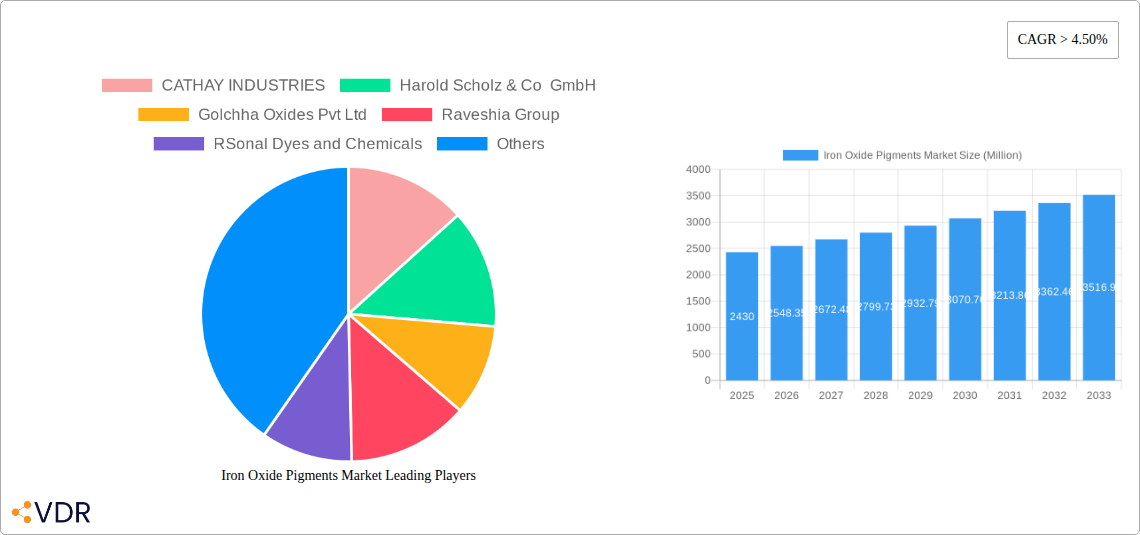
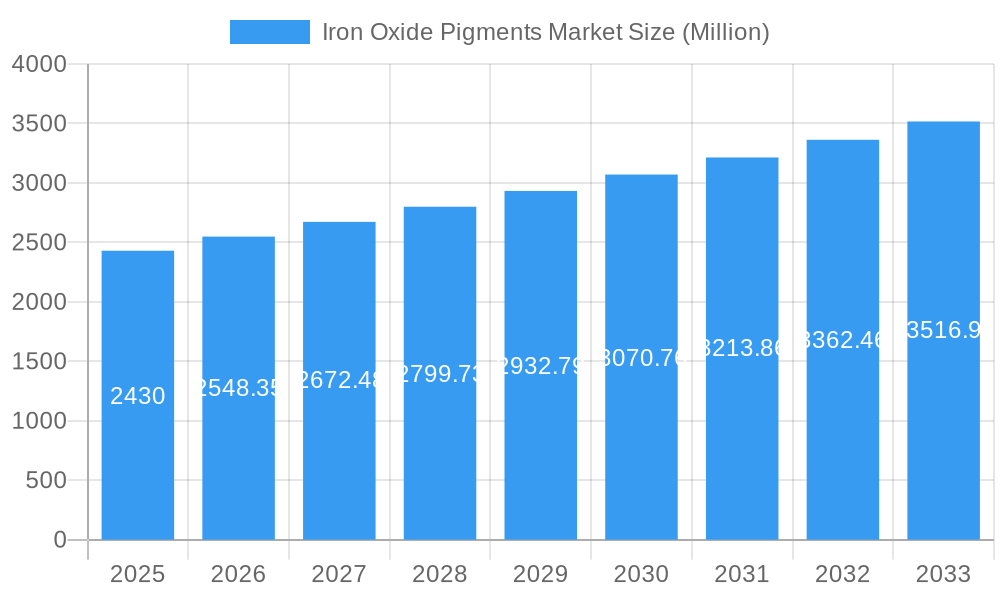
The global Iron Oxide Pigments market, valued at $2.43 billion in 2025, is projected to experience robust growth, exceeding a 4.50% CAGR throughout the forecast period (2025-2033). This expansion is driven by several key factors. The increasing demand from the construction industry, particularly in developing economies experiencing rapid urbanization and infrastructure development, significantly fuels market growth. The paints and coatings sector, a major consumer of iron oxide pigments, also contributes substantially, propelled by rising global construction activity and a growing preference for aesthetically pleasing and durable finishes. Furthermore, advancements in pigment technology, leading to improved color consistency, weather resistance, and enhanced performance characteristics, are widening the application scope of these pigments in various industries, including plastics, paper, and pharmaceuticals. The growing adoption of sustainable and eco-friendly practices within these sectors further boosts the demand for natural iron oxide pigments.
Iron Oxide Pigments Market Market Size (In Billion)
However, certain challenges restrain market growth. Fluctuations in raw material prices, primarily iron ore, can impact the overall cost of production and profitability. Stringent environmental regulations regarding pigment disposal and manufacturing processes also present hurdles for market players. Competition from alternative colorants and the potential for substitute materials could also affect future market growth. Nevertheless, the overall outlook remains positive, driven by the robust growth of key end-user industries and ongoing technological innovations that address environmental concerns and improve product performance. The market is segmented by product type (natural, synthetic), color (red, yellow, black, others), and end-user industry (building & construction, paints & coatings, plastics, paper, pharmaceuticals, others), offering diverse opportunities for market participants. Geographic expansion, particularly in the Asia-Pacific region, driven by strong economic growth and infrastructure development in countries like China and India, presents significant growth potential.
Iron Oxide Pigments Market Company Market Share
Iron Oxide Pigments Market: A Comprehensive Market Report (2019-2033)
This comprehensive report provides an in-depth analysis of the Iron Oxide Pigments market, encompassing its dynamics, growth trends, regional segmentation, product landscape, key players, and future outlook. The study covers the period from 2019 to 2033, with 2025 serving as the base and estimated year. This report is crucial for industry professionals, investors, and researchers seeking a thorough understanding of this vital market segment within the broader pigments and coatings industry. The market value is projected to reach xx Million by 2033.
Iron Oxide Pigments Market Dynamics & Structure
This section analyzes the market structure, concentration, and key influencing factors. The Iron Oxide Pigments market is characterized by a moderately concentrated landscape, with several major players holding significant market share. However, the presence of numerous smaller regional players adds complexity. Technological innovation, particularly in the development of sustainable and high-performance pigments, is a significant growth driver. Regulatory frameworks concerning environmental impact and safety standards play a crucial role in shaping market dynamics. The market also faces competition from alternative colorants, but the superior properties and cost-effectiveness of iron oxide pigments often maintain their dominance. Furthermore, M&A activity, as exemplified by recent Cathay Industries acquisitions, significantly impacts market consolidation and global reach.
- Market Concentration: Moderately concentrated, with top 5 players holding approximately xx% market share in 2024.
- Technological Innovation: Focus on eco-friendly production methods and enhanced pigment performance drives growth.
- Regulatory Landscape: Stringent environmental regulations influence production and consumption patterns.
- Competitive Substitutes: Competition exists from organic and inorganic pigments, but iron oxides maintain a strong market position due to their cost-effectiveness and versatility.
- M&A Activity: Recent mergers and acquisitions, such as Cathay Industries’ acquisition of Venator Materials' iron oxide pigment business, reshape market structure and competitive dynamics. xx M&A deals were recorded between 2019 and 2024.
- End-User Demographics: Growth is driven by increasing demand from building & construction, paints & coatings sectors, and expansion into niche applications.
Iron Oxide Pigments Market Growth Trends & Insights
The Iron Oxide Pigments market has witnessed significant growth during the historical period (2019-2024), driven by robust demand from key end-user industries. The market size expanded from xx Million in 2019 to xx Million in 2024, exhibiting a CAGR of xx%. This growth is projected to continue during the forecast period (2025-2033), with a projected CAGR of xx%, reaching xx Million by 2033. Technological advancements, focusing on improved pigment properties like color strength and dispersion, are contributing to increased adoption rates. Changing consumer preferences towards sustainable and eco-friendly products are influencing product development and market penetration.
Dominant Regions, Countries, or Segments in Iron Oxide Pigments Market
The Asia-Pacific region currently holds the largest market share, driven by rapid infrastructure development and robust growth in the building and construction sector. Within this region, China and India are key growth drivers. The synthetic iron oxide segment dominates the product type category due to its superior properties and wider application range. In terms of color, red and yellow iron oxides account for the largest market share, followed by black and other colors.
- Leading Region: Asia-Pacific, fueled by construction boom and industrial expansion.
- Key Countries: China and India dominate due to large-scale manufacturing and construction activities.
- Dominant Product Type: Synthetic iron oxides owing to versatility and superior performance.
- Leading Color Segment: Red and yellow iron oxides account for the largest market share due to high demand in various applications.
- Major End-User Industry: Building & Construction sector due to extensive infrastructure projects.
Iron Oxide Pigments Market Product Landscape
The Iron Oxide Pigments market offers a range of products categorized by color (red, yellow, black, and other colors) and type (natural and synthetic). Synthetic iron oxides are engineered for superior color consistency, dispersion, and performance characteristics, catering to high-performance applications in paints and coatings. Natural iron oxides are gaining traction in niche markets seeking sustainable and eco-friendly solutions. Recent innovations focus on nano-sized pigments and specialized surface treatments to enhance performance and durability. Unique selling propositions include superior color intensity, weather resistance, and ease of dispersion.
Key Drivers, Barriers & Challenges in Iron Oxide Pigments Market
Key Drivers:
- Growing demand from the construction industry due to global infrastructure development.
- Increasing adoption in paints and coatings due to their cost-effectiveness and vibrant colors.
- Technological advancements resulting in improved pigment properties and performance.
Key Challenges:
- Fluctuations in raw material prices impacting production costs.
- Stringent environmental regulations requiring adherence to sustainable manufacturing practices.
- Intense competition among manufacturers leading to price pressure. Estimated price pressure resulted in a xx% reduction in average profit margins in 2024.
Emerging Opportunities in Iron Oxide Pigments Market
- Expanding applications in high-performance coatings, plastics, and other niche industries.
- Development of bio-based and sustainable iron oxide pigments catering to growing environmental concerns.
- Penetration into emerging markets, particularly in developing economies, with robust infrastructural growth.
Growth Accelerators in the Iron Oxide Pigments Market Industry
Long-term growth is driven by continuous technological advancements leading to improved pigment properties, strategic partnerships fostering innovation and market access, and strategic market expansion into new geographic regions and end-use applications. The development of specialized iron oxide pigments for niche applications will be a significant growth catalyst.
Key Players Shaping the Iron Oxide Pigments Market Market
- CATHAY INDUSTRIES
- Harold Scholz & Co GmbH
- Golchha Oxides Pvt Ltd
- Raveshia Group
- RSonl Dyes and Chemicals
- Xinxiang Rongbo Pigment Science & Technology Co Ltd
- Proquimac
- YIPIN PIGMENTS
- APPLIED MINERALS INC
- Jiangsu Yuxing Industry and Trade Co Ltd
- Precheza
- Chemipol (Kothari Group Of Industries)
- Tata Pigments Limited
- BASF SE
- SHENGHUA GROUP DEQING HUAYUAN PIGMENT CO LTD
Notable Milestones in Iron Oxide Pigments Market Sector
- November 2022: Cathay Industries acquired Venator Materials PLC's iron oxide pigment business, expanding its global footprint significantly.
- December 2022: Cathay Industries commissioned a new iron oxide pigment finishing and blending facility in Batam, Indonesia, further strengthening its production capacity.
In-Depth Iron Oxide Pigments Market Market Outlook
The Iron Oxide Pigments market is poised for continued robust growth, driven by technological innovation, sustainable product development, and expanding applications across various industries. Strategic partnerships and focused expansion into high-growth markets will be key to capturing the significant market potential during the forecast period. The focus on environmentally friendly and high-performance products will shape future market dynamics and open lucrative opportunities for key players.
Iron Oxide Pigments Market Segmentation
-
1. Product Type
- 1.1. Natural
- 1.2. Synthetic
-
2. Color
- 2.1. Red
- 2.2. Yellow
- 2.3. Black
- 2.4. Other Colors
-
3. End-user Industry
- 3.1. Building and Construction
- 3.2. Paints and Coatings
- 3.3. Plastics
- 3.4. Paper
- 3.5. Pharmaceutical
- 3.6. Other End-user Industries
Iron Oxide Pigments Market Segmentation By Geography
-
1. Asia Pacific
- 1.1. China
- 1.2. India
- 1.3. Japan
- 1.4. South Korea
- 1.5. Rest of Asia Pacific
-
2. North America
- 2.1. United States
- 2.2. Canada
- 2.3. Mexico
-
3. Europe
- 3.1. Germany
- 3.2. United Kingdom
- 3.3. Italy
- 3.4. France
- 3.5. Rest of Europe
-
4. South America
- 4.1. Brazil
- 4.2. Argentina
- 4.3. Rest of South America
-
5. Middle East and Africa
- 5.1. Saudi Arabia
- 5.2. South Africa
- 5.3. Rest of Middle East and Africa
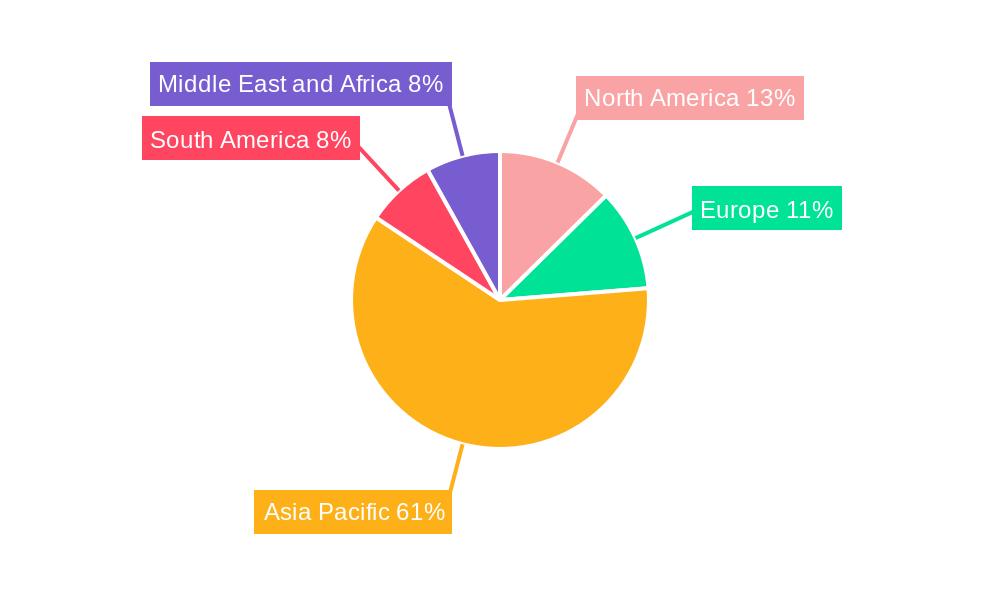
Iron Oxide Pigments Market Regional Market Share
Geographic Coverage of Iron Oxide Pigments Market
Iron Oxide Pigments Market REPORT HIGHLIGHTS
| Aspects | Details |
|---|---|
| Study Period | 2020-2034 |
| Base Year | 2025 |
| Estimated Year | 2026 |
| Forecast Period | 2026-2034 |
| Historical Period | 2020-2025 |
| Growth Rate | CAGR of 4.5% from 2020-2034 |
| Segmentation |
|
Table of Contents
- 1. Introduction
- 1.1. Research Scope
- 1.2. Market Segmentation
- 1.3. Research Objective
- 1.4. Definitions and Assumptions
- 2. Executive Summary
- 2.1. Market Snapshot
- 3. Market Dynamics
- 3.1. Market Drivers
- 3.2. Market Restrains
- 3.3. Market Trends
- 3.4. Market Opportunities
- 4. Market Factor Analysis
- 4.1. Porters Five Forces
- 4.1.1. Bargaining Power of Suppliers
- 4.1.2. Bargaining Power of Buyers
- 4.1.3. Threat of New Entrants
- 4.1.4. Threat of Substitutes
- 4.1.5. Competitive Rivalry
- 4.2. PESTEL analysis
- 4.3. BCG Analysis
- 4.3.1. Stars (High Growth, High Market Share)
- 4.3.2. Cash Cows (Low Growth, High Market Share)
- 4.3.3. Question Mark (High Growth, Low Market Share)
- 4.3.4. Dogs (Low Growth, Low Market Share)
- 4.4. Ansoff Matrix Analysis
- 4.5. Supply Chain Analysis
- 4.6. Regulatory Landscape
- 4.7. Current Market Potential and Opportunity Assessment (TAM–SAM–SOM Framework)
- 4.8. VDR Analyst Note
- 4.1. Porters Five Forces
- 5. Market Analysis, Insights and Forecast 2021-2033
- 5.1. Market Analysis, Insights and Forecast - by Product Type
- 5.1.1. Natural
- 5.1.2. Synthetic
- 5.2. Market Analysis, Insights and Forecast - by Color
- 5.2.1. Red
- 5.2.2. Yellow
- 5.2.3. Black
- 5.2.4. Other Colors
- 5.3. Market Analysis, Insights and Forecast - by End-user Industry
- 5.3.1. Building and Construction
- 5.3.2. Paints and Coatings
- 5.3.3. Plastics
- 5.3.4. Paper
- 5.3.5. Pharmaceutical
- 5.3.6. Other End-user Industries
- 5.4. Market Analysis, Insights and Forecast - by Region
- 5.4.1. Asia Pacific
- 5.4.2. North America
- 5.4.3. Europe
- 5.4.4. South America
- 5.4.5. Middle East and Africa
- 5.1. Market Analysis, Insights and Forecast - by Product Type
- 6. Global Iron Oxide Pigments Market Analysis, Insights and Forecast, 2021-2033
- 6.1. Market Analysis, Insights and Forecast - by Product Type
- 6.1.1. Natural
- 6.1.2. Synthetic
- 6.2. Market Analysis, Insights and Forecast - by Color
- 6.2.1. Red
- 6.2.2. Yellow
- 6.2.3. Black
- 6.2.4. Other Colors
- 6.3. Market Analysis, Insights and Forecast - by End-user Industry
- 6.3.1. Building and Construction
- 6.3.2. Paints and Coatings
- 6.3.3. Plastics
- 6.3.4. Paper
- 6.3.5. Pharmaceutical
- 6.3.6. Other End-user Industries
- 6.1. Market Analysis, Insights and Forecast - by Product Type
- 7. Asia Pacific Iron Oxide Pigments Market Analysis, Insights and Forecast, 2021-2033
- 7.1. Market Analysis, Insights and Forecast - by Product Type
- 7.1.1. Natural
- 7.1.2. Synthetic
- 7.2. Market Analysis, Insights and Forecast - by Color
- 7.2.1. Red
- 7.2.2. Yellow
- 7.2.3. Black
- 7.2.4. Other Colors
- 7.3. Market Analysis, Insights and Forecast - by End-user Industry
- 7.3.1. Building and Construction
- 7.3.2. Paints and Coatings
- 7.3.3. Plastics
- 7.3.4. Paper
- 7.3.5. Pharmaceutical
- 7.3.6. Other End-user Industries
- 7.1. Market Analysis, Insights and Forecast - by Product Type
- 8. North America Iron Oxide Pigments Market Analysis, Insights and Forecast, 2021-2033
- 8.1. Market Analysis, Insights and Forecast - by Product Type
- 8.1.1. Natural
- 8.1.2. Synthetic
- 8.2. Market Analysis, Insights and Forecast - by Color
- 8.2.1. Red
- 8.2.2. Yellow
- 8.2.3. Black
- 8.2.4. Other Colors
- 8.3. Market Analysis, Insights and Forecast - by End-user Industry
- 8.3.1. Building and Construction
- 8.3.2. Paints and Coatings
- 8.3.3. Plastics
- 8.3.4. Paper
- 8.3.5. Pharmaceutical
- 8.3.6. Other End-user Industries
- 8.1. Market Analysis, Insights and Forecast - by Product Type
- 9. Europe Iron Oxide Pigments Market Analysis, Insights and Forecast, 2021-2033
- 9.1. Market Analysis, Insights and Forecast - by Product Type
- 9.1.1. Natural
- 9.1.2. Synthetic
- 9.2. Market Analysis, Insights and Forecast - by Color
- 9.2.1. Red
- 9.2.2. Yellow
- 9.2.3. Black
- 9.2.4. Other Colors
- 9.3. Market Analysis, Insights and Forecast - by End-user Industry
- 9.3.1. Building and Construction
- 9.3.2. Paints and Coatings
- 9.3.3. Plastics
- 9.3.4. Paper
- 9.3.5. Pharmaceutical
- 9.3.6. Other End-user Industries
- 9.1. Market Analysis, Insights and Forecast - by Product Type
- 10. South America Iron Oxide Pigments Market Analysis, Insights and Forecast, 2021-2033
- 10.1. Market Analysis, Insights and Forecast - by Product Type
- 10.1.1. Natural
- 10.1.2. Synthetic
- 10.2. Market Analysis, Insights and Forecast - by Color
- 10.2.1. Red
- 10.2.2. Yellow
- 10.2.3. Black
- 10.2.4. Other Colors
- 10.3. Market Analysis, Insights and Forecast - by End-user Industry
- 10.3.1. Building and Construction
- 10.3.2. Paints and Coatings
- 10.3.3. Plastics
- 10.3.4. Paper
- 10.3.5. Pharmaceutical
- 10.3.6. Other End-user Industries
- 10.1. Market Analysis, Insights and Forecast - by Product Type
- 11. Middle East and Africa Iron Oxide Pigments Market Analysis, Insights and Forecast, 2021-2033
- 11.1. Market Analysis, Insights and Forecast - by Product Type
- 11.1.1. Natural
- 11.1.2. Synthetic
- 11.2. Market Analysis, Insights and Forecast - by Color
- 11.2.1. Red
- 11.2.2. Yellow
- 11.2.3. Black
- 11.2.4. Other Colors
- 11.3. Market Analysis, Insights and Forecast - by End-user Industry
- 11.3.1. Building and Construction
- 11.3.2. Paints and Coatings
- 11.3.3. Plastics
- 11.3.4. Paper
- 11.3.5. Pharmaceutical
- 11.3.6. Other End-user Industries
- 11.1. Market Analysis, Insights and Forecast - by Product Type
- 12. Competitive Analysis
- 12.1. Company Profiles
- 12.1.1 CATHAY INDUSTRIES
- 12.1.1.1. Company Overview
- 12.1.1.2. Products
- 12.1.1.3. Company Financials
- 12.1.1.4. SWOT Analysis
- 12.1.2 Harold Scholz & Co GmbH
- 12.1.2.1. Company Overview
- 12.1.2.2. Products
- 12.1.2.3. Company Financials
- 12.1.2.4. SWOT Analysis
- 12.1.3 Golchha Oxides Pvt Ltd
- 12.1.3.1. Company Overview
- 12.1.3.2. Products
- 12.1.3.3. Company Financials
- 12.1.3.4. SWOT Analysis
- 12.1.4 Raveshia Group
- 12.1.4.1. Company Overview
- 12.1.4.2. Products
- 12.1.4.3. Company Financials
- 12.1.4.4. SWOT Analysis
- 12.1.5 RSonal Dyes and Chemicals
- 12.1.5.1. Company Overview
- 12.1.5.2. Products
- 12.1.5.3. Company Financials
- 12.1.5.4. SWOT Analysis
- 12.1.6 Xinxiang Rongbo Pigment Science & Technology Co Ltd
- 12.1.6.1. Company Overview
- 12.1.6.2. Products
- 12.1.6.3. Company Financials
- 12.1.6.4. SWOT Analysis
- 12.1.7 Proquimac
- 12.1.7.1. Company Overview
- 12.1.7.2. Products
- 12.1.7.3. Company Financials
- 12.1.7.4. SWOT Analysis
- 12.1.8 YIPIN PIGMENTS*List Not Exhaustive
- 12.1.8.1. Company Overview
- 12.1.8.2. Products
- 12.1.8.3. Company Financials
- 12.1.8.4. SWOT Analysis
- 12.1.9 APPLIED MINERALS INC
- 12.1.9.1. Company Overview
- 12.1.9.2. Products
- 12.1.9.3. Company Financials
- 12.1.9.4. SWOT Analysis
- 12.1.10 Jiangsu Yuxing Industry and Trade Co Ltd
- 12.1.10.1. Company Overview
- 12.1.10.2. Products
- 12.1.10.3. Company Financials
- 12.1.10.4. SWOT Analysis
- 12.1.11 Precheza
- 12.1.11.1. Company Overview
- 12.1.11.2. Products
- 12.1.11.3. Company Financials
- 12.1.11.4. SWOT Analysis
- 12.1.12 Chemipol (Kothari Group Of Industries)
- 12.1.12.1. Company Overview
- 12.1.12.2. Products
- 12.1.12.3. Company Financials
- 12.1.12.4. SWOT Analysis
- 12.1.13 Tata Pigments Limited
- 12.1.13.1. Company Overview
- 12.1.13.2. Products
- 12.1.13.3. Company Financials
- 12.1.13.4. SWOT Analysis
- 12.1.14 BASF SE
- 12.1.14.1. Company Overview
- 12.1.14.2. Products
- 12.1.14.3. Company Financials
- 12.1.14.4. SWOT Analysis
- 12.1.15 SHENGHUA GROUP DEQING HUAYUAN PIGMENT CO LTD
- 12.1.15.1. Company Overview
- 12.1.15.2. Products
- 12.1.15.3. Company Financials
- 12.1.15.4. SWOT Analysis
- 12.1.1 CATHAY INDUSTRIES
- 12.2. Market Entropy
- 12.2.1 Company's Key Areas Served
- 12.2.2 Recent Developments
- 12.3. Company Market Share Analysis 2025
- 12.3.1 Top 5 Companies Market Share Analysis
- 12.3.2 Top 3 Companies Market Share Analysis
- 12.4. List of Potential Customers
- 13. Research Methodology
List of Figures
- Figure 1: Global Iron Oxide Pigments Market Revenue Breakdown (billion, %) by Region 2025 & 2033
- Figure 2: Global Iron Oxide Pigments Market Volume Breakdown (Million, %) by Region 2025 & 2033
- Figure 3: Asia Pacific Iron Oxide Pigments Market Revenue (billion), by Product Type 2025 & 2033
- Figure 4: Asia Pacific Iron Oxide Pigments Market Volume (Million), by Product Type 2025 & 2033
- Figure 5: Asia Pacific Iron Oxide Pigments Market Revenue Share (%), by Product Type 2025 & 2033
- Figure 6: Asia Pacific Iron Oxide Pigments Market Volume Share (%), by Product Type 2025 & 2033
- Figure 7: Asia Pacific Iron Oxide Pigments Market Revenue (billion), by Color 2025 & 2033
- Figure 8: Asia Pacific Iron Oxide Pigments Market Volume (Million), by Color 2025 & 2033
- Figure 9: Asia Pacific Iron Oxide Pigments Market Revenue Share (%), by Color 2025 & 2033
- Figure 10: Asia Pacific Iron Oxide Pigments Market Volume Share (%), by Color 2025 & 2033
- Figure 11: Asia Pacific Iron Oxide Pigments Market Revenue (billion), by End-user Industry 2025 & 2033
- Figure 12: Asia Pacific Iron Oxide Pigments Market Volume (Million), by End-user Industry 2025 & 2033
- Figure 13: Asia Pacific Iron Oxide Pigments Market Revenue Share (%), by End-user Industry 2025 & 2033
- Figure 14: Asia Pacific Iron Oxide Pigments Market Volume Share (%), by End-user Industry 2025 & 2033
- Figure 15: Asia Pacific Iron Oxide Pigments Market Revenue (billion), by Country 2025 & 2033
- Figure 16: Asia Pacific Iron Oxide Pigments Market Volume (Million), by Country 2025 & 2033
- Figure 17: Asia Pacific Iron Oxide Pigments Market Revenue Share (%), by Country 2025 & 2033
- Figure 18: Asia Pacific Iron Oxide Pigments Market Volume Share (%), by Country 2025 & 2033
- Figure 19: North America Iron Oxide Pigments Market Revenue (billion), by Product Type 2025 & 2033
- Figure 20: North America Iron Oxide Pigments Market Volume (Million), by Product Type 2025 & 2033
- Figure 21: North America Iron Oxide Pigments Market Revenue Share (%), by Product Type 2025 & 2033
- Figure 22: North America Iron Oxide Pigments Market Volume Share (%), by Product Type 2025 & 2033
- Figure 23: North America Iron Oxide Pigments Market Revenue (billion), by Color 2025 & 2033
- Figure 24: North America Iron Oxide Pigments Market Volume (Million), by Color 2025 & 2033
- Figure 25: North America Iron Oxide Pigments Market Revenue Share (%), by Color 2025 & 2033
- Figure 26: North America Iron Oxide Pigments Market Volume Share (%), by Color 2025 & 2033
- Figure 27: North America Iron Oxide Pigments Market Revenue (billion), by End-user Industry 2025 & 2033
- Figure 28: North America Iron Oxide Pigments Market Volume (Million), by End-user Industry 2025 & 2033
- Figure 29: North America Iron Oxide Pigments Market Revenue Share (%), by End-user Industry 2025 & 2033
- Figure 30: North America Iron Oxide Pigments Market Volume Share (%), by End-user Industry 2025 & 2033
- Figure 31: North America Iron Oxide Pigments Market Revenue (billion), by Country 2025 & 2033
- Figure 32: North America Iron Oxide Pigments Market Volume (Million), by Country 2025 & 2033
- Figure 33: North America Iron Oxide Pigments Market Revenue Share (%), by Country 2025 & 2033
- Figure 34: North America Iron Oxide Pigments Market Volume Share (%), by Country 2025 & 2033
- Figure 35: Europe Iron Oxide Pigments Market Revenue (billion), by Product Type 2025 & 2033
- Figure 36: Europe Iron Oxide Pigments Market Volume (Million), by Product Type 2025 & 2033
- Figure 37: Europe Iron Oxide Pigments Market Revenue Share (%), by Product Type 2025 & 2033
- Figure 38: Europe Iron Oxide Pigments Market Volume Share (%), by Product Type 2025 & 2033
- Figure 39: Europe Iron Oxide Pigments Market Revenue (billion), by Color 2025 & 2033
- Figure 40: Europe Iron Oxide Pigments Market Volume (Million), by Color 2025 & 2033
- Figure 41: Europe Iron Oxide Pigments Market Revenue Share (%), by Color 2025 & 2033
- Figure 42: Europe Iron Oxide Pigments Market Volume Share (%), by Color 2025 & 2033
- Figure 43: Europe Iron Oxide Pigments Market Revenue (billion), by End-user Industry 2025 & 2033
- Figure 44: Europe Iron Oxide Pigments Market Volume (Million), by End-user Industry 2025 & 2033
- Figure 45: Europe Iron Oxide Pigments Market Revenue Share (%), by End-user Industry 2025 & 2033
- Figure 46: Europe Iron Oxide Pigments Market Volume Share (%), by End-user Industry 2025 & 2033
- Figure 47: Europe Iron Oxide Pigments Market Revenue (billion), by Country 2025 & 2033
- Figure 48: Europe Iron Oxide Pigments Market Volume (Million), by Country 2025 & 2033
- Figure 49: Europe Iron Oxide Pigments Market Revenue Share (%), by Country 2025 & 2033
- Figure 50: Europe Iron Oxide Pigments Market Volume Share (%), by Country 2025 & 2033
- Figure 51: South America Iron Oxide Pigments Market Revenue (billion), by Product Type 2025 & 2033
- Figure 52: South America Iron Oxide Pigments Market Volume (Million), by Product Type 2025 & 2033
- Figure 53: South America Iron Oxide Pigments Market Revenue Share (%), by Product Type 2025 & 2033
- Figure 54: South America Iron Oxide Pigments Market Volume Share (%), by Product Type 2025 & 2033
- Figure 55: South America Iron Oxide Pigments Market Revenue (billion), by Color 2025 & 2033
- Figure 56: South America Iron Oxide Pigments Market Volume (Million), by Color 2025 & 2033
- Figure 57: South America Iron Oxide Pigments Market Revenue Share (%), by Color 2025 & 2033
- Figure 58: South America Iron Oxide Pigments Market Volume Share (%), by Color 2025 & 2033
- Figure 59: South America Iron Oxide Pigments Market Revenue (billion), by End-user Industry 2025 & 2033
- Figure 60: South America Iron Oxide Pigments Market Volume (Million), by End-user Industry 2025 & 2033
- Figure 61: South America Iron Oxide Pigments Market Revenue Share (%), by End-user Industry 2025 & 2033
- Figure 62: South America Iron Oxide Pigments Market Volume Share (%), by End-user Industry 2025 & 2033
- Figure 63: South America Iron Oxide Pigments Market Revenue (billion), by Country 2025 & 2033
- Figure 64: South America Iron Oxide Pigments Market Volume (Million), by Country 2025 & 2033
- Figure 65: South America Iron Oxide Pigments Market Revenue Share (%), by Country 2025 & 2033
- Figure 66: South America Iron Oxide Pigments Market Volume Share (%), by Country 2025 & 2033
- Figure 67: Middle East and Africa Iron Oxide Pigments Market Revenue (billion), by Product Type 2025 & 2033
- Figure 68: Middle East and Africa Iron Oxide Pigments Market Volume (Million), by Product Type 2025 & 2033
- Figure 69: Middle East and Africa Iron Oxide Pigments Market Revenue Share (%), by Product Type 2025 & 2033
- Figure 70: Middle East and Africa Iron Oxide Pigments Market Volume Share (%), by Product Type 2025 & 2033
- Figure 71: Middle East and Africa Iron Oxide Pigments Market Revenue (billion), by Color 2025 & 2033
- Figure 72: Middle East and Africa Iron Oxide Pigments Market Volume (Million), by Color 2025 & 2033
- Figure 73: Middle East and Africa Iron Oxide Pigments Market Revenue Share (%), by Color 2025 & 2033
- Figure 74: Middle East and Africa Iron Oxide Pigments Market Volume Share (%), by Color 2025 & 2033
- Figure 75: Middle East and Africa Iron Oxide Pigments Market Revenue (billion), by End-user Industry 2025 & 2033
- Figure 76: Middle East and Africa Iron Oxide Pigments Market Volume (Million), by End-user Industry 2025 & 2033
- Figure 77: Middle East and Africa Iron Oxide Pigments Market Revenue Share (%), by End-user Industry 2025 & 2033
- Figure 78: Middle East and Africa Iron Oxide Pigments Market Volume Share (%), by End-user Industry 2025 & 2033
- Figure 79: Middle East and Africa Iron Oxide Pigments Market Revenue (billion), by Country 2025 & 2033
- Figure 80: Middle East and Africa Iron Oxide Pigments Market Volume (Million), by Country 2025 & 2033
- Figure 81: Middle East and Africa Iron Oxide Pigments Market Revenue Share (%), by Country 2025 & 2033
- Figure 82: Middle East and Africa Iron Oxide Pigments Market Volume Share (%), by Country 2025 & 2033
List of Tables
- Table 1: Global Iron Oxide Pigments Market Revenue billion Forecast, by Product Type 2020 & 2033
- Table 2: Global Iron Oxide Pigments Market Volume Million Forecast, by Product Type 2020 & 2033
- Table 3: Global Iron Oxide Pigments Market Revenue billion Forecast, by Color 2020 & 2033
- Table 4: Global Iron Oxide Pigments Market Volume Million Forecast, by Color 2020 & 2033
- Table 5: Global Iron Oxide Pigments Market Revenue billion Forecast, by End-user Industry 2020 & 2033
- Table 6: Global Iron Oxide Pigments Market Volume Million Forecast, by End-user Industry 2020 & 2033
- Table 7: Global Iron Oxide Pigments Market Revenue billion Forecast, by Region 2020 & 2033
- Table 8: Global Iron Oxide Pigments Market Volume Million Forecast, by Region 2020 & 2033
- Table 9: Global Iron Oxide Pigments Market Revenue billion Forecast, by Product Type 2020 & 2033
- Table 10: Global Iron Oxide Pigments Market Volume Million Forecast, by Product Type 2020 & 2033
- Table 11: Global Iron Oxide Pigments Market Revenue billion Forecast, by Color 2020 & 2033
- Table 12: Global Iron Oxide Pigments Market Volume Million Forecast, by Color 2020 & 2033
- Table 13: Global Iron Oxide Pigments Market Revenue billion Forecast, by End-user Industry 2020 & 2033
- Table 14: Global Iron Oxide Pigments Market Volume Million Forecast, by End-user Industry 2020 & 2033
- Table 15: Global Iron Oxide Pigments Market Revenue billion Forecast, by Country 2020 & 2033
- Table 16: Global Iron Oxide Pigments Market Volume Million Forecast, by Country 2020 & 2033
- Table 17: China Iron Oxide Pigments Market Revenue (billion) Forecast, by Application 2020 & 2033
- Table 18: China Iron Oxide Pigments Market Volume (Million) Forecast, by Application 2020 & 2033
- Table 19: India Iron Oxide Pigments Market Revenue (billion) Forecast, by Application 2020 & 2033
- Table 20: India Iron Oxide Pigments Market Volume (Million) Forecast, by Application 2020 & 2033
- Table 21: Japan Iron Oxide Pigments Market Revenue (billion) Forecast, by Application 2020 & 2033
- Table 22: Japan Iron Oxide Pigments Market Volume (Million) Forecast, by Application 2020 & 2033
- Table 23: South Korea Iron Oxide Pigments Market Revenue (billion) Forecast, by Application 2020 & 2033
- Table 24: South Korea Iron Oxide Pigments Market Volume (Million) Forecast, by Application 2020 & 2033
- Table 25: Rest of Asia Pacific Iron Oxide Pigments Market Revenue (billion) Forecast, by Application 2020 & 2033
- Table 26: Rest of Asia Pacific Iron Oxide Pigments Market Volume (Million) Forecast, by Application 2020 & 2033
- Table 27: Global Iron Oxide Pigments Market Revenue billion Forecast, by Product Type 2020 & 2033
- Table 28: Global Iron Oxide Pigments Market Volume Million Forecast, by Product Type 2020 & 2033
- Table 29: Global Iron Oxide Pigments Market Revenue billion Forecast, by Color 2020 & 2033
- Table 30: Global Iron Oxide Pigments Market Volume Million Forecast, by Color 2020 & 2033
- Table 31: Global Iron Oxide Pigments Market Revenue billion Forecast, by End-user Industry 2020 & 2033
- Table 32: Global Iron Oxide Pigments Market Volume Million Forecast, by End-user Industry 2020 & 2033
- Table 33: Global Iron Oxide Pigments Market Revenue billion Forecast, by Country 2020 & 2033
- Table 34: Global Iron Oxide Pigments Market Volume Million Forecast, by Country 2020 & 2033
- Table 35: United States Iron Oxide Pigments Market Revenue (billion) Forecast, by Application 2020 & 2033
- Table 36: United States Iron Oxide Pigments Market Volume (Million) Forecast, by Application 2020 & 2033
- Table 37: Canada Iron Oxide Pigments Market Revenue (billion) Forecast, by Application 2020 & 2033
- Table 38: Canada Iron Oxide Pigments Market Volume (Million) Forecast, by Application 2020 & 2033
- Table 39: Mexico Iron Oxide Pigments Market Revenue (billion) Forecast, by Application 2020 & 2033
- Table 40: Mexico Iron Oxide Pigments Market Volume (Million) Forecast, by Application 2020 & 2033
- Table 41: Global Iron Oxide Pigments Market Revenue billion Forecast, by Product Type 2020 & 2033
- Table 42: Global Iron Oxide Pigments Market Volume Million Forecast, by Product Type 2020 & 2033
- Table 43: Global Iron Oxide Pigments Market Revenue billion Forecast, by Color 2020 & 2033
- Table 44: Global Iron Oxide Pigments Market Volume Million Forecast, by Color 2020 & 2033
- Table 45: Global Iron Oxide Pigments Market Revenue billion Forecast, by End-user Industry 2020 & 2033
- Table 46: Global Iron Oxide Pigments Market Volume Million Forecast, by End-user Industry 2020 & 2033
- Table 47: Global Iron Oxide Pigments Market Revenue billion Forecast, by Country 2020 & 2033
- Table 48: Global Iron Oxide Pigments Market Volume Million Forecast, by Country 2020 & 2033
- Table 49: Germany Iron Oxide Pigments Market Revenue (billion) Forecast, by Application 2020 & 2033
- Table 50: Germany Iron Oxide Pigments Market Volume (Million) Forecast, by Application 2020 & 2033
- Table 51: United Kingdom Iron Oxide Pigments Market Revenue (billion) Forecast, by Application 2020 & 2033
- Table 52: United Kingdom Iron Oxide Pigments Market Volume (Million) Forecast, by Application 2020 & 2033
- Table 53: Italy Iron Oxide Pigments Market Revenue (billion) Forecast, by Application 2020 & 2033
- Table 54: Italy Iron Oxide Pigments Market Volume (Million) Forecast, by Application 2020 & 2033
- Table 55: France Iron Oxide Pigments Market Revenue (billion) Forecast, by Application 2020 & 2033
- Table 56: France Iron Oxide Pigments Market Volume (Million) Forecast, by Application 2020 & 2033
- Table 57: Rest of Europe Iron Oxide Pigments Market Revenue (billion) Forecast, by Application 2020 & 2033
- Table 58: Rest of Europe Iron Oxide Pigments Market Volume (Million) Forecast, by Application 2020 & 2033
- Table 59: Global Iron Oxide Pigments Market Revenue billion Forecast, by Product Type 2020 & 2033
- Table 60: Global Iron Oxide Pigments Market Volume Million Forecast, by Product Type 2020 & 2033
- Table 61: Global Iron Oxide Pigments Market Revenue billion Forecast, by Color 2020 & 2033
- Table 62: Global Iron Oxide Pigments Market Volume Million Forecast, by Color 2020 & 2033
- Table 63: Global Iron Oxide Pigments Market Revenue billion Forecast, by End-user Industry 2020 & 2033
- Table 64: Global Iron Oxide Pigments Market Volume Million Forecast, by End-user Industry 2020 & 2033
- Table 65: Global Iron Oxide Pigments Market Revenue billion Forecast, by Country 2020 & 2033
- Table 66: Global Iron Oxide Pigments Market Volume Million Forecast, by Country 2020 & 2033
- Table 67: Brazil Iron Oxide Pigments Market Revenue (billion) Forecast, by Application 2020 & 2033
- Table 68: Brazil Iron Oxide Pigments Market Volume (Million) Forecast, by Application 2020 & 2033
- Table 69: Argentina Iron Oxide Pigments Market Revenue (billion) Forecast, by Application 2020 & 2033
- Table 70: Argentina Iron Oxide Pigments Market Volume (Million) Forecast, by Application 2020 & 2033
- Table 71: Rest of South America Iron Oxide Pigments Market Revenue (billion) Forecast, by Application 2020 & 2033
- Table 72: Rest of South America Iron Oxide Pigments Market Volume (Million) Forecast, by Application 2020 & 2033
- Table 73: Global Iron Oxide Pigments Market Revenue billion Forecast, by Product Type 2020 & 2033
- Table 74: Global Iron Oxide Pigments Market Volume Million Forecast, by Product Type 2020 & 2033
- Table 75: Global Iron Oxide Pigments Market Revenue billion Forecast, by Color 2020 & 2033
- Table 76: Global Iron Oxide Pigments Market Volume Million Forecast, by Color 2020 & 2033
- Table 77: Global Iron Oxide Pigments Market Revenue billion Forecast, by End-user Industry 2020 & 2033
- Table 78: Global Iron Oxide Pigments Market Volume Million Forecast, by End-user Industry 2020 & 2033
- Table 79: Global Iron Oxide Pigments Market Revenue billion Forecast, by Country 2020 & 2033
- Table 80: Global Iron Oxide Pigments Market Volume Million Forecast, by Country 2020 & 2033
- Table 81: Saudi Arabia Iron Oxide Pigments Market Revenue (billion) Forecast, by Application 2020 & 2033
- Table 82: Saudi Arabia Iron Oxide Pigments Market Volume (Million) Forecast, by Application 2020 & 2033
- Table 83: South Africa Iron Oxide Pigments Market Revenue (billion) Forecast, by Application 2020 & 2033
- Table 84: South Africa Iron Oxide Pigments Market Volume (Million) Forecast, by Application 2020 & 2033
- Table 85: Rest of Middle East and Africa Iron Oxide Pigments Market Revenue (billion) Forecast, by Application 2020 & 2033
- Table 86: Rest of Middle East and Africa Iron Oxide Pigments Market Volume (Million) Forecast, by Application 2020 & 2033
Frequently Asked Questions
1. What is the projected Compound Annual Growth Rate (CAGR) of the Iron Oxide Pigments Market?
The projected CAGR is approximately 4.5%.
2. Which companies are prominent players in the Iron Oxide Pigments Market?
Key companies in the market include CATHAY INDUSTRIES, Harold Scholz & Co GmbH, Golchha Oxides Pvt Ltd, Raveshia Group, RSonal Dyes and Chemicals, Xinxiang Rongbo Pigment Science & Technology Co Ltd, Proquimac, YIPIN PIGMENTS*List Not Exhaustive, APPLIED MINERALS INC, Jiangsu Yuxing Industry and Trade Co Ltd, Precheza, Chemipol (Kothari Group Of Industries), Tata Pigments Limited, BASF SE, SHENGHUA GROUP DEQING HUAYUAN PIGMENT CO LTD.
3. What are the main segments of the Iron Oxide Pigments Market?
The market segments include Product Type, Color, End-user Industry.
4. Can you provide details about the market size?
The market size is estimated to be USD 2.4 billion as of 2022.
5. What are some drivers contributing to market growth?
Increasing Demand from the Building and Construction Segment; Rising Demand of Paints and Coatings.
6. What are the notable trends driving market growth?
Increasing Demand from the Building and Construction Industry.
7. Are there any restraints impacting market growth?
Fluctuations in the Prices of Raw Materials; Stringent Environmental Regulations.
8. Can you provide examples of recent developments in the market?
December 2022: Cathay Industries announced the commissioning of a world-class iron oxide pigment finishing and blending facility in Batam, Indonesia, following their recent agreement to acquire the iron oxide pigment operations of Venator Materials PLC. The plant's first supplies will commence in the latter part of 2023, which will complement Cathay Industries' global footprint.
9. What pricing options are available for accessing the report?
Pricing options include single-user, multi-user, and enterprise licenses priced at USD 4750, USD 5250, and USD 8750 respectively.
10. Is the market size provided in terms of value or volume?
The market size is provided in terms of value, measured in billion and volume, measured in Million.
11. Are there any specific market keywords associated with the report?
Yes, the market keyword associated with the report is "Iron Oxide Pigments Market," which aids in identifying and referencing the specific market segment covered.
12. How do I determine which pricing option suits my needs best?
The pricing options vary based on user requirements and access needs. Individual users may opt for single-user licenses, while businesses requiring broader access may choose multi-user or enterprise licenses for cost-effective access to the report.
13. Are there any additional resources or data provided in the Iron Oxide Pigments Market report?
While the report offers comprehensive insights, it's advisable to review the specific contents or supplementary materials provided to ascertain if additional resources or data are available.
14. How can I stay updated on further developments or reports in the Iron Oxide Pigments Market?
To stay informed about further developments, trends, and reports in the Iron Oxide Pigments Market, consider subscribing to industry newsletters, following relevant companies and organizations, or regularly checking reputable industry news sources and publications.
Methodology
Step 1 - Identification of Relevant Samples Size from Population Database


Step 2 - Approaches for Defining Global Market Size (Value, Volume* & Price*)

Note*: In applicable scenarios
Step 3 - Data Sources
Primary Research
- Web Analytics
- Survey Reports
- Research Institute
- Latest Research Reports
- Opinion Leaders
Secondary Research
- Annual Reports
- White Paper
- Latest Press Release
- Industry Association
- Paid Database
- Investor Presentations

Step 4 - Data Triangulation
Involves using different sources of information in order to increase the validity of a study
These sources are likely to be stakeholders in a program - participants, other researchers, program staff, other community members, and so on.
Then we put all data in single framework & apply various statistical tools to find out the dynamic on the market.
During the analysis stage, feedback from the stakeholder groups would be compared to determine areas of agreement as well as areas of divergence