

Key Insights
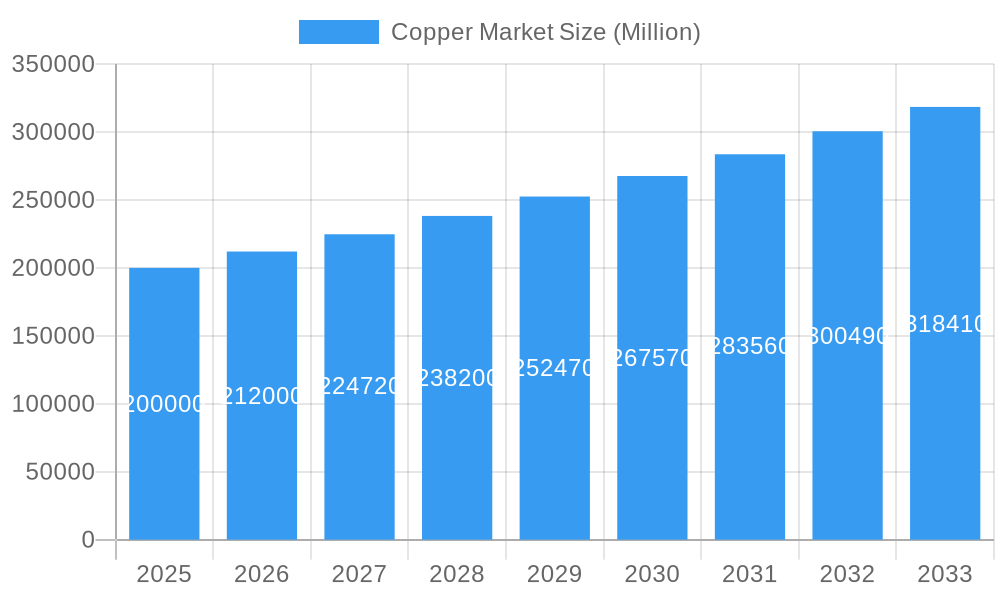
The global copper market is experiencing robust growth, projected to maintain a Compound Annual Growth Rate (CAGR) exceeding 6% from 2025 to 2033. This expansion is fueled by several key drivers. The burgeoning automotive and heavy equipment sectors, particularly the rise of electric vehicles and their associated infrastructure, are significantly increasing copper demand. Furthermore, the construction industry's ongoing expansion globally, coupled with the increasing adoption of renewable energy technologies (solar panels and wind turbines, both reliant on copper), is bolstering market growth. The electronics and industrial sectors also contribute substantially, with growing demand driven by the proliferation of smart devices, automation, and industrial modernization. While supply chain disruptions and fluctuating commodity prices pose potential restraints, the long-term outlook remains positive, driven by the sustained demand from key end-user industries.
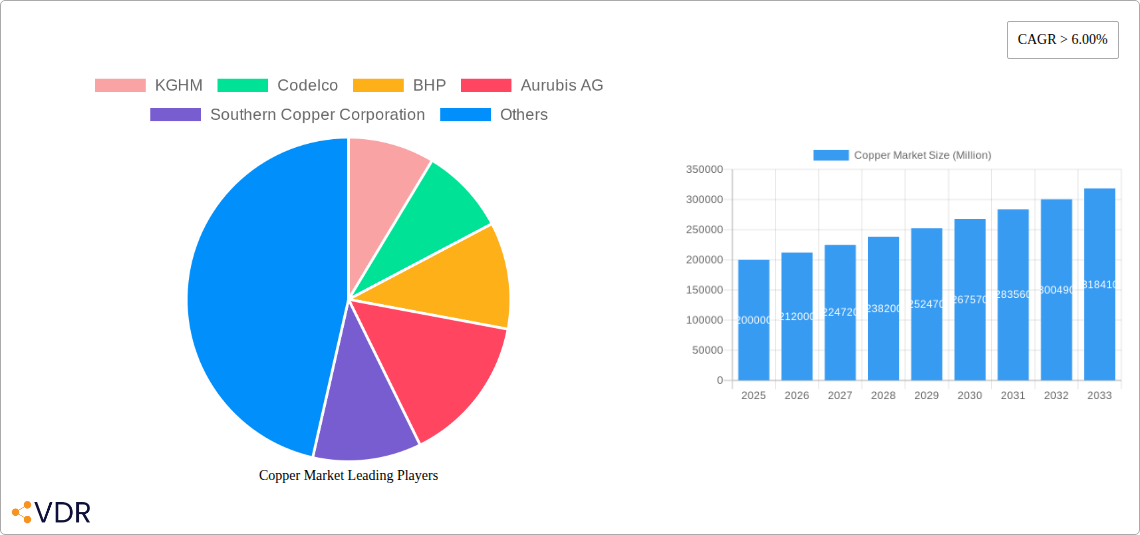
Copper Market Market Size (In Billion)
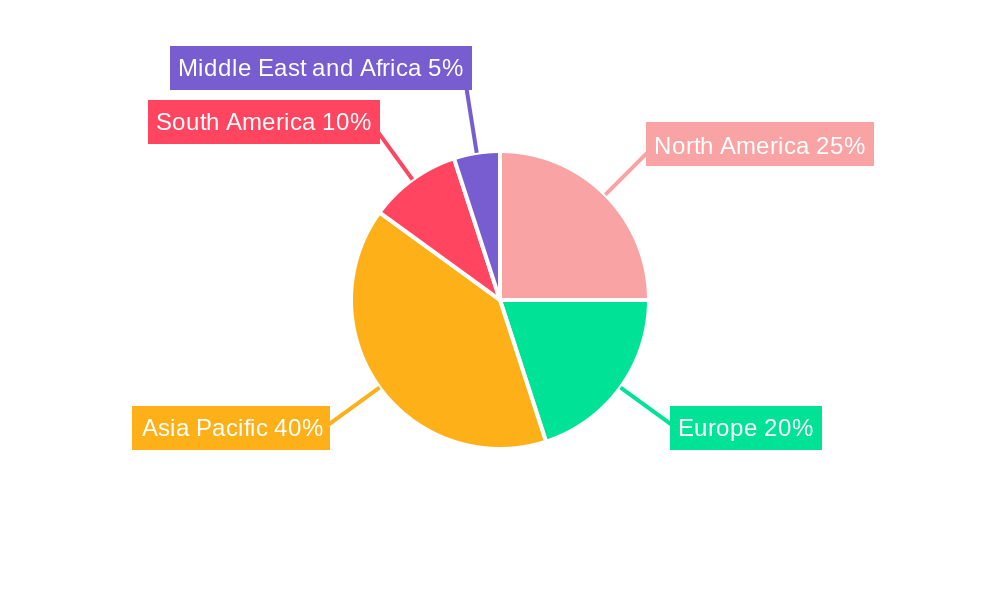
Growth is expected to be geographically diverse. The Asia-Pacific region, particularly China and India, will continue to be major contributors due to their rapid industrialization and infrastructure development. North America and Europe will also witness significant growth, although potentially at a slower pace than Asia-Pacific, owing to established infrastructure and a mature market. South America, while a significant copper producer, may experience fluctuating growth dependent on mining output and global economic conditions. The market segmentation reveals the automotive and heavy equipment sector as the most dominant end-user, followed by the construction, electrical and electronics, and industrial sectors. Major players like KGHM, Codelco, BHP, and Glencore are key to shaping market dynamics, impacting both supply and pricing. The forecast period (2025-2033) promises continued expansion, though careful attention must be paid to geopolitical factors and potential supply chain vulnerabilities to provide accurate market estimations.
Copper Market Company Market Share
Copper Market Report: 2019-2033 Forecast
This comprehensive report provides a detailed analysis of the global copper market, encompassing market dynamics, growth trends, regional insights, and key player strategies. The study period covers 2019-2033, with a focus on the forecast period (2025-2033), base year (2025), and historical period (2019-2024). This report is essential for industry professionals, investors, and stakeholders seeking to understand the complexities and opportunities within this vital sector. The report dives deep into the parent market of metals and mining and the child market of copper.
Copper Market Dynamics & Structure
The copper market is characterized by moderate concentration, with several major players holding significant market share. Technological innovation, primarily in extraction and recycling processes, plays a crucial role. Stringent environmental regulations and fluctuating commodity prices influence market dynamics. Recycled copper provides a significant portion of the supply, creating a complex interplay between primary and secondary sources. The increasing adoption of copper in renewable energy and electric vehicle manufacturing is further shaping the market. Mergers and acquisitions (M&A) activity remains notable, with deal volume estimated at xx Million USD in 2024.
- Market Concentration: Top 5 players hold approximately 60% market share (estimated).
- Technological Innovation: Focus on automation, improved extraction techniques, and advanced recycling technologies.
- Regulatory Framework: Environmental regulations drive the adoption of sustainable practices and recycling.
- Competitive Substitutes: Aluminum and other conductive materials present competitive challenges.
- End-User Demographics: Growth is fueled by increasing demand from the construction, automotive, and electronics sectors.
- M&A Trends: Consolidation is expected to continue, driving efficiency and resource optimization.
Copper Market Growth Trends & Insights
The global copper market experienced steady growth during the historical period (2019-2024), driven by robust demand from key end-use sectors. The market size reached approximately xx Million units in 2024, and is projected to reach xx Million units by 2033, exhibiting a CAGR of xx% during the forecast period. Technological disruptions, such as the increasing adoption of electric vehicles and renewable energy infrastructure, are significantly impacting market growth. Shifting consumer preferences towards sustainable and eco-friendly products are also playing a role. Adoption rates within the electronics sector are particularly noteworthy, indicating a high degree of market penetration.
Dominant Regions, Countries, or Segments in Copper Market
The Asia-Pacific region remains the dominant market for copper, driven by rapid infrastructure development and industrialization in China and other emerging economies. High demand from the construction, electrical and electronics, and automotive sectors is fueling growth. North America and Europe also hold significant market shares, though at slower growth rates compared to Asia-Pacific. Within end-user segments, the automotive and heavy equipment sector shows high growth potential, driven by the global transition to electric vehicles.
- Key Drivers (Asia-Pacific): Rapid urbanization, robust industrial growth, government infrastructure investments, increasing adoption of renewable energy.
- Dominance Factors: Large consumer base, substantial manufacturing activity, significant infrastructure projects, growing middle class.
- Growth Potential: Continued expansion in emerging economies, increased adoption of advanced technologies, supportive government policies.
Copper Market Product Landscape
Copper products range from standard copper rods and wires to specialized alloys and high-purity forms used in advanced electronics. Innovations focus on enhancing conductivity, improving corrosion resistance, and developing sustainable production processes. The unique selling propositions often lie in specific alloy compositions tailored to particular applications, offering higher performance and reliability. Technological advancements include the use of nanotechnology for improving material properties and the development of new recycling techniques to recover and reuse copper.
Key Drivers, Barriers & Challenges in Copper Market
Key Drivers: Growing demand from renewable energy sectors (solar, wind), increasing urbanization and infrastructure development, the rise of electric vehicles, and the growing adoption of smart technologies.
Key Challenges: Fluctuations in commodity prices, geopolitical instability impacting supply chains, environmental concerns and regulations, and competition from substitute materials. Supply chain disruptions can significantly impact market stability, potentially leading to price volatility and constrained supply.
Emerging Opportunities in Copper Market
The increasing use of copper in 5G infrastructure, advanced electronic devices, and the growing demand for sustainable building materials presents significant growth opportunities. Untapped markets in developing economies, coupled with innovative applications in medical devices and other niche sectors, further expands market potential. Evolving consumer preferences towards environmentally responsible products drive the demand for recycled copper.
Growth Accelerators in the Copper Market Industry
Technological advancements in mining and recycling, strategic partnerships between mining companies and technology providers, and expansion into new markets, particularly in developing economies, are key growth catalysts. Focus on sustainability and circular economy models enhances the long-term prospects of the copper market.
Key Players Shaping the Copper Market Market
Notable Milestones in Copper Market Sector
- November 2021: Aurubis AG commenced construction of a multi-metal recycling plant in Georgia, USA, with an annual capacity of 35,000 tons of blister copper.
- May 2021: Glencore announced plans to restart operations at the Mutanda copper and cobalt mine in 2022, addressing potential market shortages.
In-Depth Copper Market Market Outlook
The copper market is poised for sustained growth, driven by the increasing demand from key sectors, technological innovation, and the growing focus on sustainable practices. Strategic investments in new mining projects and advancements in recycling technologies will further strengthen market dynamics. The growing importance of copper in the energy transition and the expanding global infrastructure development will create favorable conditions for long-term growth and significant market expansion.
Copper Market Segmentation
-
1. End-user Industry
- 1.1. Automotive and Heavy Equipment
- 1.2. Construction
- 1.3. Electrical and Electronics
- 1.4. Industrial
- 1.5. Other End-user Industry
Copper Market Segmentation By Geography
-
1. Asia Pacific
- 1.1. China
- 1.2. India
- 1.3. Japan
- 1.4. South Korea
- 1.5. Rest of Asia Pacific
-
2. North America
- 2.1. United States
- 2.2. Canada
- 2.3. Mexico
-
3. Europe
- 3.1. Germany
- 3.2. United Kingdom
- 3.3. France
- 3.4. Italy
- 3.5. Rest of Europe
-
4. South America
- 4.1. Brazil
- 4.2. Argentina
- 4.3. Rest of South America
-
5. Middle East and Africa
- 5.1. South Africa
- 5.2. UAE
- 5.3. Saudi Arabia
- 5.4. Rest of Middle East and Africa
Copper Market Regional Market Share
Geographic Coverage of Copper Market
Copper Market REPORT HIGHLIGHTS
| Aspects | Details |
|---|---|
| Study Period | 2020-2034 |
| Base Year | 2025 |
| Estimated Year | 2026 |
| Forecast Period | 2026-2034 |
| Historical Period | 2020-2025 |
| Growth Rate | CAGR of > 6.00% from 2020-2034 |
| Segmentation |
|
Table of Contents
- 1. Introduction
- 1.1. Research Scope
- 1.2. Market Segmentation
- 1.3. Research Objective
- 1.4. Definitions and Assumptions
- 2. Executive Summary
- 2.1. Market Snapshot
- 3. Market Dynamics
- 3.1. Market Drivers
- 3.2. Market Restrains
- 3.3. Market Trends
- 3.4. Market Opportunities
- 4. Market Factor Analysis
- 4.1. Porters Five Forces
- 4.1.1. Bargaining Power of Suppliers
- 4.1.2. Bargaining Power of Buyers
- 4.1.3. Threat of New Entrants
- 4.1.4. Threat of Substitutes
- 4.1.5. Competitive Rivalry
- 4.2. PESTEL analysis
- 4.3. BCG Analysis
- 4.3.1. Stars (High Growth, High Market Share)
- 4.3.2. Cash Cows (Low Growth, High Market Share)
- 4.3.3. Question Mark (High Growth, Low Market Share)
- 4.3.4. Dogs (Low Growth, Low Market Share)
- 4.4. Ansoff Matrix Analysis
- 4.5. Supply Chain Analysis
- 4.6. Regulatory Landscape
- 4.7. Current Market Potential and Opportunity Assessment (TAM–SAM–SOM Framework)
- 4.8. VDR Analyst Note
- 4.1. Porters Five Forces
- 5. Market Analysis, Insights and Forecast 2021-2033
- 5.1. Market Analysis, Insights and Forecast - by End-user Industry
- 5.1.1. Automotive and Heavy Equipment
- 5.1.2. Construction
- 5.1.3. Electrical and Electronics
- 5.1.4. Industrial
- 5.1.5. Other End-user Industry
- 5.2. Market Analysis, Insights and Forecast - by Region
- 5.2.1. Asia Pacific
- 5.2.2. North America
- 5.2.3. Europe
- 5.2.4. South America
- 5.2.5. Middle East and Africa
- 5.1. Market Analysis, Insights and Forecast - by End-user Industry
- 6. Global Copper Market Analysis, Insights and Forecast, 2021-2033
- 6.1. Market Analysis, Insights and Forecast - by End-user Industry
- 6.1.1. Automotive and Heavy Equipment
- 6.1.2. Construction
- 6.1.3. Electrical and Electronics
- 6.1.4. Industrial
- 6.1.5. Other End-user Industry
- 6.1. Market Analysis, Insights and Forecast - by End-user Industry
- 7. Asia Pacific Copper Market Analysis, Insights and Forecast, 2021-2033
- 7.1. Market Analysis, Insights and Forecast - by End-user Industry
- 7.1.1. Automotive and Heavy Equipment
- 7.1.2. Construction
- 7.1.3. Electrical and Electronics
- 7.1.4. Industrial
- 7.1.5. Other End-user Industry
- 7.1. Market Analysis, Insights and Forecast - by End-user Industry
- 8. North America Copper Market Analysis, Insights and Forecast, 2021-2033
- 8.1. Market Analysis, Insights and Forecast - by End-user Industry
- 8.1.1. Automotive and Heavy Equipment
- 8.1.2. Construction
- 8.1.3. Electrical and Electronics
- 8.1.4. Industrial
- 8.1.5. Other End-user Industry
- 8.1. Market Analysis, Insights and Forecast - by End-user Industry
- 9. Europe Copper Market Analysis, Insights and Forecast, 2021-2033
- 9.1. Market Analysis, Insights and Forecast - by End-user Industry
- 9.1.1. Automotive and Heavy Equipment
- 9.1.2. Construction
- 9.1.3. Electrical and Electronics
- 9.1.4. Industrial
- 9.1.5. Other End-user Industry
- 9.1. Market Analysis, Insights and Forecast - by End-user Industry
- 10. South America Copper Market Analysis, Insights and Forecast, 2021-2033
- 10.1. Market Analysis, Insights and Forecast - by End-user Industry
- 10.1.1. Automotive and Heavy Equipment
- 10.1.2. Construction
- 10.1.3. Electrical and Electronics
- 10.1.4. Industrial
- 10.1.5. Other End-user Industry
- 10.1. Market Analysis, Insights and Forecast - by End-user Industry
- 11. Middle East and Africa Copper Market Analysis, Insights and Forecast, 2021-2033
- 11.1. Market Analysis, Insights and Forecast - by End-user Industry
- 11.1.1. Automotive and Heavy Equipment
- 11.1.2. Construction
- 11.1.3. Electrical and Electronics
- 11.1.4. Industrial
- 11.1.5. Other End-user Industry
- 11.1. Market Analysis, Insights and Forecast - by End-user Industry
- 12. Competitive Analysis
- 12.1. Company Profiles
- 12.1.1 KGHM
- 12.1.1.1. Company Overview
- 12.1.1.2. Products
- 12.1.1.3. Company Financials
- 12.1.1.4. SWOT Analysis
- 12.1.2 Codelco
- 12.1.2.1. Company Overview
- 12.1.2.2. Products
- 12.1.2.3. Company Financials
- 12.1.2.4. SWOT Analysis
- 12.1.3 BHP
- 12.1.3.1. Company Overview
- 12.1.3.2. Products
- 12.1.3.3. Company Financials
- 12.1.3.4. SWOT Analysis
- 12.1.4 Aurubis AG
- 12.1.4.1. Company Overview
- 12.1.4.2. Products
- 12.1.4.3. Company Financials
- 12.1.4.4. SWOT Analysis
- 12.1.5 Southern Copper Corporation
- 12.1.5.1. Company Overview
- 12.1.5.2. Products
- 12.1.5.3. Company Financials
- 12.1.5.4. SWOT Analysis
- 12.1.6 Group Mexico
- 12.1.6.1. Company Overview
- 12.1.6.2. Products
- 12.1.6.3. Company Financials
- 12.1.6.4. SWOT Analysis
- 12.1.7 Xstrata Plc
- 12.1.7.1. Company Overview
- 12.1.7.2. Products
- 12.1.7.3. Company Financials
- 12.1.7.4. SWOT Analysis
- 12.1.8 Glencore
- 12.1.8.1. Company Overview
- 12.1.8.2. Products
- 12.1.8.3. Company Financials
- 12.1.8.4. SWOT Analysis
- 12.1.9 Chinalco Shanghai Copper
- 12.1.9.1. Company Overview
- 12.1.9.2. Products
- 12.1.9.3. Company Financials
- 12.1.9.4. SWOT Analysis
- 12.1.10 Freeport-McMoRan Copper & Gold
- 12.1.10.1. Company Overview
- 12.1.10.2. Products
- 12.1.10.3. Company Financials
- 12.1.10.4. SWOT Analysis
- 12.1.1 KGHM
- 12.2. Market Entropy
- 12.2.1 Company's Key Areas Served
- 12.2.2 Recent Developments
- 12.3. Company Market Share Analysis 2025
- 12.3.1 Top 5 Companies Market Share Analysis
- 12.3.2 Top 3 Companies Market Share Analysis
- 12.4. List of Potential Customers
- 13. Research Methodology
List of Figures
- Figure 1: Global Copper Market Revenue Breakdown (Million, %) by Region 2025 & 2033
- Figure 2: Global Copper Market Volume Breakdown (K Tons, %) by Region 2025 & 2033
- Figure 3: Asia Pacific Copper Market Revenue (Million), by End-user Industry 2025 & 2033
- Figure 4: Asia Pacific Copper Market Volume (K Tons), by End-user Industry 2025 & 2033
- Figure 5: Asia Pacific Copper Market Revenue Share (%), by End-user Industry 2025 & 2033
- Figure 6: Asia Pacific Copper Market Volume Share (%), by End-user Industry 2025 & 2033
- Figure 7: Asia Pacific Copper Market Revenue (Million), by Country 2025 & 2033
- Figure 8: Asia Pacific Copper Market Volume (K Tons), by Country 2025 & 2033
- Figure 9: Asia Pacific Copper Market Revenue Share (%), by Country 2025 & 2033
- Figure 10: Asia Pacific Copper Market Volume Share (%), by Country 2025 & 2033
- Figure 11: North America Copper Market Revenue (Million), by End-user Industry 2025 & 2033
- Figure 12: North America Copper Market Volume (K Tons), by End-user Industry 2025 & 2033
- Figure 13: North America Copper Market Revenue Share (%), by End-user Industry 2025 & 2033
- Figure 14: North America Copper Market Volume Share (%), by End-user Industry 2025 & 2033
- Figure 15: North America Copper Market Revenue (Million), by Country 2025 & 2033
- Figure 16: North America Copper Market Volume (K Tons), by Country 2025 & 2033
- Figure 17: North America Copper Market Revenue Share (%), by Country 2025 & 2033
- Figure 18: North America Copper Market Volume Share (%), by Country 2025 & 2033
- Figure 19: Europe Copper Market Revenue (Million), by End-user Industry 2025 & 2033
- Figure 20: Europe Copper Market Volume (K Tons), by End-user Industry 2025 & 2033
- Figure 21: Europe Copper Market Revenue Share (%), by End-user Industry 2025 & 2033
- Figure 22: Europe Copper Market Volume Share (%), by End-user Industry 2025 & 2033
- Figure 23: Europe Copper Market Revenue (Million), by Country 2025 & 2033
- Figure 24: Europe Copper Market Volume (K Tons), by Country 2025 & 2033
- Figure 25: Europe Copper Market Revenue Share (%), by Country 2025 & 2033
- Figure 26: Europe Copper Market Volume Share (%), by Country 2025 & 2033
- Figure 27: South America Copper Market Revenue (Million), by End-user Industry 2025 & 2033
- Figure 28: South America Copper Market Volume (K Tons), by End-user Industry 2025 & 2033
- Figure 29: South America Copper Market Revenue Share (%), by End-user Industry 2025 & 2033
- Figure 30: South America Copper Market Volume Share (%), by End-user Industry 2025 & 2033
- Figure 31: South America Copper Market Revenue (Million), by Country 2025 & 2033
- Figure 32: South America Copper Market Volume (K Tons), by Country 2025 & 2033
- Figure 33: South America Copper Market Revenue Share (%), by Country 2025 & 2033
- Figure 34: South America Copper Market Volume Share (%), by Country 2025 & 2033
- Figure 35: Middle East and Africa Copper Market Revenue (Million), by End-user Industry 2025 & 2033
- Figure 36: Middle East and Africa Copper Market Volume (K Tons), by End-user Industry 2025 & 2033
- Figure 37: Middle East and Africa Copper Market Revenue Share (%), by End-user Industry 2025 & 2033
- Figure 38: Middle East and Africa Copper Market Volume Share (%), by End-user Industry 2025 & 2033
- Figure 39: Middle East and Africa Copper Market Revenue (Million), by Country 2025 & 2033
- Figure 40: Middle East and Africa Copper Market Volume (K Tons), by Country 2025 & 2033
- Figure 41: Middle East and Africa Copper Market Revenue Share (%), by Country 2025 & 2033
- Figure 42: Middle East and Africa Copper Market Volume Share (%), by Country 2025 & 2033
List of Tables
- Table 1: Global Copper Market Revenue Million Forecast, by End-user Industry 2020 & 2033
- Table 2: Global Copper Market Volume K Tons Forecast, by End-user Industry 2020 & 2033
- Table 3: Global Copper Market Revenue Million Forecast, by Region 2020 & 2033
- Table 4: Global Copper Market Volume K Tons Forecast, by Region 2020 & 2033
- Table 5: Global Copper Market Revenue Million Forecast, by End-user Industry 2020 & 2033
- Table 6: Global Copper Market Volume K Tons Forecast, by End-user Industry 2020 & 2033
- Table 7: Global Copper Market Revenue Million Forecast, by Country 2020 & 2033
- Table 8: Global Copper Market Volume K Tons Forecast, by Country 2020 & 2033
- Table 9: China Copper Market Revenue (Million) Forecast, by Application 2020 & 2033
- Table 10: China Copper Market Volume (K Tons) Forecast, by Application 2020 & 2033
- Table 11: India Copper Market Revenue (Million) Forecast, by Application 2020 & 2033
- Table 12: India Copper Market Volume (K Tons) Forecast, by Application 2020 & 2033
- Table 13: Japan Copper Market Revenue (Million) Forecast, by Application 2020 & 2033
- Table 14: Japan Copper Market Volume (K Tons) Forecast, by Application 2020 & 2033
- Table 15: South Korea Copper Market Revenue (Million) Forecast, by Application 2020 & 2033
- Table 16: South Korea Copper Market Volume (K Tons) Forecast, by Application 2020 & 2033
- Table 17: Rest of Asia Pacific Copper Market Revenue (Million) Forecast, by Application 2020 & 2033
- Table 18: Rest of Asia Pacific Copper Market Volume (K Tons) Forecast, by Application 2020 & 2033
- Table 19: Global Copper Market Revenue Million Forecast, by End-user Industry 2020 & 2033
- Table 20: Global Copper Market Volume K Tons Forecast, by End-user Industry 2020 & 2033
- Table 21: Global Copper Market Revenue Million Forecast, by Country 2020 & 2033
- Table 22: Global Copper Market Volume K Tons Forecast, by Country 2020 & 2033
- Table 23: United States Copper Market Revenue (Million) Forecast, by Application 2020 & 2033
- Table 24: United States Copper Market Volume (K Tons) Forecast, by Application 2020 & 2033
- Table 25: Canada Copper Market Revenue (Million) Forecast, by Application 2020 & 2033
- Table 26: Canada Copper Market Volume (K Tons) Forecast, by Application 2020 & 2033
- Table 27: Mexico Copper Market Revenue (Million) Forecast, by Application 2020 & 2033
- Table 28: Mexico Copper Market Volume (K Tons) Forecast, by Application 2020 & 2033
- Table 29: Global Copper Market Revenue Million Forecast, by End-user Industry 2020 & 2033
- Table 30: Global Copper Market Volume K Tons Forecast, by End-user Industry 2020 & 2033
- Table 31: Global Copper Market Revenue Million Forecast, by Country 2020 & 2033
- Table 32: Global Copper Market Volume K Tons Forecast, by Country 2020 & 2033
- Table 33: Germany Copper Market Revenue (Million) Forecast, by Application 2020 & 2033
- Table 34: Germany Copper Market Volume (K Tons) Forecast, by Application 2020 & 2033
- Table 35: United Kingdom Copper Market Revenue (Million) Forecast, by Application 2020 & 2033
- Table 36: United Kingdom Copper Market Volume (K Tons) Forecast, by Application 2020 & 2033
- Table 37: France Copper Market Revenue (Million) Forecast, by Application 2020 & 2033
- Table 38: France Copper Market Volume (K Tons) Forecast, by Application 2020 & 2033
- Table 39: Italy Copper Market Revenue (Million) Forecast, by Application 2020 & 2033
- Table 40: Italy Copper Market Volume (K Tons) Forecast, by Application 2020 & 2033
- Table 41: Rest of Europe Copper Market Revenue (Million) Forecast, by Application 2020 & 2033
- Table 42: Rest of Europe Copper Market Volume (K Tons) Forecast, by Application 2020 & 2033
- Table 43: Global Copper Market Revenue Million Forecast, by End-user Industry 2020 & 2033
- Table 44: Global Copper Market Volume K Tons Forecast, by End-user Industry 2020 & 2033
- Table 45: Global Copper Market Revenue Million Forecast, by Country 2020 & 2033
- Table 46: Global Copper Market Volume K Tons Forecast, by Country 2020 & 2033
- Table 47: Brazil Copper Market Revenue (Million) Forecast, by Application 2020 & 2033
- Table 48: Brazil Copper Market Volume (K Tons) Forecast, by Application 2020 & 2033
- Table 49: Argentina Copper Market Revenue (Million) Forecast, by Application 2020 & 2033
- Table 50: Argentina Copper Market Volume (K Tons) Forecast, by Application 2020 & 2033
- Table 51: Rest of South America Copper Market Revenue (Million) Forecast, by Application 2020 & 2033
- Table 52: Rest of South America Copper Market Volume (K Tons) Forecast, by Application 2020 & 2033
- Table 53: Global Copper Market Revenue Million Forecast, by End-user Industry 2020 & 2033
- Table 54: Global Copper Market Volume K Tons Forecast, by End-user Industry 2020 & 2033
- Table 55: Global Copper Market Revenue Million Forecast, by Country 2020 & 2033
- Table 56: Global Copper Market Volume K Tons Forecast, by Country 2020 & 2033
- Table 57: South Africa Copper Market Revenue (Million) Forecast, by Application 2020 & 2033
- Table 58: South Africa Copper Market Volume (K Tons) Forecast, by Application 2020 & 2033
- Table 59: UAE Copper Market Revenue (Million) Forecast, by Application 2020 & 2033
- Table 60: UAE Copper Market Volume (K Tons) Forecast, by Application 2020 & 2033
- Table 61: Saudi Arabia Copper Market Revenue (Million) Forecast, by Application 2020 & 2033
- Table 62: Saudi Arabia Copper Market Volume (K Tons) Forecast, by Application 2020 & 2033
- Table 63: Rest of Middle East and Africa Copper Market Revenue (Million) Forecast, by Application 2020 & 2033
- Table 64: Rest of Middle East and Africa Copper Market Volume (K Tons) Forecast, by Application 2020 & 2033
Frequently Asked Questions
1. What is the projected Compound Annual Growth Rate (CAGR) of the Copper Market?
The projected CAGR is approximately > 6.00%.
2. Which companies are prominent players in the Copper Market?
Key companies in the market include KGHM, Codelco, BHP, Aurubis AG, Southern Copper Corporation, Group Mexico, Xstrata Plc, Glencore, Chinalco Shanghai Copper, Freeport-McMoRan Copper & Gold.
3. What are the main segments of the Copper Market?
The market segments include End-user Industry.
4. Can you provide details about the market size?
The market size is estimated to be USD XX Million as of 2022.
5. What are some drivers contributing to market growth?
Growing Demand from Electronics and Construction Industry; Other Drivers.
6. What are the notable trends driving market growth?
Growing Demand for Electrical and Electronics Segment.
7. Are there any restraints impacting market growth?
Stringent Regulations Associated with Mining.
8. Can you provide examples of recent developments in the market?
November 2021: Aurubis AG further expanded its activities in recycling metal-bearing materials internationally. It started the construction of a multi metal recycling plant in the US state of Georgia. Circuit boards, copper cable, and other recycling materials containing metals will be processed into 35,000 tons of blister copper annually.
9. What pricing options are available for accessing the report?
Pricing options include single-user, multi-user, and enterprise licenses priced at USD 4750, USD 5250, and USD 8750 respectively.
10. Is the market size provided in terms of value or volume?
The market size is provided in terms of value, measured in Million and volume, measured in K Tons.
11. Are there any specific market keywords associated with the report?
Yes, the market keyword associated with the report is "Copper Market," which aids in identifying and referencing the specific market segment covered.
12. How do I determine which pricing option suits my needs best?
The pricing options vary based on user requirements and access needs. Individual users may opt for single-user licenses, while businesses requiring broader access may choose multi-user or enterprise licenses for cost-effective access to the report.
13. Are there any additional resources or data provided in the Copper Market report?
While the report offers comprehensive insights, it's advisable to review the specific contents or supplementary materials provided to ascertain if additional resources or data are available.
14. How can I stay updated on further developments or reports in the Copper Market?
To stay informed about further developments, trends, and reports in the Copper Market, consider subscribing to industry newsletters, following relevant companies and organizations, or regularly checking reputable industry news sources and publications.
Methodology
Step 1 - Identification of Relevant Samples Size from Population Database


Step 2 - Approaches for Defining Global Market Size (Value, Volume* & Price*)

Note*: In applicable scenarios
Step 3 - Data Sources
Primary Research
- Web Analytics
- Survey Reports
- Research Institute
- Latest Research Reports
- Opinion Leaders
Secondary Research
- Annual Reports
- White Paper
- Latest Press Release
- Industry Association
- Paid Database
- Investor Presentations

Step 4 - Data Triangulation
Involves using different sources of information in order to increase the validity of a study
These sources are likely to be stakeholders in a program - participants, other researchers, program staff, other community members, and so on.
Then we put all data in single framework & apply various statistical tools to find out the dynamic on the market.
During the analysis stage, feedback from the stakeholder groups would be compared to determine areas of agreement as well as areas of divergence