
Key Insights
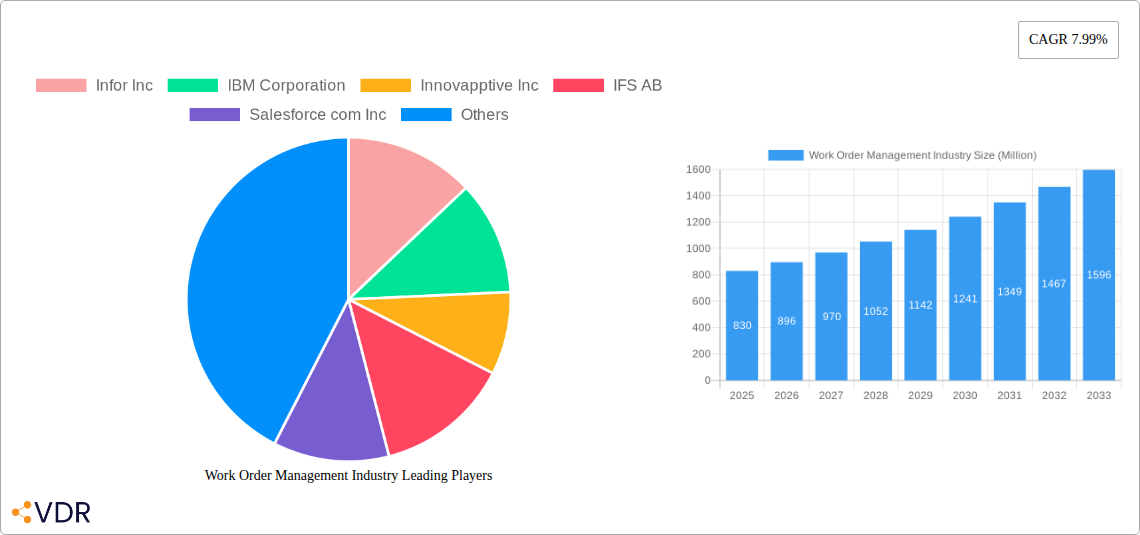
The Work Order Management (WOM) industry, currently valued at $0.83 billion in 2025, is experiencing robust growth, projected to expand at a Compound Annual Growth Rate (CAGR) of 7.99% from 2025 to 2033. This growth is fueled by several key drivers. The increasing adoption of cloud-based solutions offers scalability and accessibility, reducing IT infrastructure costs and improving operational efficiency for businesses of all sizes. Furthermore, the rising demand for enhanced operational visibility and predictive maintenance capabilities within sectors like manufacturing, transportation and logistics, and energy & utilities is significantly boosting market expansion. Improved data analytics integrated into WOM systems enables better resource allocation, minimizes downtime, and optimizes maintenance schedules, leading to significant cost savings and improved productivity. The shift towards Industry 4.0 and the Internet of Things (IoT) further accelerates adoption, facilitating real-time data collection and automated work order generation. While the initial investment in new systems can present a restraint, the long-term ROI and competitive advantages are compelling businesses to embrace WOM solutions. The market is segmented by component (solutions and services), deployment mode (on-premise and cloud), and end-user industry (manufacturing, transportation and logistics, energy & utilities, healthcare, BFSI, telecom and IT, and others). Major players like Infor, IBM, Innovapptive, IFS, Salesforce, Microsoft, and SAP are actively competing in this dynamic market, driving innovation and expanding market reach.
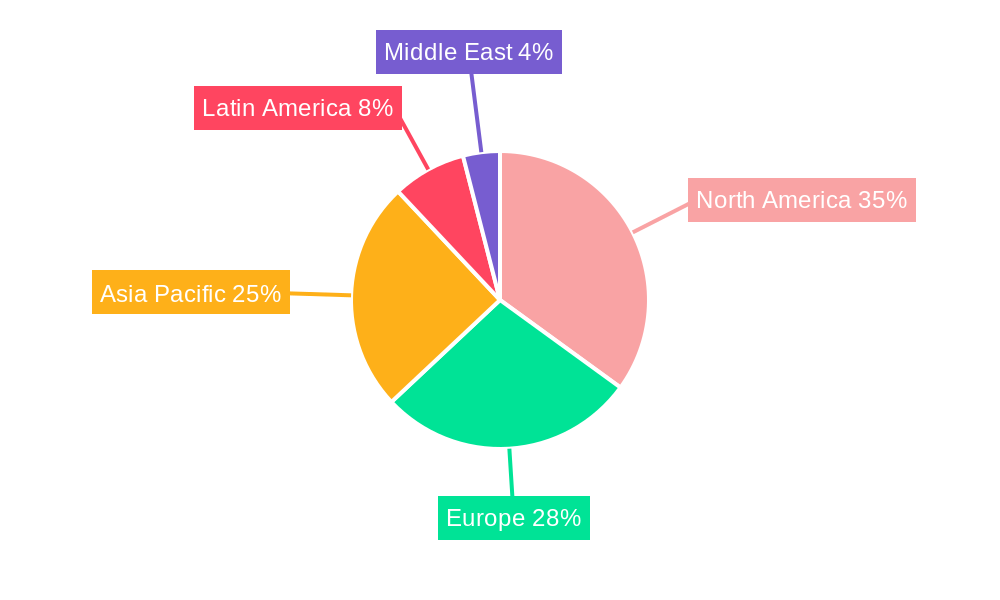
The projected growth of the WOM market is expected to be particularly strong in the Asia-Pacific region, driven by rapid industrialization and increasing digitalization across various sectors. North America and Europe will maintain significant market shares due to established IT infrastructure and high adoption rates of advanced technologies. However, growth in these regions may be slightly slower compared to the Asia-Pacific region. The continued focus on improving operational efficiency and reducing maintenance costs will remain a key driver, pushing market expansion across all segments. The increasing complexity of equipment and infrastructure demands more sophisticated WOM solutions, further driving market growth. Competition amongst vendors will likely intensify, resulting in innovation and potentially price reductions, making WOM solutions more accessible to smaller businesses.
Work Order Management Market Report: 2019-2033
This comprehensive report provides an in-depth analysis of the Work Order Management (WOM) industry, encompassing market dynamics, growth trends, regional performance, and key players. With a focus on parent market (Enterprise Resource Planning) and child markets (Maintenance Management Software, Field Service Management), this report offers invaluable insights for businesses operating within, or seeking to enter, this dynamic sector. The study period covers 2019-2033, with 2025 as the base and estimated year, and a forecast period of 2025-2033.
Work Order Management Industry Market Dynamics & Structure
This section analyzes the competitive landscape, technological advancements, regulatory influences, and market consolidation within the WOM industry. The market is characterized by a mix of established players and emerging technologies, resulting in a dynamic and competitive environment.
- Market Concentration: The market exhibits moderate concentration, with key players holding significant shares but also numerous smaller niche players. xx% of the market is dominated by the top 5 players in 2025, estimated at $xx Billion.
- Technological Innovation: Cloud-based solutions, AI-powered predictive maintenance, and IoT integration are driving innovation, enhancing efficiency and data analysis capabilities. However, integration complexities and legacy system limitations present significant barriers to adoption.
- Regulatory Frameworks: Industry-specific regulations (e.g., HIPAA in healthcare) influence software development and deployment, creating opportunities for specialized solutions. Compliance costs represent a barrier for smaller companies.
- Competitive Substitutes: Spreadsheet-based tracking and rudimentary scheduling systems pose competition, especially in smaller businesses, but advanced functionality and data management capabilities of WOM solutions provide a strong competitive advantage.
- End-User Demographics: The market caters to a wide range of industries, including manufacturing, healthcare, transportation, and energy, with diverse needs influencing software customization and deployment strategies.
- M&A Trends: Consolidation is occurring, with larger companies acquiring smaller players to expand their product portfolios and market reach. The number of M&A deals in the WOM industry averaged xx per year between 2019 and 2024, suggesting a high level of activity.
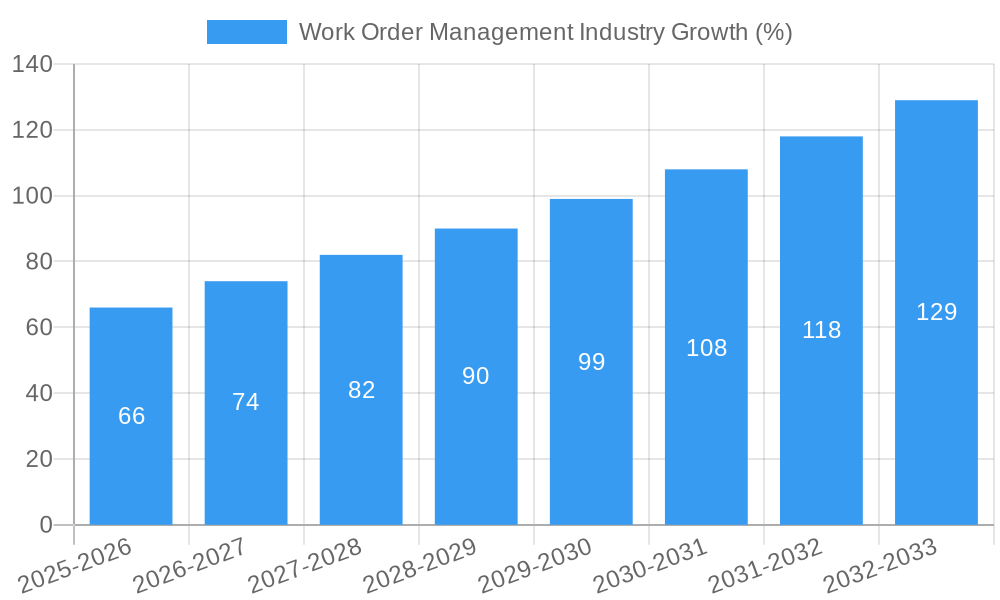
Work Order Management Industry Growth Trends & Insights
The WOM market exhibits robust growth, driven by increasing adoption of cloud-based solutions and a greater focus on operational efficiency across industries. The market size experienced a CAGR of xx% during the historical period (2019-2024), reaching $xx Billion in 2024. This growth is anticipated to continue throughout the forecast period, with a projected CAGR of xx% from 2025 to 2033, reaching an estimated $xx Billion by 2033. The rise of the Internet of Things (IoT) and advancements in AI are significantly impacting adoption rates, particularly in industries requiring real-time data analysis for predictive maintenance and optimized resource allocation. Changing consumer behavior towards digital solutions and data-driven decision-making further fuels market growth.
Dominant Regions, Countries, or Segments in Work Order Management Industry
North America currently dominates the WOM market, driven by early adoption of advanced technologies and a robust digital infrastructure. However, Asia-Pacific is projected to experience the fastest growth rate during the forecast period, fueled by increasing industrialization and government initiatives to digitize operations.
By Component: The solutions segment holds the largest market share, driven by high demand for advanced software capabilities. However, the services segment is experiencing faster growth due to increasing demand for implementation, training, and support services.
By Deployment Mode: The cloud segment is witnessing significantly higher growth than the on-premise segment due to its scalability, cost-effectiveness, and accessibility.
By End-user Industry: Manufacturing, Transportation & Logistics, and Energy & Utilities represent the largest end-user segments, driven by the critical need for efficient maintenance and operations management.
- Key Drivers (North America): Advanced digital infrastructure, early adoption of technologies, high investment in automation.
- Key Drivers (Asia-Pacific): Rapid industrialization, government initiatives supporting digital transformation, large and growing manufacturing sector.
- Market Share: North America holds approximately xx% of the market share in 2025, while Asia-Pacific holds xx%.
Work Order Management Industry Product Landscape
WOM solutions are evolving beyond basic task scheduling, incorporating features like mobile accessibility, real-time tracking, and advanced analytics dashboards. Integration with IoT devices allows for predictive maintenance, optimizing resource allocation and minimizing downtime. Unique selling propositions focus on user-friendliness, customizability, and seamless integration with existing enterprise systems. Technological advancements concentrate on enhancing data security, scalability, and AI-driven functionalities.
Key Drivers, Barriers & Challenges in Work Order Management Industry
Key Drivers:
- Increased demand for operational efficiency.
- Growing adoption of cloud computing and mobile technologies.
- Rise of the Internet of Things (IoT) and its integration with WOM systems.
- Government regulations promoting digitalization.
Key Challenges:
- High initial investment costs for implementing WOM solutions.
- Difficulty in integrating with legacy systems.
- Data security and privacy concerns.
- Resistance to change from employees accustomed to traditional methods. This leads to an estimated xx% of projects facing implementation challenges.
Emerging Opportunities in Work Order Management Industry
- Expansion into untapped markets (e.g., small and medium-sized enterprises in developing economies).
- Development of specialized WOM solutions for specific industries (e.g., healthcare, renewable energy).
- Integration of artificial intelligence (AI) and machine learning (ML) for predictive maintenance and optimization.
- Growing demand for mobile-first WOM solutions.
Growth Accelerators in the Work Order Management Industry Industry
Strategic partnerships between WOM providers and technology companies (e.g., IoT device manufacturers, cloud service providers) will fuel growth. Technological breakthroughs in AI and machine learning for predictive maintenance and automation will accelerate adoption. Market expansion into new geographic regions and expansion into niche segments will drive significant revenue growth in the coming years.
Key Players Shaping the Work Order Management Industry Market
- Infor Inc
- IBM Corporation
- Innovapptive Inc
- IFS AB
- Salesforce com Inc
- Microsoft Corporation
- ServiceMax Inc
- Oracle Corporation
- Hippo CMMS
- eMaint Enterprises LLC
- SAP SE
Notable Milestones in Work Order Management Industry Sector
- February 2023: Ecom Express launches its Warehouse Management Solutions (WMS) and Order Management Solutions (OMS), Ecom Magnum, impacting the market by focusing on small sellers' needs and creating an advanced ecosystem.
In-Depth Work Order Management Industry Market Outlook
The WOM market is poised for continued strong growth, driven by ongoing technological advancements, increasing demand for operational efficiency across industries, and the expanding adoption of cloud-based solutions. Strategic partnerships, investments in R&D, and expansion into new markets will present significant opportunities for key players. The market's future potential is substantial, presenting lucrative opportunities for both established players and new entrants.
Work Order Management Industry Segmentation
-
1. Component
- 1.1. Solutions
- 1.2. Services
-
2. Deployment Mode
- 2.1. On-Premise
- 2.2. Cloud
-
3. End-user Industry
- 3.1. Manufacturing
- 3.2. Transportation and Logistics
- 3.3. Energy & Utilities
- 3.4. Healthcare
- 3.5. BFSI
- 3.6. Telecom and IT
- 3.7. Other End-user Industries
Work Order Management Industry Segmentation By Geography
- 1. North America
- 2. Europe
- 3. Asia Pacific
- 4. Latin America
- 5. Middle East
Work Order Management Industry REPORT HIGHLIGHTS
| Aspects | Details |
|---|---|
| Study Period | 2019-2033 |
| Base Year | 2024 |
| Estimated Year | 2025 |
| Forecast Period | 2025-2033 |
| Historical Period | 2019-2024 |
| Growth Rate | CAGR of 7.99% from 2019-2033 |
| Segmentation |
|
Table of Contents
- 1. Introduction
- 1.1. Research Scope
- 1.2. Market Segmentation
- 1.3. Research Methodology
- 1.4. Definitions and Assumptions
- 2. Executive Summary
- 2.1. Introduction
- 3. Market Dynamics
- 3.1. Introduction
- 3.2. Market Drivers
- 3.2.1. Adoption of Mobile and Wearable Devices Among Field Workers; Enterprise Propensity Towards Optimizing Work for Better Execution of Projects
- 3.3. Market Restrains
- 3.3.1. Lack of Expertise Among Field Workers
- 3.4. Market Trends
- 3.4.1. Manufacturing Expected to Exhibit Significant Adoption
- 4. Market Factor Analysis
- 4.1. Porters Five Forces
- 4.2. Supply/Value Chain
- 4.3. PESTEL analysis
- 4.4. Market Entropy
- 4.5. Patent/Trademark Analysis
- 5. Global Work Order Management Industry Analysis, Insights and Forecast, 2019-2031
- 5.1. Market Analysis, Insights and Forecast - by Component
- 5.1.1. Solutions
- 5.1.2. Services
- 5.2. Market Analysis, Insights and Forecast - by Deployment Mode
- 5.2.1. On-Premise
- 5.2.2. Cloud
- 5.3. Market Analysis, Insights and Forecast - by End-user Industry
- 5.3.1. Manufacturing
- 5.3.2. Transportation and Logistics
- 5.3.3. Energy & Utilities
- 5.3.4. Healthcare
- 5.3.5. BFSI
- 5.3.6. Telecom and IT
- 5.3.7. Other End-user Industries
- 5.4. Market Analysis, Insights and Forecast - by Region
- 5.4.1. North America
- 5.4.2. Europe
- 5.4.3. Asia Pacific
- 5.4.4. Latin America
- 5.4.5. Middle East
- 5.1. Market Analysis, Insights and Forecast - by Component
- 6. North America Work Order Management Industry Analysis, Insights and Forecast, 2019-2031
- 6.1. Market Analysis, Insights and Forecast - by Component
- 6.1.1. Solutions
- 6.1.2. Services
- 6.2. Market Analysis, Insights and Forecast - by Deployment Mode
- 6.2.1. On-Premise
- 6.2.2. Cloud
- 6.3. Market Analysis, Insights and Forecast - by End-user Industry
- 6.3.1. Manufacturing
- 6.3.2. Transportation and Logistics
- 6.3.3. Energy & Utilities
- 6.3.4. Healthcare
- 6.3.5. BFSI
- 6.3.6. Telecom and IT
- 6.3.7. Other End-user Industries
- 6.1. Market Analysis, Insights and Forecast - by Component
- 7. Europe Work Order Management Industry Analysis, Insights and Forecast, 2019-2031
- 7.1. Market Analysis, Insights and Forecast - by Component
- 7.1.1. Solutions
- 7.1.2. Services
- 7.2. Market Analysis, Insights and Forecast - by Deployment Mode
- 7.2.1. On-Premise
- 7.2.2. Cloud
- 7.3. Market Analysis, Insights and Forecast - by End-user Industry
- 7.3.1. Manufacturing
- 7.3.2. Transportation and Logistics
- 7.3.3. Energy & Utilities
- 7.3.4. Healthcare
- 7.3.5. BFSI
- 7.3.6. Telecom and IT
- 7.3.7. Other End-user Industries
- 7.1. Market Analysis, Insights and Forecast - by Component
- 8. Asia Pacific Work Order Management Industry Analysis, Insights and Forecast, 2019-2031
- 8.1. Market Analysis, Insights and Forecast - by Component
- 8.1.1. Solutions
- 8.1.2. Services
- 8.2. Market Analysis, Insights and Forecast - by Deployment Mode
- 8.2.1. On-Premise
- 8.2.2. Cloud
- 8.3. Market Analysis, Insights and Forecast - by End-user Industry
- 8.3.1. Manufacturing
- 8.3.2. Transportation and Logistics
- 8.3.3. Energy & Utilities
- 8.3.4. Healthcare
- 8.3.5. BFSI
- 8.3.6. Telecom and IT
- 8.3.7. Other End-user Industries
- 8.1. Market Analysis, Insights and Forecast - by Component
- 9. Latin America Work Order Management Industry Analysis, Insights and Forecast, 2019-2031
- 9.1. Market Analysis, Insights and Forecast - by Component
- 9.1.1. Solutions
- 9.1.2. Services
- 9.2. Market Analysis, Insights and Forecast - by Deployment Mode
- 9.2.1. On-Premise
- 9.2.2. Cloud
- 9.3. Market Analysis, Insights and Forecast - by End-user Industry
- 9.3.1. Manufacturing
- 9.3.2. Transportation and Logistics
- 9.3.3. Energy & Utilities
- 9.3.4. Healthcare
- 9.3.5. BFSI
- 9.3.6. Telecom and IT
- 9.3.7. Other End-user Industries
- 9.1. Market Analysis, Insights and Forecast - by Component
- 10. Middle East Work Order Management Industry Analysis, Insights and Forecast, 2019-2031
- 10.1. Market Analysis, Insights and Forecast - by Component
- 10.1.1. Solutions
- 10.1.2. Services
- 10.2. Market Analysis, Insights and Forecast - by Deployment Mode
- 10.2.1. On-Premise
- 10.2.2. Cloud
- 10.3. Market Analysis, Insights and Forecast - by End-user Industry
- 10.3.1. Manufacturing
- 10.3.2. Transportation and Logistics
- 10.3.3. Energy & Utilities
- 10.3.4. Healthcare
- 10.3.5. BFSI
- 10.3.6. Telecom and IT
- 10.3.7. Other End-user Industries
- 10.1. Market Analysis, Insights and Forecast - by Component
- 11. North America Work Order Management Industry Analysis, Insights and Forecast, 2019-2031
- 11.1. Market Analysis, Insights and Forecast - By Country/Sub-region
- 11.1.1.
- 12. Europe Work Order Management Industry Analysis, Insights and Forecast, 2019-2031
- 12.1. Market Analysis, Insights and Forecast - By Country/Sub-region
- 12.1.1.
- 13. Asia Pacific Work Order Management Industry Analysis, Insights and Forecast, 2019-2031
- 13.1. Market Analysis, Insights and Forecast - By Country/Sub-region
- 13.1.1.
- 14. Latin America Work Order Management Industry Analysis, Insights and Forecast, 2019-2031
- 14.1. Market Analysis, Insights and Forecast - By Country/Sub-region
- 14.1.1.
- 15. Middle East Work Order Management Industry Analysis, Insights and Forecast, 2019-2031
- 15.1. Market Analysis, Insights and Forecast - By Country/Sub-region
- 15.1.1.
- 16. Competitive Analysis
- 16.1. Global Market Share Analysis 2024
- 16.2. Company Profiles
- 16.2.1 Infor Inc
- 16.2.1.1. Overview
- 16.2.1.2. Products
- 16.2.1.3. SWOT Analysis
- 16.2.1.4. Recent Developments
- 16.2.1.5. Financials (Based on Availability)
- 16.2.2 IBM Corporation
- 16.2.2.1. Overview
- 16.2.2.2. Products
- 16.2.2.3. SWOT Analysis
- 16.2.2.4. Recent Developments
- 16.2.2.5. Financials (Based on Availability)
- 16.2.3 Innovapptive Inc
- 16.2.3.1. Overview
- 16.2.3.2. Products
- 16.2.3.3. SWOT Analysis
- 16.2.3.4. Recent Developments
- 16.2.3.5. Financials (Based on Availability)
- 16.2.4 IFS AB
- 16.2.4.1. Overview
- 16.2.4.2. Products
- 16.2.4.3. SWOT Analysis
- 16.2.4.4. Recent Developments
- 16.2.4.5. Financials (Based on Availability)
- 16.2.5 Salesforce com Inc
- 16.2.5.1. Overview
- 16.2.5.2. Products
- 16.2.5.3. SWOT Analysis
- 16.2.5.4. Recent Developments
- 16.2.5.5. Financials (Based on Availability)
- 16.2.6 Microsoft Corporation
- 16.2.6.1. Overview
- 16.2.6.2. Products
- 16.2.6.3. SWOT Analysis
- 16.2.6.4. Recent Developments
- 16.2.6.5. Financials (Based on Availability)
- 16.2.7 ServiceMax Inc
- 16.2.7.1. Overview
- 16.2.7.2. Products
- 16.2.7.3. SWOT Analysis
- 16.2.7.4. Recent Developments
- 16.2.7.5. Financials (Based on Availability)
- 16.2.8 Oracle Corporation
- 16.2.8.1. Overview
- 16.2.8.2. Products
- 16.2.8.3. SWOT Analysis
- 16.2.8.4. Recent Developments
- 16.2.8.5. Financials (Based on Availability)
- 16.2.9 Hippo CMMS
- 16.2.9.1. Overview
- 16.2.9.2. Products
- 16.2.9.3. SWOT Analysis
- 16.2.9.4. Recent Developments
- 16.2.9.5. Financials (Based on Availability)
- 16.2.10 eMaint Enterprises LLC*List Not Exhaustive
- 16.2.10.1. Overview
- 16.2.10.2. Products
- 16.2.10.3. SWOT Analysis
- 16.2.10.4. Recent Developments
- 16.2.10.5. Financials (Based on Availability)
- 16.2.11 SAP SE
- 16.2.11.1. Overview
- 16.2.11.2. Products
- 16.2.11.3. SWOT Analysis
- 16.2.11.4. Recent Developments
- 16.2.11.5. Financials (Based on Availability)
- 16.2.1 Infor Inc
List of Figures
- Figure 1: Global Work Order Management Industry Revenue Breakdown (Million, %) by Region 2024 & 2032
- Figure 2: North America Work Order Management Industry Revenue (Million), by Country 2024 & 2032
- Figure 3: North America Work Order Management Industry Revenue Share (%), by Country 2024 & 2032
- Figure 4: Europe Work Order Management Industry Revenue (Million), by Country 2024 & 2032
- Figure 5: Europe Work Order Management Industry Revenue Share (%), by Country 2024 & 2032
- Figure 6: Asia Pacific Work Order Management Industry Revenue (Million), by Country 2024 & 2032
- Figure 7: Asia Pacific Work Order Management Industry Revenue Share (%), by Country 2024 & 2032
- Figure 8: Latin America Work Order Management Industry Revenue (Million), by Country 2024 & 2032
- Figure 9: Latin America Work Order Management Industry Revenue Share (%), by Country 2024 & 2032
- Figure 10: Middle East Work Order Management Industry Revenue (Million), by Country 2024 & 2032
- Figure 11: Middle East Work Order Management Industry Revenue Share (%), by Country 2024 & 2032
- Figure 12: North America Work Order Management Industry Revenue (Million), by Component 2024 & 2032
- Figure 13: North America Work Order Management Industry Revenue Share (%), by Component 2024 & 2032
- Figure 14: North America Work Order Management Industry Revenue (Million), by Deployment Mode 2024 & 2032
- Figure 15: North America Work Order Management Industry Revenue Share (%), by Deployment Mode 2024 & 2032
- Figure 16: North America Work Order Management Industry Revenue (Million), by End-user Industry 2024 & 2032
- Figure 17: North America Work Order Management Industry Revenue Share (%), by End-user Industry 2024 & 2032
- Figure 18: North America Work Order Management Industry Revenue (Million), by Country 2024 & 2032
- Figure 19: North America Work Order Management Industry Revenue Share (%), by Country 2024 & 2032
- Figure 20: Europe Work Order Management Industry Revenue (Million), by Component 2024 & 2032
- Figure 21: Europe Work Order Management Industry Revenue Share (%), by Component 2024 & 2032
- Figure 22: Europe Work Order Management Industry Revenue (Million), by Deployment Mode 2024 & 2032
- Figure 23: Europe Work Order Management Industry Revenue Share (%), by Deployment Mode 2024 & 2032
- Figure 24: Europe Work Order Management Industry Revenue (Million), by End-user Industry 2024 & 2032
- Figure 25: Europe Work Order Management Industry Revenue Share (%), by End-user Industry 2024 & 2032
- Figure 26: Europe Work Order Management Industry Revenue (Million), by Country 2024 & 2032
- Figure 27: Europe Work Order Management Industry Revenue Share (%), by Country 2024 & 2032
- Figure 28: Asia Pacific Work Order Management Industry Revenue (Million), by Component 2024 & 2032
- Figure 29: Asia Pacific Work Order Management Industry Revenue Share (%), by Component 2024 & 2032
- Figure 30: Asia Pacific Work Order Management Industry Revenue (Million), by Deployment Mode 2024 & 2032
- Figure 31: Asia Pacific Work Order Management Industry Revenue Share (%), by Deployment Mode 2024 & 2032
- Figure 32: Asia Pacific Work Order Management Industry Revenue (Million), by End-user Industry 2024 & 2032
- Figure 33: Asia Pacific Work Order Management Industry Revenue Share (%), by End-user Industry 2024 & 2032
- Figure 34: Asia Pacific Work Order Management Industry Revenue (Million), by Country 2024 & 2032
- Figure 35: Asia Pacific Work Order Management Industry Revenue Share (%), by Country 2024 & 2032
- Figure 36: Latin America Work Order Management Industry Revenue (Million), by Component 2024 & 2032
- Figure 37: Latin America Work Order Management Industry Revenue Share (%), by Component 2024 & 2032
- Figure 38: Latin America Work Order Management Industry Revenue (Million), by Deployment Mode 2024 & 2032
- Figure 39: Latin America Work Order Management Industry Revenue Share (%), by Deployment Mode 2024 & 2032
- Figure 40: Latin America Work Order Management Industry Revenue (Million), by End-user Industry 2024 & 2032
- Figure 41: Latin America Work Order Management Industry Revenue Share (%), by End-user Industry 2024 & 2032
- Figure 42: Latin America Work Order Management Industry Revenue (Million), by Country 2024 & 2032
- Figure 43: Latin America Work Order Management Industry Revenue Share (%), by Country 2024 & 2032
- Figure 44: Middle East Work Order Management Industry Revenue (Million), by Component 2024 & 2032
- Figure 45: Middle East Work Order Management Industry Revenue Share (%), by Component 2024 & 2032
- Figure 46: Middle East Work Order Management Industry Revenue (Million), by Deployment Mode 2024 & 2032
- Figure 47: Middle East Work Order Management Industry Revenue Share (%), by Deployment Mode 2024 & 2032
- Figure 48: Middle East Work Order Management Industry Revenue (Million), by End-user Industry 2024 & 2032
- Figure 49: Middle East Work Order Management Industry Revenue Share (%), by End-user Industry 2024 & 2032
- Figure 50: Middle East Work Order Management Industry Revenue (Million), by Country 2024 & 2032
- Figure 51: Middle East Work Order Management Industry Revenue Share (%), by Country 2024 & 2032
List of Tables
- Table 1: Global Work Order Management Industry Revenue Million Forecast, by Region 2019 & 2032
- Table 2: Global Work Order Management Industry Revenue Million Forecast, by Component 2019 & 2032
- Table 3: Global Work Order Management Industry Revenue Million Forecast, by Deployment Mode 2019 & 2032
- Table 4: Global Work Order Management Industry Revenue Million Forecast, by End-user Industry 2019 & 2032
- Table 5: Global Work Order Management Industry Revenue Million Forecast, by Region 2019 & 2032
- Table 6: Global Work Order Management Industry Revenue Million Forecast, by Country 2019 & 2032
- Table 7: Work Order Management Industry Revenue (Million) Forecast, by Application 2019 & 2032
- Table 8: Global Work Order Management Industry Revenue Million Forecast, by Country 2019 & 2032
- Table 9: Work Order Management Industry Revenue (Million) Forecast, by Application 2019 & 2032
- Table 10: Global Work Order Management Industry Revenue Million Forecast, by Country 2019 & 2032
- Table 11: Work Order Management Industry Revenue (Million) Forecast, by Application 2019 & 2032
- Table 12: Global Work Order Management Industry Revenue Million Forecast, by Country 2019 & 2032
- Table 13: Work Order Management Industry Revenue (Million) Forecast, by Application 2019 & 2032
- Table 14: Global Work Order Management Industry Revenue Million Forecast, by Country 2019 & 2032
- Table 15: Work Order Management Industry Revenue (Million) Forecast, by Application 2019 & 2032
- Table 16: Global Work Order Management Industry Revenue Million Forecast, by Component 2019 & 2032
- Table 17: Global Work Order Management Industry Revenue Million Forecast, by Deployment Mode 2019 & 2032
- Table 18: Global Work Order Management Industry Revenue Million Forecast, by End-user Industry 2019 & 2032
- Table 19: Global Work Order Management Industry Revenue Million Forecast, by Country 2019 & 2032
- Table 20: Global Work Order Management Industry Revenue Million Forecast, by Component 2019 & 2032
- Table 21: Global Work Order Management Industry Revenue Million Forecast, by Deployment Mode 2019 & 2032
- Table 22: Global Work Order Management Industry Revenue Million Forecast, by End-user Industry 2019 & 2032
- Table 23: Global Work Order Management Industry Revenue Million Forecast, by Country 2019 & 2032
- Table 24: Global Work Order Management Industry Revenue Million Forecast, by Component 2019 & 2032
- Table 25: Global Work Order Management Industry Revenue Million Forecast, by Deployment Mode 2019 & 2032
- Table 26: Global Work Order Management Industry Revenue Million Forecast, by End-user Industry 2019 & 2032
- Table 27: Global Work Order Management Industry Revenue Million Forecast, by Country 2019 & 2032
- Table 28: Global Work Order Management Industry Revenue Million Forecast, by Component 2019 & 2032
- Table 29: Global Work Order Management Industry Revenue Million Forecast, by Deployment Mode 2019 & 2032
- Table 30: Global Work Order Management Industry Revenue Million Forecast, by End-user Industry 2019 & 2032
- Table 31: Global Work Order Management Industry Revenue Million Forecast, by Country 2019 & 2032
- Table 32: Global Work Order Management Industry Revenue Million Forecast, by Component 2019 & 2032
- Table 33: Global Work Order Management Industry Revenue Million Forecast, by Deployment Mode 2019 & 2032
- Table 34: Global Work Order Management Industry Revenue Million Forecast, by End-user Industry 2019 & 2032
- Table 35: Global Work Order Management Industry Revenue Million Forecast, by Country 2019 & 2032
Frequently Asked Questions
1. What is the projected Compound Annual Growth Rate (CAGR) of the Work Order Management Industry?
The projected CAGR is approximately 7.99%.
2. Which companies are prominent players in the Work Order Management Industry?
Key companies in the market include Infor Inc, IBM Corporation, Innovapptive Inc, IFS AB, Salesforce com Inc, Microsoft Corporation, ServiceMax Inc, Oracle Corporation, Hippo CMMS, eMaint Enterprises LLC*List Not Exhaustive, SAP SE.
3. What are the main segments of the Work Order Management Industry?
The market segments include Component, Deployment Mode, End-user Industry.
4. Can you provide details about the market size?
The market size is estimated to be USD 0.83 Million as of 2022.
5. What are some drivers contributing to market growth?
Adoption of Mobile and Wearable Devices Among Field Workers; Enterprise Propensity Towards Optimizing Work for Better Execution of Projects.
6. What are the notable trends driving market growth?
Manufacturing Expected to Exhibit Significant Adoption.
7. Are there any restraints impacting market growth?
Lack of Expertise Among Field Workers.
8. Can you provide examples of recent developments in the market?
In February 2023 - Ecom Express launched its Warehouse Management Solutions (WMS) and Order Management Solutions (OMS), Ecom Magnum as a service offering for sellers. With the launch of this new platform, the company is focusing on removing pain points for small sellers in the standard OMS and WMS available in the market by offering a ecosystem with advance features.
9. What pricing options are available for accessing the report?
Pricing options include single-user, multi-user, and enterprise licenses priced at USD 4750, USD 5250, and USD 8750 respectively.
10. Is the market size provided in terms of value or volume?
The market size is provided in terms of value, measured in Million.
11. Are there any specific market keywords associated with the report?
Yes, the market keyword associated with the report is "Work Order Management Industry," which aids in identifying and referencing the specific market segment covered.
12. How do I determine which pricing option suits my needs best?
The pricing options vary based on user requirements and access needs. Individual users may opt for single-user licenses, while businesses requiring broader access may choose multi-user or enterprise licenses for cost-effective access to the report.
13. Are there any additional resources or data provided in the Work Order Management Industry report?
While the report offers comprehensive insights, it's advisable to review the specific contents or supplementary materials provided to ascertain if additional resources or data are available.
14. How can I stay updated on further developments or reports in the Work Order Management Industry?
To stay informed about further developments, trends, and reports in the Work Order Management Industry, consider subscribing to industry newsletters, following relevant companies and organizations, or regularly checking reputable industry news sources and publications.
Methodology
Step 1 - Identification of Relevant Samples Size from Population Database


Step 2 - Approaches for Defining Global Market Size (Value, Volume* & Price*)

Note*: In applicable scenarios
Step 3 - Data Sources
Primary Research
- Web Analytics
- Survey Reports
- Research Institute
- Latest Research Reports
- Opinion Leaders
Secondary Research
- Annual Reports
- White Paper
- Latest Press Release
- Industry Association
- Paid Database
- Investor Presentations

Step 4 - Data Triangulation
Involves using different sources of information in order to increase the validity of a study
These sources are likely to be stakeholders in a program - participants, other researchers, program staff, other community members, and so on.
Then we put all data in single framework & apply various statistical tools to find out the dynamic on the market.
During the analysis stage, feedback from the stakeholder groups would be compared to determine areas of agreement as well as areas of divergence


