
Key Insights
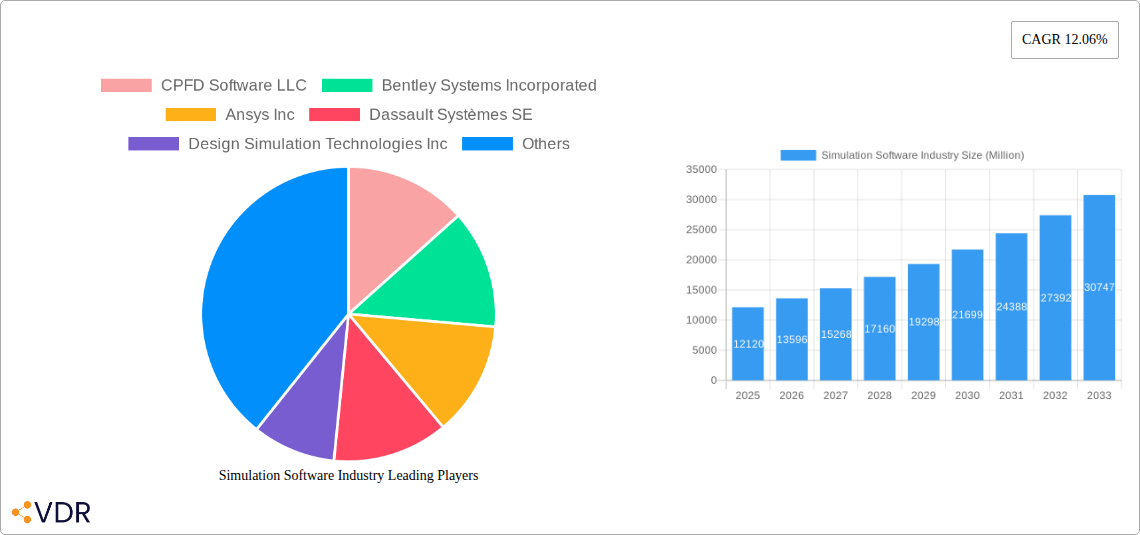
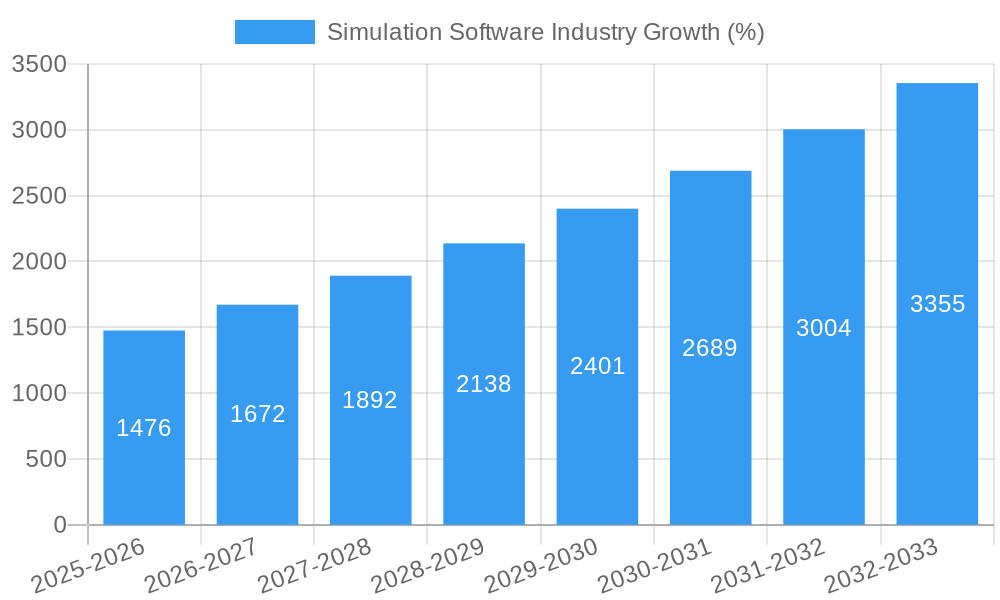
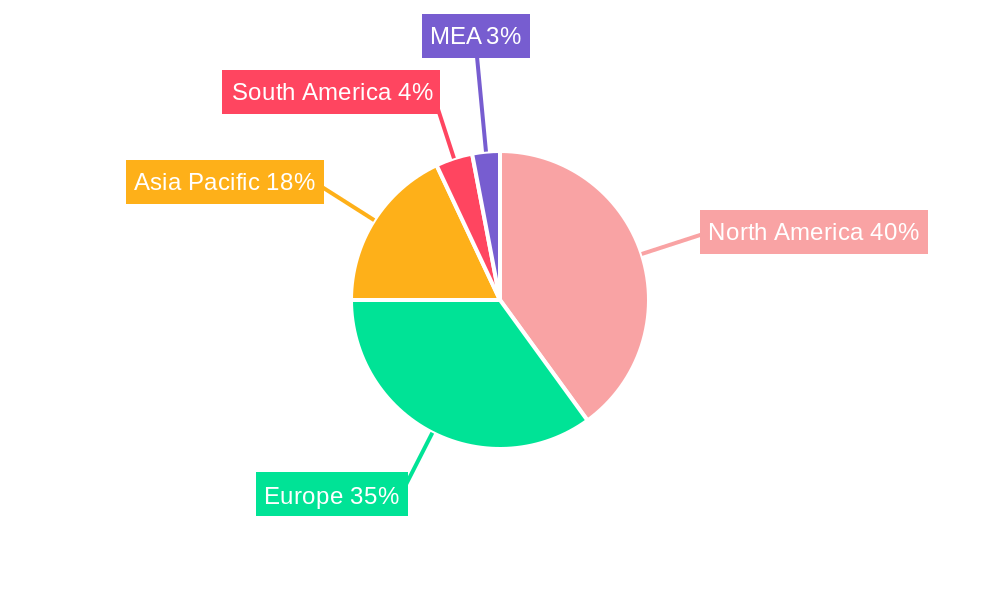
The simulation software market, valued at $12.12 billion in 2025, is projected to experience robust growth, driven by increasing demand across diverse sectors. A Compound Annual Growth Rate (CAGR) of 12.06% from 2025 to 2033 signifies a significant expansion, fueled by the rising adoption of digital twins, the need for enhanced product design and development, and the growing complexity of engineering challenges. Key drivers include the automotive industry's push for advanced vehicle designs, the telecommunications sector's need for efficient network simulations, and the increasing focus on optimization within aerospace and defense. The cloud-based deployment model is gaining traction, offering scalability and cost-effectiveness compared to on-premise solutions. While the market faces certain restraints, such as the high initial investment costs associated with simulation software and the requirement for specialized expertise, the overall growth trajectory remains positive. The market segmentation reflects this diverse application, with significant contributions anticipated from North America and Europe, followed by Asia-Pacific and other regions. Competition among established players and emerging companies ensures a dynamic and innovative market landscape.
The substantial growth is further amplified by the continuous evolution of simulation technologies, including advancements in high-performance computing, artificial intelligence (AI), and machine learning (ML) integration. These advancements enable more accurate and efficient simulations, leading to faster product development cycles and reduced costs. The increasing availability of affordable cloud computing resources is also a significant factor, democratizing access to advanced simulation capabilities for smaller companies and research institutions. While the "Other End-user Industries" segment presents opportunities for expansion, automotive, IT and telecommunications, and aerospace and defense are expected to remain the largest market segments throughout the forecast period. Geographic expansion, particularly in developing economies in Asia-Pacific and South America, will play a crucial role in driving future market growth.
Simulation Software Industry Market Report: 2019-2033
This comprehensive report provides an in-depth analysis of the simulation software market, encompassing market dynamics, growth trends, regional dominance, product landscape, key players, and future outlook. The study period covers 2019-2033, with a base year of 2025 and a forecast period of 2025-2033. The report is essential for industry professionals, investors, and anyone seeking to understand this rapidly evolving market. The total market size is predicted to reach xx Million by 2033.
Simulation Software Industry Market Dynamics & Structure
The simulation software market is characterized by a moderately concentrated landscape with several major players holding significant market share. Technological innovation, driven by advancements in AI, machine learning, and high-performance computing, is a primary growth driver. Regulatory frameworks, particularly concerning data privacy and security in specific industries, influence market adoption. The market faces competition from alternative analytical methods and internal development of custom solutions. End-user demographics are shifting towards greater adoption across diverse sectors, fuelled by increasing demand for digitalization and efficiency. M&A activity remains significant, with xx deals recorded in the historical period (2019-2024), reflecting consolidation and expansion strategies.
- Market Concentration: Moderately concentrated, with top 5 players holding approximately xx% of the market share in 2024.
- Technological Innovation: AI, Machine Learning, and High-Performance Computing are key drivers.
- Regulatory Frameworks: Data privacy regulations impact adoption rates across sectors.
- Competitive Substitutes: Alternative analytical methods and custom in-house solutions pose a competitive threat.
- M&A Activity: xx deals in 2019-2024, indicating a trend of consolidation and market expansion.
- Innovation Barriers: High development costs, specialized talent requirements, and integration complexities.
Simulation Software Industry Growth Trends & Insights
The simulation software market exhibited robust growth during the historical period (2019-2024), with a CAGR of xx%. This growth is primarily attributed to increasing demand for digitalization, optimization, and cost reduction across various industries. The adoption rate is accelerating, particularly in sectors like automotive and aerospace, driven by the need for enhanced product development and testing processes. Technological disruptions, including the rise of cloud-based solutions and the integration of AI, are reshaping the market landscape. Consumer behavior shifts towards preference for user-friendly interfaces and cost-effective solutions are also influencing market dynamics. The market size is expected to reach xx Million by 2025 and xx Million by 2033, indicating continued robust growth. Market penetration in key segments remains relatively low, indicating significant untapped potential.
Dominant Regions, Countries, or Segments in Simulation Software Industry
North America currently dominates the simulation software market, followed by Europe. Within deployment types, the cloud segment is experiencing the fastest growth, driven by scalability, accessibility, and cost-effectiveness. The automotive, aerospace & defense, and IT & telecommunication sectors are the largest end-user industries.
- North America: Dominant due to strong technological advancements, high R&D spending, and early adoption of simulation technologies.
- Europe: Significant market presence, driven by strong industrial sectors and governmental support for digitalization initiatives.
- Cloud Deployment: Fastest-growing segment due to scalability, accessibility, and cost-effectiveness.
- Automotive: Largest end-user industry, driven by the need for enhanced vehicle design and testing.
- Aerospace & Defense: High demand for sophisticated simulation tools for aircraft and weapon system development.
- IT & Telecommunications: Growing adoption for network optimization and performance analysis.
Simulation Software Industry Product Landscape
Simulation software offerings encompass a wide range of solutions, tailored to specific industry needs. These products are characterized by advanced features, such as real-time simulation, multiphysics capabilities, and integration with other engineering tools. Key performance metrics include accuracy, speed, and ease of use. Unique selling propositions often center on specialized algorithms, superior visualization capabilities, and seamless integration with existing workflows. Recent advancements focus on AI-driven automation, improved user interfaces, and expanded cloud-based functionalities.
Key Drivers, Barriers & Challenges in Simulation Software Industry
Key Drivers:
- Increasing demand for product optimization and innovation across industries.
- Growing adoption of digital twin technology for predictive maintenance and improved operational efficiency.
- Rise of cloud-based solutions enabling enhanced accessibility and scalability.
Key Challenges and Restraints:
- High initial investment costs for software licenses and infrastructure.
- Complexity in software implementation and integration with existing systems.
- Skilled workforce shortage limits widespread adoption of advanced simulation techniques. This shortage leads to increased development time and project delays, impacting approximately xx% of projects.
Emerging Opportunities in Simulation Software Industry
- Expanding applications in areas such as smart cities, renewable energy, and healthcare.
- Growing demand for specialized simulation tools for niche industries, such as pharmaceuticals and biotechnology.
- Rise of simulation-as-a-service (SaaS) models offering flexible and cost-effective access to advanced capabilities.
Growth Accelerators in the Simulation Software Industry
Technological breakthroughs, particularly in AI, machine learning, and high-performance computing, are key catalysts for market growth. Strategic partnerships between software vendors and industry players accelerate innovation and adoption. Expansion into emerging markets, particularly in Asia-Pacific and Latin America, presents significant growth potential.
Key Players Shaping the Simulation Software Industry Market
- CPFD Software LLC
- Bentley Systems Incorporated
- Ansys Inc
- Dassault Systèmes SE
- Design Simulation Technologies Inc
- Schneider Electric SE
- SolidWorks Corporation
- SIMUL8 Corporation
- Cybernet Systems Corp
- Simio LLC
- Siemens AG
- Altair Engineering Inc
- CONSELF Srl
- PTC Inc
- The MathWorks Inc
- Autodesk Inc
- Synopsys Inc
- Rockwell Automation Inc
- The COMSOL Group
- Lanner Group Ltd
Notable Milestones in Simulation Software Industry Sector
- March 2023: Simulations Plus, Inc. announces a cooperative research contract with the Institute of Medical Biology of the Polish Academy of Sciences for AI-driven drug development.
- January 2023: Real-Time Innovations (RTI) partners with Ansys to accelerate development of high-performance, high-reliability distributed systems simulation.
In-Depth Simulation Software Industry Market Outlook
The simulation software market is poised for sustained growth driven by technological advancements, increasing digitalization across industries, and the emergence of new applications. Strategic partnerships and expansion into untapped markets will further fuel market expansion. The focus on user-friendly interfaces, cloud-based solutions, and AI-powered capabilities will shape future market dynamics, creating lucrative opportunities for innovative players.
Simulation Software Industry Segmentation
-
1. Deployment Type
- 1.1. On-premise
- 1.2. Cloud
-
2. End-user Industry
- 2.1. Automotive
- 2.2. IT and Telecommunication
- 2.3. Aerospace and Defense
- 2.4. Energy and Mining
- 2.5. Education and Research
- 2.6. Electrical and Electronics
- 2.7. Other End-user Industries
Simulation Software Industry Segmentation By Geography
- 1. North America
- 2. Europe
- 3. Asia
- 4. Australia and New Zealand
- 5. Latin America
- 6. Middle East and Africa
Simulation Software Industry REPORT HIGHLIGHTS
| Aspects | Details |
|---|---|
| Study Period | 2019-2033 |
| Base Year | 2024 |
| Estimated Year | 2025 |
| Forecast Period | 2025-2033 |
| Historical Period | 2019-2024 |
| Growth Rate | CAGR of 12.06% from 2019-2033 |
| Segmentation |
|
Table of Contents
- 1. Introduction
- 1.1. Research Scope
- 1.2. Market Segmentation
- 1.3. Research Methodology
- 1.4. Definitions and Assumptions
- 2. Executive Summary
- 2.1. Introduction
- 3. Market Dynamics
- 3.1. Introduction
- 3.2. Market Drivers
- 3.2.1. Growing Automotive Sector
- 3.3. Market Restrains
- 3.3.1. Fluctuating Market Demands and Customization Issues
- 3.4. Market Trends
- 3.4.1. Automotive Segment is expected grow at a faster pace.
- 4. Market Factor Analysis
- 4.1. Porters Five Forces
- 4.2. Supply/Value Chain
- 4.3. PESTEL analysis
- 4.4. Market Entropy
- 4.5. Patent/Trademark Analysis
- 5. Global Simulation Software Industry Analysis, Insights and Forecast, 2019-2031
- 5.1. Market Analysis, Insights and Forecast - by Deployment Type
- 5.1.1. On-premise
- 5.1.2. Cloud
- 5.2. Market Analysis, Insights and Forecast - by End-user Industry
- 5.2.1. Automotive
- 5.2.2. IT and Telecommunication
- 5.2.3. Aerospace and Defense
- 5.2.4. Energy and Mining
- 5.2.5. Education and Research
- 5.2.6. Electrical and Electronics
- 5.2.7. Other End-user Industries
- 5.3. Market Analysis, Insights and Forecast - by Region
- 5.3.1. North America
- 5.3.2. Europe
- 5.3.3. Asia
- 5.3.4. Australia and New Zealand
- 5.3.5. Latin America
- 5.3.6. Middle East and Africa
- 5.1. Market Analysis, Insights and Forecast - by Deployment Type
- 6. North America Simulation Software Industry Analysis, Insights and Forecast, 2019-2031
- 6.1. Market Analysis, Insights and Forecast - by Deployment Type
- 6.1.1. On-premise
- 6.1.2. Cloud
- 6.2. Market Analysis, Insights and Forecast - by End-user Industry
- 6.2.1. Automotive
- 6.2.2. IT and Telecommunication
- 6.2.3. Aerospace and Defense
- 6.2.4. Energy and Mining
- 6.2.5. Education and Research
- 6.2.6. Electrical and Electronics
- 6.2.7. Other End-user Industries
- 6.1. Market Analysis, Insights and Forecast - by Deployment Type
- 7. Europe Simulation Software Industry Analysis, Insights and Forecast, 2019-2031
- 7.1. Market Analysis, Insights and Forecast - by Deployment Type
- 7.1.1. On-premise
- 7.1.2. Cloud
- 7.2. Market Analysis, Insights and Forecast - by End-user Industry
- 7.2.1. Automotive
- 7.2.2. IT and Telecommunication
- 7.2.3. Aerospace and Defense
- 7.2.4. Energy and Mining
- 7.2.5. Education and Research
- 7.2.6. Electrical and Electronics
- 7.2.7. Other End-user Industries
- 7.1. Market Analysis, Insights and Forecast - by Deployment Type
- 8. Asia Simulation Software Industry Analysis, Insights and Forecast, 2019-2031
- 8.1. Market Analysis, Insights and Forecast - by Deployment Type
- 8.1.1. On-premise
- 8.1.2. Cloud
- 8.2. Market Analysis, Insights and Forecast - by End-user Industry
- 8.2.1. Automotive
- 8.2.2. IT and Telecommunication
- 8.2.3. Aerospace and Defense
- 8.2.4. Energy and Mining
- 8.2.5. Education and Research
- 8.2.6. Electrical and Electronics
- 8.2.7. Other End-user Industries
- 8.1. Market Analysis, Insights and Forecast - by Deployment Type
- 9. Australia and New Zealand Simulation Software Industry Analysis, Insights and Forecast, 2019-2031
- 9.1. Market Analysis, Insights and Forecast - by Deployment Type
- 9.1.1. On-premise
- 9.1.2. Cloud
- 9.2. Market Analysis, Insights and Forecast - by End-user Industry
- 9.2.1. Automotive
- 9.2.2. IT and Telecommunication
- 9.2.3. Aerospace and Defense
- 9.2.4. Energy and Mining
- 9.2.5. Education and Research
- 9.2.6. Electrical and Electronics
- 9.2.7. Other End-user Industries
- 9.1. Market Analysis, Insights and Forecast - by Deployment Type
- 10. Latin America Simulation Software Industry Analysis, Insights and Forecast, 2019-2031
- 10.1. Market Analysis, Insights and Forecast - by Deployment Type
- 10.1.1. On-premise
- 10.1.2. Cloud
- 10.2. Market Analysis, Insights and Forecast - by End-user Industry
- 10.2.1. Automotive
- 10.2.2. IT and Telecommunication
- 10.2.3. Aerospace and Defense
- 10.2.4. Energy and Mining
- 10.2.5. Education and Research
- 10.2.6. Electrical and Electronics
- 10.2.7. Other End-user Industries
- 10.1. Market Analysis, Insights and Forecast - by Deployment Type
- 11. Middle East and Africa Simulation Software Industry Analysis, Insights and Forecast, 2019-2031
- 11.1. Market Analysis, Insights and Forecast - by Deployment Type
- 11.1.1. On-premise
- 11.1.2. Cloud
- 11.2. Market Analysis, Insights and Forecast - by End-user Industry
- 11.2.1. Automotive
- 11.2.2. IT and Telecommunication
- 11.2.3. Aerospace and Defense
- 11.2.4. Energy and Mining
- 11.2.5. Education and Research
- 11.2.6. Electrical and Electronics
- 11.2.7. Other End-user Industries
- 11.1. Market Analysis, Insights and Forecast - by Deployment Type
- 12. North America Simulation Software Industry Analysis, Insights and Forecast, 2019-2031
- 12.1. Market Analysis, Insights and Forecast - By Country/Sub-region
- 12.1.1 United States
- 12.1.2 Canada
- 12.1.3 Mexico
- 13. Europe Simulation Software Industry Analysis, Insights and Forecast, 2019-2031
- 13.1. Market Analysis, Insights and Forecast - By Country/Sub-region
- 13.1.1 Germany
- 13.1.2 United Kingdom
- 13.1.3 France
- 13.1.4 Spain
- 13.1.5 Italy
- 13.1.6 Spain
- 13.1.7 Belgium
- 13.1.8 Netherland
- 13.1.9 Nordics
- 13.1.10 Rest of Europe
- 14. Asia Pacific Simulation Software Industry Analysis, Insights and Forecast, 2019-2031
- 14.1. Market Analysis, Insights and Forecast - By Country/Sub-region
- 14.1.1 China
- 14.1.2 Japan
- 14.1.3 India
- 14.1.4 South Korea
- 14.1.5 Southeast Asia
- 14.1.6 Australia
- 14.1.7 Indonesia
- 14.1.8 Phillipes
- 14.1.9 Singapore
- 14.1.10 Thailandc
- 14.1.11 Rest of Asia Pacific
- 15. South America Simulation Software Industry Analysis, Insights and Forecast, 2019-2031
- 15.1. Market Analysis, Insights and Forecast - By Country/Sub-region
- 15.1.1 Brazil
- 15.1.2 Argentina
- 15.1.3 Peru
- 15.1.4 Chile
- 15.1.5 Colombia
- 15.1.6 Ecuador
- 15.1.7 Venezuela
- 15.1.8 Rest of South America
- 16. North America Simulation Software Industry Analysis, Insights and Forecast, 2019-2031
- 16.1. Market Analysis, Insights and Forecast - By Country/Sub-region
- 16.1.1 United States
- 16.1.2 Canada
- 16.1.3 Mexico
- 17. MEA Simulation Software Industry Analysis, Insights and Forecast, 2019-2031
- 17.1. Market Analysis, Insights and Forecast - By Country/Sub-region
- 17.1.1 United Arab Emirates
- 17.1.2 Saudi Arabia
- 17.1.3 South Africa
- 17.1.4 Rest of Middle East and Africa
- 18. Competitive Analysis
- 18.1. Global Market Share Analysis 2024
- 18.2. Company Profiles
- 18.2.1 CPFD Software LLC
- 18.2.1.1. Overview
- 18.2.1.2. Products
- 18.2.1.3. SWOT Analysis
- 18.2.1.4. Recent Developments
- 18.2.1.5. Financials (Based on Availability)
- 18.2.2 Bentley Systems Incorporated
- 18.2.2.1. Overview
- 18.2.2.2. Products
- 18.2.2.3. SWOT Analysis
- 18.2.2.4. Recent Developments
- 18.2.2.5. Financials (Based on Availability)
- 18.2.3 Ansys Inc
- 18.2.3.1. Overview
- 18.2.3.2. Products
- 18.2.3.3. SWOT Analysis
- 18.2.3.4. Recent Developments
- 18.2.3.5. Financials (Based on Availability)
- 18.2.4 Dassault Systèmes SE
- 18.2.4.1. Overview
- 18.2.4.2. Products
- 18.2.4.3. SWOT Analysis
- 18.2.4.4. Recent Developments
- 18.2.4.5. Financials (Based on Availability)
- 18.2.5 Design Simulation Technologies Inc
- 18.2.5.1. Overview
- 18.2.5.2. Products
- 18.2.5.3. SWOT Analysis
- 18.2.5.4. Recent Developments
- 18.2.5.5. Financials (Based on Availability)
- 18.2.6 Schneider Electric SE
- 18.2.6.1. Overview
- 18.2.6.2. Products
- 18.2.6.3. SWOT Analysis
- 18.2.6.4. Recent Developments
- 18.2.6.5. Financials (Based on Availability)
- 18.2.7 SolidWorks Corporation
- 18.2.7.1. Overview
- 18.2.7.2. Products
- 18.2.7.3. SWOT Analysis
- 18.2.7.4. Recent Developments
- 18.2.7.5. Financials (Based on Availability)
- 18.2.8 SIMUL8 Corporation
- 18.2.8.1. Overview
- 18.2.8.2. Products
- 18.2.8.3. SWOT Analysis
- 18.2.8.4. Recent Developments
- 18.2.8.5. Financials (Based on Availability)
- 18.2.9 Cybernet Systems Corp
- 18.2.9.1. Overview
- 18.2.9.2. Products
- 18.2.9.3. SWOT Analysis
- 18.2.9.4. Recent Developments
- 18.2.9.5. Financials (Based on Availability)
- 18.2.10 Simio LLC
- 18.2.10.1. Overview
- 18.2.10.2. Products
- 18.2.10.3. SWOT Analysis
- 18.2.10.4. Recent Developments
- 18.2.10.5. Financials (Based on Availability)
- 18.2.11 Siemens AG
- 18.2.11.1. Overview
- 18.2.11.2. Products
- 18.2.11.3. SWOT Analysis
- 18.2.11.4. Recent Developments
- 18.2.11.5. Financials (Based on Availability)
- 18.2.12 Altair Engineering Inc
- 18.2.12.1. Overview
- 18.2.12.2. Products
- 18.2.12.3. SWOT Analysis
- 18.2.12.4. Recent Developments
- 18.2.12.5. Financials (Based on Availability)
- 18.2.13 CONSELF Srl
- 18.2.13.1. Overview
- 18.2.13.2. Products
- 18.2.13.3. SWOT Analysis
- 18.2.13.4. Recent Developments
- 18.2.13.5. Financials (Based on Availability)
- 18.2.14 PTC Inc
- 18.2.14.1. Overview
- 18.2.14.2. Products
- 18.2.14.3. SWOT Analysis
- 18.2.14.4. Recent Developments
- 18.2.14.5. Financials (Based on Availability)
- 18.2.15 The MathWorks Inc
- 18.2.15.1. Overview
- 18.2.15.2. Products
- 18.2.15.3. SWOT Analysis
- 18.2.15.4. Recent Developments
- 18.2.15.5. Financials (Based on Availability)
- 18.2.16 Autodesk Inc
- 18.2.16.1. Overview
- 18.2.16.2. Products
- 18.2.16.3. SWOT Analysis
- 18.2.16.4. Recent Developments
- 18.2.16.5. Financials (Based on Availability)
- 18.2.17 Synopsys Inc
- 18.2.17.1. Overview
- 18.2.17.2. Products
- 18.2.17.3. SWOT Analysis
- 18.2.17.4. Recent Developments
- 18.2.17.5. Financials (Based on Availability)
- 18.2.18 Rockwell Automation Inc
- 18.2.18.1. Overview
- 18.2.18.2. Products
- 18.2.18.3. SWOT Analysis
- 18.2.18.4. Recent Developments
- 18.2.18.5. Financials (Based on Availability)
- 18.2.19 The COMSOL Group
- 18.2.19.1. Overview
- 18.2.19.2. Products
- 18.2.19.3. SWOT Analysis
- 18.2.19.4. Recent Developments
- 18.2.19.5. Financials (Based on Availability)
- 18.2.20 Lanner Group Ltd
- 18.2.20.1. Overview
- 18.2.20.2. Products
- 18.2.20.3. SWOT Analysis
- 18.2.20.4. Recent Developments
- 18.2.20.5. Financials (Based on Availability)
- 18.2.1 CPFD Software LLC
List of Figures
- Figure 1: Global Simulation Software Industry Revenue Breakdown (Million, %) by Region 2024 & 2032
- Figure 2: Global Simulation Software Industry Volume Breakdown (K Unit, %) by Region 2024 & 2032
- Figure 3: North America Simulation Software Industry Revenue (Million), by Country 2024 & 2032
- Figure 4: North America Simulation Software Industry Volume (K Unit), by Country 2024 & 2032
- Figure 5: North America Simulation Software Industry Revenue Share (%), by Country 2024 & 2032
- Figure 6: North America Simulation Software Industry Volume Share (%), by Country 2024 & 2032
- Figure 7: Europe Simulation Software Industry Revenue (Million), by Country 2024 & 2032
- Figure 8: Europe Simulation Software Industry Volume (K Unit), by Country 2024 & 2032
- Figure 9: Europe Simulation Software Industry Revenue Share (%), by Country 2024 & 2032
- Figure 10: Europe Simulation Software Industry Volume Share (%), by Country 2024 & 2032
- Figure 11: Asia Pacific Simulation Software Industry Revenue (Million), by Country 2024 & 2032
- Figure 12: Asia Pacific Simulation Software Industry Volume (K Unit), by Country 2024 & 2032
- Figure 13: Asia Pacific Simulation Software Industry Revenue Share (%), by Country 2024 & 2032
- Figure 14: Asia Pacific Simulation Software Industry Volume Share (%), by Country 2024 & 2032
- Figure 15: South America Simulation Software Industry Revenue (Million), by Country 2024 & 2032
- Figure 16: South America Simulation Software Industry Volume (K Unit), by Country 2024 & 2032
- Figure 17: South America Simulation Software Industry Revenue Share (%), by Country 2024 & 2032
- Figure 18: South America Simulation Software Industry Volume Share (%), by Country 2024 & 2032
- Figure 19: North America Simulation Software Industry Revenue (Million), by Country 2024 & 2032
- Figure 20: North America Simulation Software Industry Volume (K Unit), by Country 2024 & 2032
- Figure 21: North America Simulation Software Industry Revenue Share (%), by Country 2024 & 2032
- Figure 22: North America Simulation Software Industry Volume Share (%), by Country 2024 & 2032
- Figure 23: MEA Simulation Software Industry Revenue (Million), by Country 2024 & 2032
- Figure 24: MEA Simulation Software Industry Volume (K Unit), by Country 2024 & 2032
- Figure 25: MEA Simulation Software Industry Revenue Share (%), by Country 2024 & 2032
- Figure 26: MEA Simulation Software Industry Volume Share (%), by Country 2024 & 2032
- Figure 27: North America Simulation Software Industry Revenue (Million), by Deployment Type 2024 & 2032
- Figure 28: North America Simulation Software Industry Volume (K Unit), by Deployment Type 2024 & 2032
- Figure 29: North America Simulation Software Industry Revenue Share (%), by Deployment Type 2024 & 2032
- Figure 30: North America Simulation Software Industry Volume Share (%), by Deployment Type 2024 & 2032
- Figure 31: North America Simulation Software Industry Revenue (Million), by End-user Industry 2024 & 2032
- Figure 32: North America Simulation Software Industry Volume (K Unit), by End-user Industry 2024 & 2032
- Figure 33: North America Simulation Software Industry Revenue Share (%), by End-user Industry 2024 & 2032
- Figure 34: North America Simulation Software Industry Volume Share (%), by End-user Industry 2024 & 2032
- Figure 35: North America Simulation Software Industry Revenue (Million), by Country 2024 & 2032
- Figure 36: North America Simulation Software Industry Volume (K Unit), by Country 2024 & 2032
- Figure 37: North America Simulation Software Industry Revenue Share (%), by Country 2024 & 2032
- Figure 38: North America Simulation Software Industry Volume Share (%), by Country 2024 & 2032
- Figure 39: Europe Simulation Software Industry Revenue (Million), by Deployment Type 2024 & 2032
- Figure 40: Europe Simulation Software Industry Volume (K Unit), by Deployment Type 2024 & 2032
- Figure 41: Europe Simulation Software Industry Revenue Share (%), by Deployment Type 2024 & 2032
- Figure 42: Europe Simulation Software Industry Volume Share (%), by Deployment Type 2024 & 2032
- Figure 43: Europe Simulation Software Industry Revenue (Million), by End-user Industry 2024 & 2032
- Figure 44: Europe Simulation Software Industry Volume (K Unit), by End-user Industry 2024 & 2032
- Figure 45: Europe Simulation Software Industry Revenue Share (%), by End-user Industry 2024 & 2032
- Figure 46: Europe Simulation Software Industry Volume Share (%), by End-user Industry 2024 & 2032
- Figure 47: Europe Simulation Software Industry Revenue (Million), by Country 2024 & 2032
- Figure 48: Europe Simulation Software Industry Volume (K Unit), by Country 2024 & 2032
- Figure 49: Europe Simulation Software Industry Revenue Share (%), by Country 2024 & 2032
- Figure 50: Europe Simulation Software Industry Volume Share (%), by Country 2024 & 2032
- Figure 51: Asia Simulation Software Industry Revenue (Million), by Deployment Type 2024 & 2032
- Figure 52: Asia Simulation Software Industry Volume (K Unit), by Deployment Type 2024 & 2032
- Figure 53: Asia Simulation Software Industry Revenue Share (%), by Deployment Type 2024 & 2032
- Figure 54: Asia Simulation Software Industry Volume Share (%), by Deployment Type 2024 & 2032
- Figure 55: Asia Simulation Software Industry Revenue (Million), by End-user Industry 2024 & 2032
- Figure 56: Asia Simulation Software Industry Volume (K Unit), by End-user Industry 2024 & 2032
- Figure 57: Asia Simulation Software Industry Revenue Share (%), by End-user Industry 2024 & 2032
- Figure 58: Asia Simulation Software Industry Volume Share (%), by End-user Industry 2024 & 2032
- Figure 59: Asia Simulation Software Industry Revenue (Million), by Country 2024 & 2032
- Figure 60: Asia Simulation Software Industry Volume (K Unit), by Country 2024 & 2032
- Figure 61: Asia Simulation Software Industry Revenue Share (%), by Country 2024 & 2032
- Figure 62: Asia Simulation Software Industry Volume Share (%), by Country 2024 & 2032
- Figure 63: Australia and New Zealand Simulation Software Industry Revenue (Million), by Deployment Type 2024 & 2032
- Figure 64: Australia and New Zealand Simulation Software Industry Volume (K Unit), by Deployment Type 2024 & 2032
- Figure 65: Australia and New Zealand Simulation Software Industry Revenue Share (%), by Deployment Type 2024 & 2032
- Figure 66: Australia and New Zealand Simulation Software Industry Volume Share (%), by Deployment Type 2024 & 2032
- Figure 67: Australia and New Zealand Simulation Software Industry Revenue (Million), by End-user Industry 2024 & 2032
- Figure 68: Australia and New Zealand Simulation Software Industry Volume (K Unit), by End-user Industry 2024 & 2032
- Figure 69: Australia and New Zealand Simulation Software Industry Revenue Share (%), by End-user Industry 2024 & 2032
- Figure 70: Australia and New Zealand Simulation Software Industry Volume Share (%), by End-user Industry 2024 & 2032
- Figure 71: Australia and New Zealand Simulation Software Industry Revenue (Million), by Country 2024 & 2032
- Figure 72: Australia and New Zealand Simulation Software Industry Volume (K Unit), by Country 2024 & 2032
- Figure 73: Australia and New Zealand Simulation Software Industry Revenue Share (%), by Country 2024 & 2032
- Figure 74: Australia and New Zealand Simulation Software Industry Volume Share (%), by Country 2024 & 2032
- Figure 75: Latin America Simulation Software Industry Revenue (Million), by Deployment Type 2024 & 2032
- Figure 76: Latin America Simulation Software Industry Volume (K Unit), by Deployment Type 2024 & 2032
- Figure 77: Latin America Simulation Software Industry Revenue Share (%), by Deployment Type 2024 & 2032
- Figure 78: Latin America Simulation Software Industry Volume Share (%), by Deployment Type 2024 & 2032
- Figure 79: Latin America Simulation Software Industry Revenue (Million), by End-user Industry 2024 & 2032
- Figure 80: Latin America Simulation Software Industry Volume (K Unit), by End-user Industry 2024 & 2032
- Figure 81: Latin America Simulation Software Industry Revenue Share (%), by End-user Industry 2024 & 2032
- Figure 82: Latin America Simulation Software Industry Volume Share (%), by End-user Industry 2024 & 2032
- Figure 83: Latin America Simulation Software Industry Revenue (Million), by Country 2024 & 2032
- Figure 84: Latin America Simulation Software Industry Volume (K Unit), by Country 2024 & 2032
- Figure 85: Latin America Simulation Software Industry Revenue Share (%), by Country 2024 & 2032
- Figure 86: Latin America Simulation Software Industry Volume Share (%), by Country 2024 & 2032
- Figure 87: Middle East and Africa Simulation Software Industry Revenue (Million), by Deployment Type 2024 & 2032
- Figure 88: Middle East and Africa Simulation Software Industry Volume (K Unit), by Deployment Type 2024 & 2032
- Figure 89: Middle East and Africa Simulation Software Industry Revenue Share (%), by Deployment Type 2024 & 2032
- Figure 90: Middle East and Africa Simulation Software Industry Volume Share (%), by Deployment Type 2024 & 2032
- Figure 91: Middle East and Africa Simulation Software Industry Revenue (Million), by End-user Industry 2024 & 2032
- Figure 92: Middle East and Africa Simulation Software Industry Volume (K Unit), by End-user Industry 2024 & 2032
- Figure 93: Middle East and Africa Simulation Software Industry Revenue Share (%), by End-user Industry 2024 & 2032
- Figure 94: Middle East and Africa Simulation Software Industry Volume Share (%), by End-user Industry 2024 & 2032
- Figure 95: Middle East and Africa Simulation Software Industry Revenue (Million), by Country 2024 & 2032
- Figure 96: Middle East and Africa Simulation Software Industry Volume (K Unit), by Country 2024 & 2032
- Figure 97: Middle East and Africa Simulation Software Industry Revenue Share (%), by Country 2024 & 2032
- Figure 98: Middle East and Africa Simulation Software Industry Volume Share (%), by Country 2024 & 2032
List of Tables
- Table 1: Global Simulation Software Industry Revenue Million Forecast, by Region 2019 & 2032
- Table 2: Global Simulation Software Industry Volume K Unit Forecast, by Region 2019 & 2032
- Table 3: Global Simulation Software Industry Revenue Million Forecast, by Deployment Type 2019 & 2032
- Table 4: Global Simulation Software Industry Volume K Unit Forecast, by Deployment Type 2019 & 2032
- Table 5: Global Simulation Software Industry Revenue Million Forecast, by End-user Industry 2019 & 2032
- Table 6: Global Simulation Software Industry Volume K Unit Forecast, by End-user Industry 2019 & 2032
- Table 7: Global Simulation Software Industry Revenue Million Forecast, by Region 2019 & 2032
- Table 8: Global Simulation Software Industry Volume K Unit Forecast, by Region 2019 & 2032
- Table 9: Global Simulation Software Industry Revenue Million Forecast, by Country 2019 & 2032
- Table 10: Global Simulation Software Industry Volume K Unit Forecast, by Country 2019 & 2032
- Table 11: United States Simulation Software Industry Revenue (Million) Forecast, by Application 2019 & 2032
- Table 12: United States Simulation Software Industry Volume (K Unit) Forecast, by Application 2019 & 2032
- Table 13: Canada Simulation Software Industry Revenue (Million) Forecast, by Application 2019 & 2032
- Table 14: Canada Simulation Software Industry Volume (K Unit) Forecast, by Application 2019 & 2032
- Table 15: Mexico Simulation Software Industry Revenue (Million) Forecast, by Application 2019 & 2032
- Table 16: Mexico Simulation Software Industry Volume (K Unit) Forecast, by Application 2019 & 2032
- Table 17: Global Simulation Software Industry Revenue Million Forecast, by Country 2019 & 2032
- Table 18: Global Simulation Software Industry Volume K Unit Forecast, by Country 2019 & 2032
- Table 19: Germany Simulation Software Industry Revenue (Million) Forecast, by Application 2019 & 2032
- Table 20: Germany Simulation Software Industry Volume (K Unit) Forecast, by Application 2019 & 2032
- Table 21: United Kingdom Simulation Software Industry Revenue (Million) Forecast, by Application 2019 & 2032
- Table 22: United Kingdom Simulation Software Industry Volume (K Unit) Forecast, by Application 2019 & 2032
- Table 23: France Simulation Software Industry Revenue (Million) Forecast, by Application 2019 & 2032
- Table 24: France Simulation Software Industry Volume (K Unit) Forecast, by Application 2019 & 2032
- Table 25: Spain Simulation Software Industry Revenue (Million) Forecast, by Application 2019 & 2032
- Table 26: Spain Simulation Software Industry Volume (K Unit) Forecast, by Application 2019 & 2032
- Table 27: Italy Simulation Software Industry Revenue (Million) Forecast, by Application 2019 & 2032
- Table 28: Italy Simulation Software Industry Volume (K Unit) Forecast, by Application 2019 & 2032
- Table 29: Spain Simulation Software Industry Revenue (Million) Forecast, by Application 2019 & 2032
- Table 30: Spain Simulation Software Industry Volume (K Unit) Forecast, by Application 2019 & 2032
- Table 31: Belgium Simulation Software Industry Revenue (Million) Forecast, by Application 2019 & 2032
- Table 32: Belgium Simulation Software Industry Volume (K Unit) Forecast, by Application 2019 & 2032
- Table 33: Netherland Simulation Software Industry Revenue (Million) Forecast, by Application 2019 & 2032
- Table 34: Netherland Simulation Software Industry Volume (K Unit) Forecast, by Application 2019 & 2032
- Table 35: Nordics Simulation Software Industry Revenue (Million) Forecast, by Application 2019 & 2032
- Table 36: Nordics Simulation Software Industry Volume (K Unit) Forecast, by Application 2019 & 2032
- Table 37: Rest of Europe Simulation Software Industry Revenue (Million) Forecast, by Application 2019 & 2032
- Table 38: Rest of Europe Simulation Software Industry Volume (K Unit) Forecast, by Application 2019 & 2032
- Table 39: Global Simulation Software Industry Revenue Million Forecast, by Country 2019 & 2032
- Table 40: Global Simulation Software Industry Volume K Unit Forecast, by Country 2019 & 2032
- Table 41: China Simulation Software Industry Revenue (Million) Forecast, by Application 2019 & 2032
- Table 42: China Simulation Software Industry Volume (K Unit) Forecast, by Application 2019 & 2032
- Table 43: Japan Simulation Software Industry Revenue (Million) Forecast, by Application 2019 & 2032
- Table 44: Japan Simulation Software Industry Volume (K Unit) Forecast, by Application 2019 & 2032
- Table 45: India Simulation Software Industry Revenue (Million) Forecast, by Application 2019 & 2032
- Table 46: India Simulation Software Industry Volume (K Unit) Forecast, by Application 2019 & 2032
- Table 47: South Korea Simulation Software Industry Revenue (Million) Forecast, by Application 2019 & 2032
- Table 48: South Korea Simulation Software Industry Volume (K Unit) Forecast, by Application 2019 & 2032
- Table 49: Southeast Asia Simulation Software Industry Revenue (Million) Forecast, by Application 2019 & 2032
- Table 50: Southeast Asia Simulation Software Industry Volume (K Unit) Forecast, by Application 2019 & 2032
- Table 51: Australia Simulation Software Industry Revenue (Million) Forecast, by Application 2019 & 2032
- Table 52: Australia Simulation Software Industry Volume (K Unit) Forecast, by Application 2019 & 2032
- Table 53: Indonesia Simulation Software Industry Revenue (Million) Forecast, by Application 2019 & 2032
- Table 54: Indonesia Simulation Software Industry Volume (K Unit) Forecast, by Application 2019 & 2032
- Table 55: Phillipes Simulation Software Industry Revenue (Million) Forecast, by Application 2019 & 2032
- Table 56: Phillipes Simulation Software Industry Volume (K Unit) Forecast, by Application 2019 & 2032
- Table 57: Singapore Simulation Software Industry Revenue (Million) Forecast, by Application 2019 & 2032
- Table 58: Singapore Simulation Software Industry Volume (K Unit) Forecast, by Application 2019 & 2032
- Table 59: Thailandc Simulation Software Industry Revenue (Million) Forecast, by Application 2019 & 2032
- Table 60: Thailandc Simulation Software Industry Volume (K Unit) Forecast, by Application 2019 & 2032
- Table 61: Rest of Asia Pacific Simulation Software Industry Revenue (Million) Forecast, by Application 2019 & 2032
- Table 62: Rest of Asia Pacific Simulation Software Industry Volume (K Unit) Forecast, by Application 2019 & 2032
- Table 63: Global Simulation Software Industry Revenue Million Forecast, by Country 2019 & 2032
- Table 64: Global Simulation Software Industry Volume K Unit Forecast, by Country 2019 & 2032
- Table 65: Brazil Simulation Software Industry Revenue (Million) Forecast, by Application 2019 & 2032
- Table 66: Brazil Simulation Software Industry Volume (K Unit) Forecast, by Application 2019 & 2032
- Table 67: Argentina Simulation Software Industry Revenue (Million) Forecast, by Application 2019 & 2032
- Table 68: Argentina Simulation Software Industry Volume (K Unit) Forecast, by Application 2019 & 2032
- Table 69: Peru Simulation Software Industry Revenue (Million) Forecast, by Application 2019 & 2032
- Table 70: Peru Simulation Software Industry Volume (K Unit) Forecast, by Application 2019 & 2032
- Table 71: Chile Simulation Software Industry Revenue (Million) Forecast, by Application 2019 & 2032
- Table 72: Chile Simulation Software Industry Volume (K Unit) Forecast, by Application 2019 & 2032
- Table 73: Colombia Simulation Software Industry Revenue (Million) Forecast, by Application 2019 & 2032
- Table 74: Colombia Simulation Software Industry Volume (K Unit) Forecast, by Application 2019 & 2032
- Table 75: Ecuador Simulation Software Industry Revenue (Million) Forecast, by Application 2019 & 2032
- Table 76: Ecuador Simulation Software Industry Volume (K Unit) Forecast, by Application 2019 & 2032
- Table 77: Venezuela Simulation Software Industry Revenue (Million) Forecast, by Application 2019 & 2032
- Table 78: Venezuela Simulation Software Industry Volume (K Unit) Forecast, by Application 2019 & 2032
- Table 79: Rest of South America Simulation Software Industry Revenue (Million) Forecast, by Application 2019 & 2032
- Table 80: Rest of South America Simulation Software Industry Volume (K Unit) Forecast, by Application 2019 & 2032
- Table 81: Global Simulation Software Industry Revenue Million Forecast, by Country 2019 & 2032
- Table 82: Global Simulation Software Industry Volume K Unit Forecast, by Country 2019 & 2032
- Table 83: United States Simulation Software Industry Revenue (Million) Forecast, by Application 2019 & 2032
- Table 84: United States Simulation Software Industry Volume (K Unit) Forecast, by Application 2019 & 2032
- Table 85: Canada Simulation Software Industry Revenue (Million) Forecast, by Application 2019 & 2032
- Table 86: Canada Simulation Software Industry Volume (K Unit) Forecast, by Application 2019 & 2032
- Table 87: Mexico Simulation Software Industry Revenue (Million) Forecast, by Application 2019 & 2032
- Table 88: Mexico Simulation Software Industry Volume (K Unit) Forecast, by Application 2019 & 2032
- Table 89: Global Simulation Software Industry Revenue Million Forecast, by Country 2019 & 2032
- Table 90: Global Simulation Software Industry Volume K Unit Forecast, by Country 2019 & 2032
- Table 91: United Arab Emirates Simulation Software Industry Revenue (Million) Forecast, by Application 2019 & 2032
- Table 92: United Arab Emirates Simulation Software Industry Volume (K Unit) Forecast, by Application 2019 & 2032
- Table 93: Saudi Arabia Simulation Software Industry Revenue (Million) Forecast, by Application 2019 & 2032
- Table 94: Saudi Arabia Simulation Software Industry Volume (K Unit) Forecast, by Application 2019 & 2032
- Table 95: South Africa Simulation Software Industry Revenue (Million) Forecast, by Application 2019 & 2032
- Table 96: South Africa Simulation Software Industry Volume (K Unit) Forecast, by Application 2019 & 2032
- Table 97: Rest of Middle East and Africa Simulation Software Industry Revenue (Million) Forecast, by Application 2019 & 2032
- Table 98: Rest of Middle East and Africa Simulation Software Industry Volume (K Unit) Forecast, by Application 2019 & 2032
- Table 99: Global Simulation Software Industry Revenue Million Forecast, by Deployment Type 2019 & 2032
- Table 100: Global Simulation Software Industry Volume K Unit Forecast, by Deployment Type 2019 & 2032
- Table 101: Global Simulation Software Industry Revenue Million Forecast, by End-user Industry 2019 & 2032
- Table 102: Global Simulation Software Industry Volume K Unit Forecast, by End-user Industry 2019 & 2032
- Table 103: Global Simulation Software Industry Revenue Million Forecast, by Country 2019 & 2032
- Table 104: Global Simulation Software Industry Volume K Unit Forecast, by Country 2019 & 2032
- Table 105: Global Simulation Software Industry Revenue Million Forecast, by Deployment Type 2019 & 2032
- Table 106: Global Simulation Software Industry Volume K Unit Forecast, by Deployment Type 2019 & 2032
- Table 107: Global Simulation Software Industry Revenue Million Forecast, by End-user Industry 2019 & 2032
- Table 108: Global Simulation Software Industry Volume K Unit Forecast, by End-user Industry 2019 & 2032
- Table 109: Global Simulation Software Industry Revenue Million Forecast, by Country 2019 & 2032
- Table 110: Global Simulation Software Industry Volume K Unit Forecast, by Country 2019 & 2032
- Table 111: Global Simulation Software Industry Revenue Million Forecast, by Deployment Type 2019 & 2032
- Table 112: Global Simulation Software Industry Volume K Unit Forecast, by Deployment Type 2019 & 2032
- Table 113: Global Simulation Software Industry Revenue Million Forecast, by End-user Industry 2019 & 2032
- Table 114: Global Simulation Software Industry Volume K Unit Forecast, by End-user Industry 2019 & 2032
- Table 115: Global Simulation Software Industry Revenue Million Forecast, by Country 2019 & 2032
- Table 116: Global Simulation Software Industry Volume K Unit Forecast, by Country 2019 & 2032
- Table 117: Global Simulation Software Industry Revenue Million Forecast, by Deployment Type 2019 & 2032
- Table 118: Global Simulation Software Industry Volume K Unit Forecast, by Deployment Type 2019 & 2032
- Table 119: Global Simulation Software Industry Revenue Million Forecast, by End-user Industry 2019 & 2032
- Table 120: Global Simulation Software Industry Volume K Unit Forecast, by End-user Industry 2019 & 2032
- Table 121: Global Simulation Software Industry Revenue Million Forecast, by Country 2019 & 2032
- Table 122: Global Simulation Software Industry Volume K Unit Forecast, by Country 2019 & 2032
- Table 123: Global Simulation Software Industry Revenue Million Forecast, by Deployment Type 2019 & 2032
- Table 124: Global Simulation Software Industry Volume K Unit Forecast, by Deployment Type 2019 & 2032
- Table 125: Global Simulation Software Industry Revenue Million Forecast, by End-user Industry 2019 & 2032
- Table 126: Global Simulation Software Industry Volume K Unit Forecast, by End-user Industry 2019 & 2032
- Table 127: Global Simulation Software Industry Revenue Million Forecast, by Country 2019 & 2032
- Table 128: Global Simulation Software Industry Volume K Unit Forecast, by Country 2019 & 2032
- Table 129: Global Simulation Software Industry Revenue Million Forecast, by Deployment Type 2019 & 2032
- Table 130: Global Simulation Software Industry Volume K Unit Forecast, by Deployment Type 2019 & 2032
- Table 131: Global Simulation Software Industry Revenue Million Forecast, by End-user Industry 2019 & 2032
- Table 132: Global Simulation Software Industry Volume K Unit Forecast, by End-user Industry 2019 & 2032
- Table 133: Global Simulation Software Industry Revenue Million Forecast, by Country 2019 & 2032
- Table 134: Global Simulation Software Industry Volume K Unit Forecast, by Country 2019 & 2032
Frequently Asked Questions
1. What is the projected Compound Annual Growth Rate (CAGR) of the Simulation Software Industry?
The projected CAGR is approximately 12.06%.
2. Which companies are prominent players in the Simulation Software Industry?
Key companies in the market include CPFD Software LLC, Bentley Systems Incorporated, Ansys Inc, Dassault Systèmes SE, Design Simulation Technologies Inc, Schneider Electric SE, SolidWorks Corporation, SIMUL8 Corporation, Cybernet Systems Corp, Simio LLC, Siemens AG, Altair Engineering Inc, CONSELF Srl, PTC Inc, The MathWorks Inc, Autodesk Inc, Synopsys Inc, Rockwell Automation Inc, The COMSOL Group, Lanner Group Ltd.
3. What are the main segments of the Simulation Software Industry?
The market segments include Deployment Type, End-user Industry.
4. Can you provide details about the market size?
The market size is estimated to be USD 12.12 Million as of 2022.
5. What are some drivers contributing to market growth?
Growing Automotive Sector.
6. What are the notable trends driving market growth?
Automotive Segment is expected grow at a faster pace..
7. Are there any restraints impacting market growth?
Fluctuating Market Demands and Customization Issues.
8. Can you provide examples of recent developments in the market?
In March 2023, Simulations Plus, Inc., a provider of modeling and simulation software and services for pharmaceutical protection and effectiveness, announced that it joined into a cooperative research contract with the Institute of Medical Biology of the Polish Academy of Sciences to develop new compounds for the RORγ/RORγT nuclear receptors using its advanced artificial intelligence machine learning technology in the ADMET Predictor software platform.
9. What pricing options are available for accessing the report?
Pricing options include single-user, multi-user, and enterprise licenses priced at USD 4750, USD 5250, and USD 8750 respectively.
10. Is the market size provided in terms of value or volume?
The market size is provided in terms of value, measured in Million and volume, measured in K Unit.
11. Are there any specific market keywords associated with the report?
Yes, the market keyword associated with the report is "Simulation Software Industry," which aids in identifying and referencing the specific market segment covered.
12. How do I determine which pricing option suits my needs best?
The pricing options vary based on user requirements and access needs. Individual users may opt for single-user licenses, while businesses requiring broader access may choose multi-user or enterprise licenses for cost-effective access to the report.
13. Are there any additional resources or data provided in the Simulation Software Industry report?
While the report offers comprehensive insights, it's advisable to review the specific contents or supplementary materials provided to ascertain if additional resources or data are available.
14. How can I stay updated on further developments or reports in the Simulation Software Industry?
To stay informed about further developments, trends, and reports in the Simulation Software Industry, consider subscribing to industry newsletters, following relevant companies and organizations, or regularly checking reputable industry news sources and publications.
Methodology
Step 1 - Identification of Relevant Samples Size from Population Database


Step 2 - Approaches for Defining Global Market Size (Value, Volume* & Price*)

Note*: In applicable scenarios
Step 3 - Data Sources
Primary Research
- Web Analytics
- Survey Reports
- Research Institute
- Latest Research Reports
- Opinion Leaders
Secondary Research
- Annual Reports
- White Paper
- Latest Press Release
- Industry Association
- Paid Database
- Investor Presentations

Step 4 - Data Triangulation
Involves using different sources of information in order to increase the validity of a study
These sources are likely to be stakeholders in a program - participants, other researchers, program staff, other community members, and so on.
Then we put all data in single framework & apply various statistical tools to find out the dynamic on the market.
During the analysis stage, feedback from the stakeholder groups would be compared to determine areas of agreement as well as areas of divergence


