
Key Insights
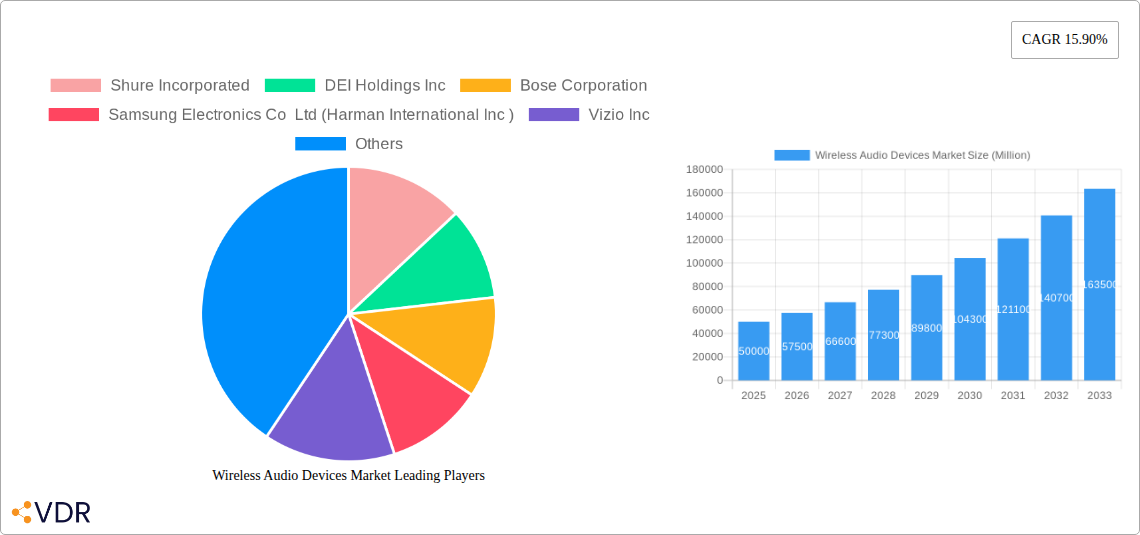
The global wireless audio devices market is experiencing robust growth, projected to reach a substantial size with a compound annual growth rate (CAGR) of 15.90% from 2025 to 2033. This expansion is driven by several key factors. The increasing affordability and widespread adoption of smartphones and other smart devices are fueling demand for wireless audio solutions. Consumers are increasingly prioritizing convenience and portability, leading to a shift away from wired audio products. Furthermore, advancements in Bluetooth technology, offering superior audio quality and longer battery life, are significantly contributing to market growth. The rise of streaming services and podcasts is further boosting demand for high-quality wireless headphones, earbuds, and speakers. The integration of wireless audio technology into automobiles is also a major growth driver, along with the increasing popularity of smart home devices that seamlessly integrate with wireless audio systems. Segmentation reveals strong performance across various product categories, including soundbars, wireless speakers, and wireless headsets and microphones, driven by diverse consumer and commercial applications. While the market enjoys considerable momentum, challenges remain, including potential saturation in mature markets and intense competition among established players and emerging brands.
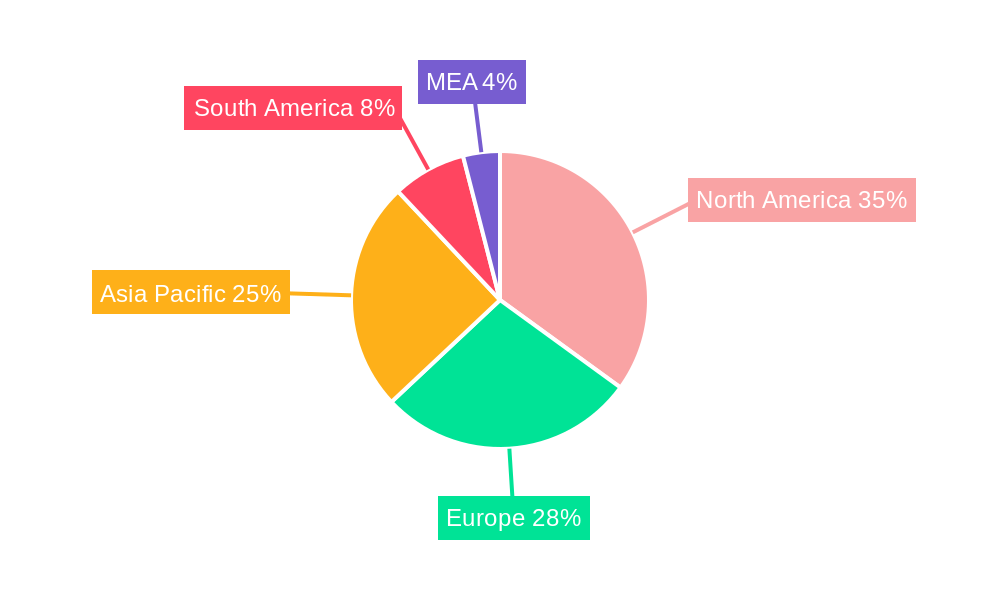
The regional landscape showcases significant variations in market penetration. North America and Europe currently hold a considerable market share, driven by high consumer spending and early adoption of new technologies. However, the Asia-Pacific region is expected to witness the most significant growth in the coming years, fueled by increasing disposable incomes, expanding middle classes, and rising smartphone penetration, particularly in rapidly developing economies like India and China. The market is characterized by a competitive landscape with several established players like Bose, Sony, and Apple vying for market dominance alongside emerging brands offering innovative solutions and competitive pricing. Technological advancements, including the development of noise-cancellation technology and high-resolution audio codecs, are continually shaping the market dynamics and driving innovation. Future growth will depend on addressing challenges such as maintaining consistent audio quality across different devices and environments, improving battery life, and ensuring interoperability across various operating systems and platforms.
Wireless Audio Devices Market: A Comprehensive Market Report (2019-2033)
This comprehensive report provides an in-depth analysis of the Wireless Audio Devices Market, encompassing its current state, future trajectory, and key players. The study period spans from 2019 to 2033, with 2025 serving as the base and estimated year. The report segments the market by technology (Bluetooth, AirPlay, Wi-Fi, Other Technologies), product (Sound Bars, Wireless Speakers, Wireless Headsets and Microphones, Other Products), and application (Consumer, Commercial, Automotive, Other Applications). Key players analyzed include Shure Incorporated, DEI Holdings Inc, Bose Corporation, Samsung Electronics Co Ltd (Harman International Inc), Vizio Inc, Sennheiser Electronic GMBH & Co KG, Koninklijke Philips NV, Apple Inc, and Sony Corporation. The market is expected to reach xx Million units by 2033.
Wireless Audio Devices Market Dynamics & Structure
The wireless audio devices market is characterized by moderate concentration, with several major players vying for market share. Technological innovation, particularly in areas like noise cancellation, spatial audio, and low-power consumption, are key drivers. Regulatory frameworks concerning radio frequencies and safety standards influence market operations. The market witnesses continuous competition from wired audio devices, and the adoption of wireless technology is determined by factors like affordability, convenience, and performance. Mergers and acquisitions (M&A) activity remains moderate.
- Market Concentration: Moderately concentrated, with top 5 players holding approximately xx% market share in 2024.
- Technological Innovation: Advancements in Bluetooth codecs, improved battery life, and sophisticated audio processing technologies are major drivers.
- Regulatory Frameworks: Compliance with radio frequency standards and safety regulations impacts product design and market entry.
- Competitive Product Substitutes: Wired audio devices present a continuing, albeit declining, competitive challenge.
- End-User Demographics: Primarily driven by young adults and professionals, with increasing adoption across all age groups.
- M&A Trends: Moderate M&A activity, primarily focused on strengthening technological capabilities and expanding product portfolios. XX major M&A deals occurred between 2019 and 2024.
Wireless Audio Devices Market Growth Trends & Insights
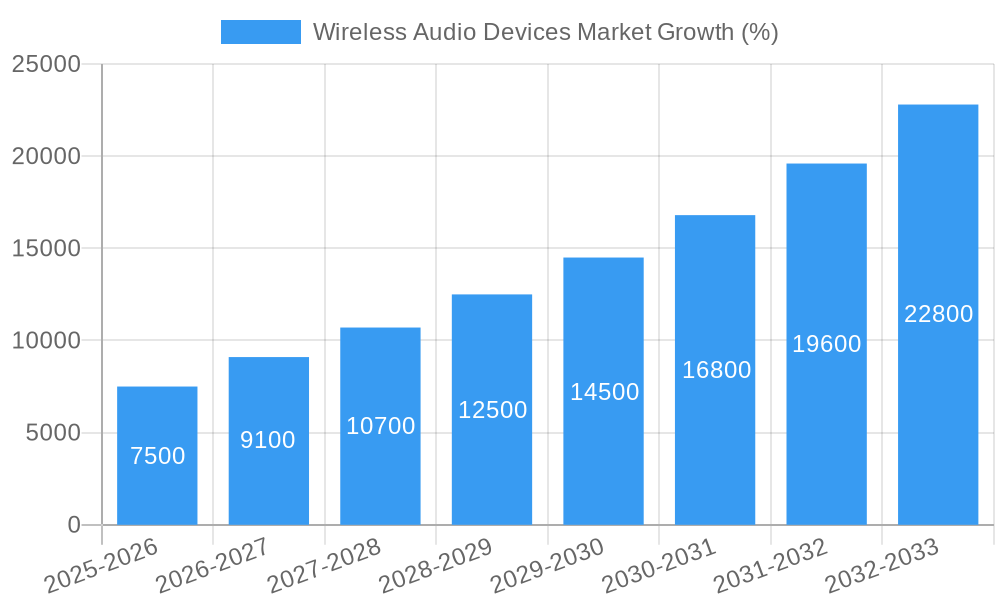
The wireless audio devices market has witnessed substantial growth over the historical period (2019-2024), driven by increasing smartphone penetration, rising disposable incomes, and a growing preference for convenient and portable audio solutions. This growth is expected to continue at a CAGR of xx% during the forecast period (2025-2033), reaching xx Million units by 2033. The adoption rate of wireless audio devices is accelerating, particularly in emerging economies. Technological disruptions, such as the introduction of advanced codecs and improved battery technology, are further fueling market expansion. Changing consumer behavior, with an increasing emphasis on personalized audio experiences and seamless device integration, is also a key driver. Market penetration is currently at xx% and is projected to reach xx% by 2033.
Dominant Regions, Countries, or Segments in Wireless Audio Devices Market
The North American and European markets currently dominate the wireless audio devices market, driven by high consumer spending, strong technological advancements, and well-established distribution networks. However, the Asia-Pacific region is anticipated to experience the fastest growth during the forecast period, fueled by rapid economic growth, increasing smartphone adoption, and a burgeoning middle class.
Leading Segments:
- Technology: Bluetooth holds the largest market share, followed by Wi-Fi.
- Product: Wireless headsets and microphones segment is experiencing the highest growth rate.
- Application: The consumer segment dominates, followed by the commercial segment.
Key Drivers by Region:
- North America: High consumer spending, strong technological infrastructure, and established distribution networks.
- Europe: Similar to North America, with strong focus on premium audio products.
- Asia-Pacific: Rapid economic growth, rising disposable incomes, and increasing smartphone penetration.
Wireless Audio Devices Market Product Landscape
The wireless audio devices market is characterized by a wide range of products, each offering unique selling propositions. Soundbars provide immersive home theater experiences, while wireless speakers offer portability and convenience. Wireless headsets and microphones cater to diverse applications, from personal listening to professional recording. Continuous technological advancements focus on improved sound quality, noise cancellation, extended battery life, and seamless device integration. The emergence of spatial audio technologies is further enhancing the user experience.
Key Drivers, Barriers & Challenges in Wireless Audio Devices Market
Key Drivers:
- Increasing smartphone penetration and consumer demand for convenient audio solutions.
- Advancements in Bluetooth technology and audio processing capabilities.
- Rising disposable incomes, particularly in emerging markets.
Challenges:
- Intense competition among established brands and new entrants.
- Concerns about battery life and charging infrastructure.
- Supply chain disruptions and component shortages. These caused a xx% reduction in production in Q2 2023.
Emerging Opportunities in Wireless Audio Devices Market
- Expansion into untapped markets in developing economies.
- Development of new applications, such as integration with smart home systems and virtual reality headsets.
- Growing demand for personalized audio experiences and customized sound profiles.
Growth Accelerators in the Wireless Audio Devices Market Industry
Technological breakthroughs, such as the development of more efficient Bluetooth codecs and improved noise-cancellation technologies, are key catalysts for long-term growth. Strategic partnerships between audio device manufacturers and chipmakers are also enhancing product innovation and performance. Aggressive expansion strategies in emerging markets are broadening the overall market reach.
Key Players Shaping the Wireless Audio Devices Market Market
- Shure Incorporated
- DEI Holdings Inc
- Bose Corporation
- Samsung Electronics Co Ltd (Harman International Inc)
- Vizio Inc
- Sennheiser Electronic GMBH & Co KG
- Koninklijke Philips NV
- Apple Inc
- Sony Corporation
Notable Milestones in Wireless Audio Devices Market Sector
- September 2022: Apple launched AirPods Pro with the H2 chip, boasting improved noise cancellation, transparency mode, and spatial audio.
- September 2022: Qualcomm expanded its collaboration with Bose, integrating its wireless voice and music platforms into Bose products.
In-Depth Wireless Audio Devices Market Market Outlook
The wireless audio devices market is poised for continued strong growth, driven by ongoing technological advancements, increasing consumer demand, and expansion into new markets. Strategic partnerships and investments in research and development will play a crucial role in shaping the future of this dynamic sector. The market's future success hinges on innovation, addressing consumer preferences for seamless integration and high-quality audio, and navigating supply chain challenges effectively.
Wireless Audio Devices Market Segmentation
-
1. Technology
- 1.1. Bluetooth
- 1.2. Airplay
- 1.3. Wi-Fi
- 1.4. Other Technologies
-
2. Product
- 2.1. Sound Bars
- 2.2. Wireless Speakers
- 2.3. Wirerless Headsets and Microphones
- 2.4. Other Products
-
3. Application
- 3.1. Consumer
- 3.2. Commercial
- 3.3. Automotive
- 3.4. Other Applications
Wireless Audio Devices Market Segmentation By Geography
-
1. North America
- 1.1. United States
- 1.2. Canada
-
2. Europe
- 2.1. United Kingdom
- 2.2. Germany
- 2.3. France
- 2.4. Rest of Europe
-
3. Asia Pacific
- 3.1. China
- 3.2. Japan
- 3.3. India
- 3.4. Rest of Asia Pacific
- 4. Latin America
- 5. Middle East and Africa
Wireless Audio Devices Market REPORT HIGHLIGHTS
| Aspects | Details |
|---|---|
| Study Period | 2019-2033 |
| Base Year | 2024 |
| Estimated Year | 2025 |
| Forecast Period | 2025-2033 |
| Historical Period | 2019-2024 |
| Growth Rate | CAGR of 15.90% from 2019-2033 |
| Segmentation |
|
Table of Contents
- 1. Introduction
- 1.1. Research Scope
- 1.2. Market Segmentation
- 1.3. Research Methodology
- 1.4. Definitions and Assumptions
- 2. Executive Summary
- 2.1. Introduction
- 3. Market Dynamics
- 3.1. Introduction
- 3.2. Market Drivers
- 3.2.1. Increasing Mobility Requirements; Rising Disposable Income of Consumers
- 3.3. Market Restrains
- 3.3.1. Issues Related with Operating Frequency Compliance
- 3.4. Market Trends
- 3.4.1. Bluetooth Technology to lead the Wireless Audio Device Market
- 4. Market Factor Analysis
- 4.1. Porters Five Forces
- 4.2. Supply/Value Chain
- 4.3. PESTEL analysis
- 4.4. Market Entropy
- 4.5. Patent/Trademark Analysis
- 5. Global Wireless Audio Devices Market Analysis, Insights and Forecast, 2019-2031
- 5.1. Market Analysis, Insights and Forecast - by Technology
- 5.1.1. Bluetooth
- 5.1.2. Airplay
- 5.1.3. Wi-Fi
- 5.1.4. Other Technologies
- 5.2. Market Analysis, Insights and Forecast - by Product
- 5.2.1. Sound Bars
- 5.2.2. Wireless Speakers
- 5.2.3. Wirerless Headsets and Microphones
- 5.2.4. Other Products
- 5.3. Market Analysis, Insights and Forecast - by Application
- 5.3.1. Consumer
- 5.3.2. Commercial
- 5.3.3. Automotive
- 5.3.4. Other Applications
- 5.4. Market Analysis, Insights and Forecast - by Region
- 5.4.1. North America
- 5.4.2. Europe
- 5.4.3. Asia Pacific
- 5.4.4. Latin America
- 5.4.5. Middle East and Africa
- 5.1. Market Analysis, Insights and Forecast - by Technology
- 6. North America Wireless Audio Devices Market Analysis, Insights and Forecast, 2019-2031
- 6.1. Market Analysis, Insights and Forecast - by Technology
- 6.1.1. Bluetooth
- 6.1.2. Airplay
- 6.1.3. Wi-Fi
- 6.1.4. Other Technologies
- 6.2. Market Analysis, Insights and Forecast - by Product
- 6.2.1. Sound Bars
- 6.2.2. Wireless Speakers
- 6.2.3. Wirerless Headsets and Microphones
- 6.2.4. Other Products
- 6.3. Market Analysis, Insights and Forecast - by Application
- 6.3.1. Consumer
- 6.3.2. Commercial
- 6.3.3. Automotive
- 6.3.4. Other Applications
- 6.1. Market Analysis, Insights and Forecast - by Technology
- 7. Europe Wireless Audio Devices Market Analysis, Insights and Forecast, 2019-2031
- 7.1. Market Analysis, Insights and Forecast - by Technology
- 7.1.1. Bluetooth
- 7.1.2. Airplay
- 7.1.3. Wi-Fi
- 7.1.4. Other Technologies
- 7.2. Market Analysis, Insights and Forecast - by Product
- 7.2.1. Sound Bars
- 7.2.2. Wireless Speakers
- 7.2.3. Wirerless Headsets and Microphones
- 7.2.4. Other Products
- 7.3. Market Analysis, Insights and Forecast - by Application
- 7.3.1. Consumer
- 7.3.2. Commercial
- 7.3.3. Automotive
- 7.3.4. Other Applications
- 7.1. Market Analysis, Insights and Forecast - by Technology
- 8. Asia Pacific Wireless Audio Devices Market Analysis, Insights and Forecast, 2019-2031
- 8.1. Market Analysis, Insights and Forecast - by Technology
- 8.1.1. Bluetooth
- 8.1.2. Airplay
- 8.1.3. Wi-Fi
- 8.1.4. Other Technologies
- 8.2. Market Analysis, Insights and Forecast - by Product
- 8.2.1. Sound Bars
- 8.2.2. Wireless Speakers
- 8.2.3. Wirerless Headsets and Microphones
- 8.2.4. Other Products
- 8.3. Market Analysis, Insights and Forecast - by Application
- 8.3.1. Consumer
- 8.3.2. Commercial
- 8.3.3. Automotive
- 8.3.4. Other Applications
- 8.1. Market Analysis, Insights and Forecast - by Technology
- 9. Latin America Wireless Audio Devices Market Analysis, Insights and Forecast, 2019-2031
- 9.1. Market Analysis, Insights and Forecast - by Technology
- 9.1.1. Bluetooth
- 9.1.2. Airplay
- 9.1.3. Wi-Fi
- 9.1.4. Other Technologies
- 9.2. Market Analysis, Insights and Forecast - by Product
- 9.2.1. Sound Bars
- 9.2.2. Wireless Speakers
- 9.2.3. Wirerless Headsets and Microphones
- 9.2.4. Other Products
- 9.3. Market Analysis, Insights and Forecast - by Application
- 9.3.1. Consumer
- 9.3.2. Commercial
- 9.3.3. Automotive
- 9.3.4. Other Applications
- 9.1. Market Analysis, Insights and Forecast - by Technology
- 10. Middle East and Africa Wireless Audio Devices Market Analysis, Insights and Forecast, 2019-2031
- 10.1. Market Analysis, Insights and Forecast - by Technology
- 10.1.1. Bluetooth
- 10.1.2. Airplay
- 10.1.3. Wi-Fi
- 10.1.4. Other Technologies
- 10.2. Market Analysis, Insights and Forecast - by Product
- 10.2.1. Sound Bars
- 10.2.2. Wireless Speakers
- 10.2.3. Wirerless Headsets and Microphones
- 10.2.4. Other Products
- 10.3. Market Analysis, Insights and Forecast - by Application
- 10.3.1. Consumer
- 10.3.2. Commercial
- 10.3.3. Automotive
- 10.3.4. Other Applications
- 10.1. Market Analysis, Insights and Forecast - by Technology
- 11. North America Wireless Audio Devices Market Analysis, Insights and Forecast, 2019-2031
- 11.1. Market Analysis, Insights and Forecast - By Country/Sub-region
- 11.1.1 United States
- 11.1.2 Canada
- 11.1.3 Mexico
- 12. Europe Wireless Audio Devices Market Analysis, Insights and Forecast, 2019-2031
- 12.1. Market Analysis, Insights and Forecast - By Country/Sub-region
- 12.1.1 Germany
- 12.1.2 United Kingdom
- 12.1.3 France
- 12.1.4 Spain
- 12.1.5 Italy
- 12.1.6 Spain
- 12.1.7 Belgium
- 12.1.8 Netherland
- 12.1.9 Nordics
- 12.1.10 Rest of Europe
- 13. Asia Pacific Wireless Audio Devices Market Analysis, Insights and Forecast, 2019-2031
- 13.1. Market Analysis, Insights and Forecast - By Country/Sub-region
- 13.1.1 China
- 13.1.2 Japan
- 13.1.3 India
- 13.1.4 South Korea
- 13.1.5 Southeast Asia
- 13.1.6 Australia
- 13.1.7 Indonesia
- 13.1.8 Phillipes
- 13.1.9 Singapore
- 13.1.10 Thailandc
- 13.1.11 Rest of Asia Pacific
- 14. South America Wireless Audio Devices Market Analysis, Insights and Forecast, 2019-2031
- 14.1. Market Analysis, Insights and Forecast - By Country/Sub-region
- 14.1.1 Brazil
- 14.1.2 Argentina
- 14.1.3 Peru
- 14.1.4 Chile
- 14.1.5 Colombia
- 14.1.6 Ecuador
- 14.1.7 Venezuela
- 14.1.8 Rest of South America
- 15. MEA Wireless Audio Devices Market Analysis, Insights and Forecast, 2019-2031
- 15.1. Market Analysis, Insights and Forecast - By Country/Sub-region
- 15.1.1 United Arab Emirates
- 15.1.2 Saudi Arabia
- 15.1.3 South Africa
- 15.1.4 Rest of Middle East and Africa
- 16. Competitive Analysis
- 16.1. Global Market Share Analysis 2024
- 16.2. Company Profiles
- 16.2.1 Shure Incorporated
- 16.2.1.1. Overview
- 16.2.1.2. Products
- 16.2.1.3. SWOT Analysis
- 16.2.1.4. Recent Developments
- 16.2.1.5. Financials (Based on Availability)
- 16.2.2 DEI Holdings Inc
- 16.2.2.1. Overview
- 16.2.2.2. Products
- 16.2.2.3. SWOT Analysis
- 16.2.2.4. Recent Developments
- 16.2.2.5. Financials (Based on Availability)
- 16.2.3 Bose Corporation
- 16.2.3.1. Overview
- 16.2.3.2. Products
- 16.2.3.3. SWOT Analysis
- 16.2.3.4. Recent Developments
- 16.2.3.5. Financials (Based on Availability)
- 16.2.4 Samsung Electronics Co Ltd (Harman International Inc )
- 16.2.4.1. Overview
- 16.2.4.2. Products
- 16.2.4.3. SWOT Analysis
- 16.2.4.4. Recent Developments
- 16.2.4.5. Financials (Based on Availability)
- 16.2.5 Vizio Inc
- 16.2.5.1. Overview
- 16.2.5.2. Products
- 16.2.5.3. SWOT Analysis
- 16.2.5.4. Recent Developments
- 16.2.5.5. Financials (Based on Availability)
- 16.2.6 Sennheiser Electronic GMBH & Co KG
- 16.2.6.1. Overview
- 16.2.6.2. Products
- 16.2.6.3. SWOT Analysis
- 16.2.6.4. Recent Developments
- 16.2.6.5. Financials (Based on Availability)
- 16.2.7 Koninklijke Philips NV
- 16.2.7.1. Overview
- 16.2.7.2. Products
- 16.2.7.3. SWOT Analysis
- 16.2.7.4. Recent Developments
- 16.2.7.5. Financials (Based on Availability)
- 16.2.8 Apple Inc
- 16.2.8.1. Overview
- 16.2.8.2. Products
- 16.2.8.3. SWOT Analysis
- 16.2.8.4. Recent Developments
- 16.2.8.5. Financials (Based on Availability)
- 16.2.9 Sony Corporation
- 16.2.9.1. Overview
- 16.2.9.2. Products
- 16.2.9.3. SWOT Analysis
- 16.2.9.4. Recent Developments
- 16.2.9.5. Financials (Based on Availability)
- 16.2.1 Shure Incorporated
List of Figures
- Figure 1: Global Wireless Audio Devices Market Revenue Breakdown (Million, %) by Region 2024 & 2032
- Figure 2: Global Wireless Audio Devices Market Volume Breakdown (K Unit, %) by Region 2024 & 2032
- Figure 3: North America Wireless Audio Devices Market Revenue (Million), by Country 2024 & 2032
- Figure 4: North America Wireless Audio Devices Market Volume (K Unit), by Country 2024 & 2032
- Figure 5: North America Wireless Audio Devices Market Revenue Share (%), by Country 2024 & 2032
- Figure 6: North America Wireless Audio Devices Market Volume Share (%), by Country 2024 & 2032
- Figure 7: Europe Wireless Audio Devices Market Revenue (Million), by Country 2024 & 2032
- Figure 8: Europe Wireless Audio Devices Market Volume (K Unit), by Country 2024 & 2032
- Figure 9: Europe Wireless Audio Devices Market Revenue Share (%), by Country 2024 & 2032
- Figure 10: Europe Wireless Audio Devices Market Volume Share (%), by Country 2024 & 2032
- Figure 11: Asia Pacific Wireless Audio Devices Market Revenue (Million), by Country 2024 & 2032
- Figure 12: Asia Pacific Wireless Audio Devices Market Volume (K Unit), by Country 2024 & 2032
- Figure 13: Asia Pacific Wireless Audio Devices Market Revenue Share (%), by Country 2024 & 2032
- Figure 14: Asia Pacific Wireless Audio Devices Market Volume Share (%), by Country 2024 & 2032
- Figure 15: South America Wireless Audio Devices Market Revenue (Million), by Country 2024 & 2032
- Figure 16: South America Wireless Audio Devices Market Volume (K Unit), by Country 2024 & 2032
- Figure 17: South America Wireless Audio Devices Market Revenue Share (%), by Country 2024 & 2032
- Figure 18: South America Wireless Audio Devices Market Volume Share (%), by Country 2024 & 2032
- Figure 19: MEA Wireless Audio Devices Market Revenue (Million), by Country 2024 & 2032
- Figure 20: MEA Wireless Audio Devices Market Volume (K Unit), by Country 2024 & 2032
- Figure 21: MEA Wireless Audio Devices Market Revenue Share (%), by Country 2024 & 2032
- Figure 22: MEA Wireless Audio Devices Market Volume Share (%), by Country 2024 & 2032
- Figure 23: North America Wireless Audio Devices Market Revenue (Million), by Technology 2024 & 2032
- Figure 24: North America Wireless Audio Devices Market Volume (K Unit), by Technology 2024 & 2032
- Figure 25: North America Wireless Audio Devices Market Revenue Share (%), by Technology 2024 & 2032
- Figure 26: North America Wireless Audio Devices Market Volume Share (%), by Technology 2024 & 2032
- Figure 27: North America Wireless Audio Devices Market Revenue (Million), by Product 2024 & 2032
- Figure 28: North America Wireless Audio Devices Market Volume (K Unit), by Product 2024 & 2032
- Figure 29: North America Wireless Audio Devices Market Revenue Share (%), by Product 2024 & 2032
- Figure 30: North America Wireless Audio Devices Market Volume Share (%), by Product 2024 & 2032
- Figure 31: North America Wireless Audio Devices Market Revenue (Million), by Application 2024 & 2032
- Figure 32: North America Wireless Audio Devices Market Volume (K Unit), by Application 2024 & 2032
- Figure 33: North America Wireless Audio Devices Market Revenue Share (%), by Application 2024 & 2032
- Figure 34: North America Wireless Audio Devices Market Volume Share (%), by Application 2024 & 2032
- Figure 35: North America Wireless Audio Devices Market Revenue (Million), by Country 2024 & 2032
- Figure 36: North America Wireless Audio Devices Market Volume (K Unit), by Country 2024 & 2032
- Figure 37: North America Wireless Audio Devices Market Revenue Share (%), by Country 2024 & 2032
- Figure 38: North America Wireless Audio Devices Market Volume Share (%), by Country 2024 & 2032
- Figure 39: Europe Wireless Audio Devices Market Revenue (Million), by Technology 2024 & 2032
- Figure 40: Europe Wireless Audio Devices Market Volume (K Unit), by Technology 2024 & 2032
- Figure 41: Europe Wireless Audio Devices Market Revenue Share (%), by Technology 2024 & 2032
- Figure 42: Europe Wireless Audio Devices Market Volume Share (%), by Technology 2024 & 2032
- Figure 43: Europe Wireless Audio Devices Market Revenue (Million), by Product 2024 & 2032
- Figure 44: Europe Wireless Audio Devices Market Volume (K Unit), by Product 2024 & 2032
- Figure 45: Europe Wireless Audio Devices Market Revenue Share (%), by Product 2024 & 2032
- Figure 46: Europe Wireless Audio Devices Market Volume Share (%), by Product 2024 & 2032
- Figure 47: Europe Wireless Audio Devices Market Revenue (Million), by Application 2024 & 2032
- Figure 48: Europe Wireless Audio Devices Market Volume (K Unit), by Application 2024 & 2032
- Figure 49: Europe Wireless Audio Devices Market Revenue Share (%), by Application 2024 & 2032
- Figure 50: Europe Wireless Audio Devices Market Volume Share (%), by Application 2024 & 2032
- Figure 51: Europe Wireless Audio Devices Market Revenue (Million), by Country 2024 & 2032
- Figure 52: Europe Wireless Audio Devices Market Volume (K Unit), by Country 2024 & 2032
- Figure 53: Europe Wireless Audio Devices Market Revenue Share (%), by Country 2024 & 2032
- Figure 54: Europe Wireless Audio Devices Market Volume Share (%), by Country 2024 & 2032
- Figure 55: Asia Pacific Wireless Audio Devices Market Revenue (Million), by Technology 2024 & 2032
- Figure 56: Asia Pacific Wireless Audio Devices Market Volume (K Unit), by Technology 2024 & 2032
- Figure 57: Asia Pacific Wireless Audio Devices Market Revenue Share (%), by Technology 2024 & 2032
- Figure 58: Asia Pacific Wireless Audio Devices Market Volume Share (%), by Technology 2024 & 2032
- Figure 59: Asia Pacific Wireless Audio Devices Market Revenue (Million), by Product 2024 & 2032
- Figure 60: Asia Pacific Wireless Audio Devices Market Volume (K Unit), by Product 2024 & 2032
- Figure 61: Asia Pacific Wireless Audio Devices Market Revenue Share (%), by Product 2024 & 2032
- Figure 62: Asia Pacific Wireless Audio Devices Market Volume Share (%), by Product 2024 & 2032
- Figure 63: Asia Pacific Wireless Audio Devices Market Revenue (Million), by Application 2024 & 2032
- Figure 64: Asia Pacific Wireless Audio Devices Market Volume (K Unit), by Application 2024 & 2032
- Figure 65: Asia Pacific Wireless Audio Devices Market Revenue Share (%), by Application 2024 & 2032
- Figure 66: Asia Pacific Wireless Audio Devices Market Volume Share (%), by Application 2024 & 2032
- Figure 67: Asia Pacific Wireless Audio Devices Market Revenue (Million), by Country 2024 & 2032
- Figure 68: Asia Pacific Wireless Audio Devices Market Volume (K Unit), by Country 2024 & 2032
- Figure 69: Asia Pacific Wireless Audio Devices Market Revenue Share (%), by Country 2024 & 2032
- Figure 70: Asia Pacific Wireless Audio Devices Market Volume Share (%), by Country 2024 & 2032
- Figure 71: Latin America Wireless Audio Devices Market Revenue (Million), by Technology 2024 & 2032
- Figure 72: Latin America Wireless Audio Devices Market Volume (K Unit), by Technology 2024 & 2032
- Figure 73: Latin America Wireless Audio Devices Market Revenue Share (%), by Technology 2024 & 2032
- Figure 74: Latin America Wireless Audio Devices Market Volume Share (%), by Technology 2024 & 2032
- Figure 75: Latin America Wireless Audio Devices Market Revenue (Million), by Product 2024 & 2032
- Figure 76: Latin America Wireless Audio Devices Market Volume (K Unit), by Product 2024 & 2032
- Figure 77: Latin America Wireless Audio Devices Market Revenue Share (%), by Product 2024 & 2032
- Figure 78: Latin America Wireless Audio Devices Market Volume Share (%), by Product 2024 & 2032
- Figure 79: Latin America Wireless Audio Devices Market Revenue (Million), by Application 2024 & 2032
- Figure 80: Latin America Wireless Audio Devices Market Volume (K Unit), by Application 2024 & 2032
- Figure 81: Latin America Wireless Audio Devices Market Revenue Share (%), by Application 2024 & 2032
- Figure 82: Latin America Wireless Audio Devices Market Volume Share (%), by Application 2024 & 2032
- Figure 83: Latin America Wireless Audio Devices Market Revenue (Million), by Country 2024 & 2032
- Figure 84: Latin America Wireless Audio Devices Market Volume (K Unit), by Country 2024 & 2032
- Figure 85: Latin America Wireless Audio Devices Market Revenue Share (%), by Country 2024 & 2032
- Figure 86: Latin America Wireless Audio Devices Market Volume Share (%), by Country 2024 & 2032
- Figure 87: Middle East and Africa Wireless Audio Devices Market Revenue (Million), by Technology 2024 & 2032
- Figure 88: Middle East and Africa Wireless Audio Devices Market Volume (K Unit), by Technology 2024 & 2032
- Figure 89: Middle East and Africa Wireless Audio Devices Market Revenue Share (%), by Technology 2024 & 2032
- Figure 90: Middle East and Africa Wireless Audio Devices Market Volume Share (%), by Technology 2024 & 2032
- Figure 91: Middle East and Africa Wireless Audio Devices Market Revenue (Million), by Product 2024 & 2032
- Figure 92: Middle East and Africa Wireless Audio Devices Market Volume (K Unit), by Product 2024 & 2032
- Figure 93: Middle East and Africa Wireless Audio Devices Market Revenue Share (%), by Product 2024 & 2032
- Figure 94: Middle East and Africa Wireless Audio Devices Market Volume Share (%), by Product 2024 & 2032
- Figure 95: Middle East and Africa Wireless Audio Devices Market Revenue (Million), by Application 2024 & 2032
- Figure 96: Middle East and Africa Wireless Audio Devices Market Volume (K Unit), by Application 2024 & 2032
- Figure 97: Middle East and Africa Wireless Audio Devices Market Revenue Share (%), by Application 2024 & 2032
- Figure 98: Middle East and Africa Wireless Audio Devices Market Volume Share (%), by Application 2024 & 2032
- Figure 99: Middle East and Africa Wireless Audio Devices Market Revenue (Million), by Country 2024 & 2032
- Figure 100: Middle East and Africa Wireless Audio Devices Market Volume (K Unit), by Country 2024 & 2032
- Figure 101: Middle East and Africa Wireless Audio Devices Market Revenue Share (%), by Country 2024 & 2032
- Figure 102: Middle East and Africa Wireless Audio Devices Market Volume Share (%), by Country 2024 & 2032
List of Tables
- Table 1: Global Wireless Audio Devices Market Revenue Million Forecast, by Region 2019 & 2032
- Table 2: Global Wireless Audio Devices Market Volume K Unit Forecast, by Region 2019 & 2032
- Table 3: Global Wireless Audio Devices Market Revenue Million Forecast, by Technology 2019 & 2032
- Table 4: Global Wireless Audio Devices Market Volume K Unit Forecast, by Technology 2019 & 2032
- Table 5: Global Wireless Audio Devices Market Revenue Million Forecast, by Product 2019 & 2032
- Table 6: Global Wireless Audio Devices Market Volume K Unit Forecast, by Product 2019 & 2032
- Table 7: Global Wireless Audio Devices Market Revenue Million Forecast, by Application 2019 & 2032
- Table 8: Global Wireless Audio Devices Market Volume K Unit Forecast, by Application 2019 & 2032
- Table 9: Global Wireless Audio Devices Market Revenue Million Forecast, by Region 2019 & 2032
- Table 10: Global Wireless Audio Devices Market Volume K Unit Forecast, by Region 2019 & 2032
- Table 11: Global Wireless Audio Devices Market Revenue Million Forecast, by Country 2019 & 2032
- Table 12: Global Wireless Audio Devices Market Volume K Unit Forecast, by Country 2019 & 2032
- Table 13: United States Wireless Audio Devices Market Revenue (Million) Forecast, by Application 2019 & 2032
- Table 14: United States Wireless Audio Devices Market Volume (K Unit) Forecast, by Application 2019 & 2032
- Table 15: Canada Wireless Audio Devices Market Revenue (Million) Forecast, by Application 2019 & 2032
- Table 16: Canada Wireless Audio Devices Market Volume (K Unit) Forecast, by Application 2019 & 2032
- Table 17: Mexico Wireless Audio Devices Market Revenue (Million) Forecast, by Application 2019 & 2032
- Table 18: Mexico Wireless Audio Devices Market Volume (K Unit) Forecast, by Application 2019 & 2032
- Table 19: Global Wireless Audio Devices Market Revenue Million Forecast, by Country 2019 & 2032
- Table 20: Global Wireless Audio Devices Market Volume K Unit Forecast, by Country 2019 & 2032
- Table 21: Germany Wireless Audio Devices Market Revenue (Million) Forecast, by Application 2019 & 2032
- Table 22: Germany Wireless Audio Devices Market Volume (K Unit) Forecast, by Application 2019 & 2032
- Table 23: United Kingdom Wireless Audio Devices Market Revenue (Million) Forecast, by Application 2019 & 2032
- Table 24: United Kingdom Wireless Audio Devices Market Volume (K Unit) Forecast, by Application 2019 & 2032
- Table 25: France Wireless Audio Devices Market Revenue (Million) Forecast, by Application 2019 & 2032
- Table 26: France Wireless Audio Devices Market Volume (K Unit) Forecast, by Application 2019 & 2032
- Table 27: Spain Wireless Audio Devices Market Revenue (Million) Forecast, by Application 2019 & 2032
- Table 28: Spain Wireless Audio Devices Market Volume (K Unit) Forecast, by Application 2019 & 2032
- Table 29: Italy Wireless Audio Devices Market Revenue (Million) Forecast, by Application 2019 & 2032
- Table 30: Italy Wireless Audio Devices Market Volume (K Unit) Forecast, by Application 2019 & 2032
- Table 31: Spain Wireless Audio Devices Market Revenue (Million) Forecast, by Application 2019 & 2032
- Table 32: Spain Wireless Audio Devices Market Volume (K Unit) Forecast, by Application 2019 & 2032
- Table 33: Belgium Wireless Audio Devices Market Revenue (Million) Forecast, by Application 2019 & 2032
- Table 34: Belgium Wireless Audio Devices Market Volume (K Unit) Forecast, by Application 2019 & 2032
- Table 35: Netherland Wireless Audio Devices Market Revenue (Million) Forecast, by Application 2019 & 2032
- Table 36: Netherland Wireless Audio Devices Market Volume (K Unit) Forecast, by Application 2019 & 2032
- Table 37: Nordics Wireless Audio Devices Market Revenue (Million) Forecast, by Application 2019 & 2032
- Table 38: Nordics Wireless Audio Devices Market Volume (K Unit) Forecast, by Application 2019 & 2032
- Table 39: Rest of Europe Wireless Audio Devices Market Revenue (Million) Forecast, by Application 2019 & 2032
- Table 40: Rest of Europe Wireless Audio Devices Market Volume (K Unit) Forecast, by Application 2019 & 2032
- Table 41: Global Wireless Audio Devices Market Revenue Million Forecast, by Country 2019 & 2032
- Table 42: Global Wireless Audio Devices Market Volume K Unit Forecast, by Country 2019 & 2032
- Table 43: China Wireless Audio Devices Market Revenue (Million) Forecast, by Application 2019 & 2032
- Table 44: China Wireless Audio Devices Market Volume (K Unit) Forecast, by Application 2019 & 2032
- Table 45: Japan Wireless Audio Devices Market Revenue (Million) Forecast, by Application 2019 & 2032
- Table 46: Japan Wireless Audio Devices Market Volume (K Unit) Forecast, by Application 2019 & 2032
- Table 47: India Wireless Audio Devices Market Revenue (Million) Forecast, by Application 2019 & 2032
- Table 48: India Wireless Audio Devices Market Volume (K Unit) Forecast, by Application 2019 & 2032
- Table 49: South Korea Wireless Audio Devices Market Revenue (Million) Forecast, by Application 2019 & 2032
- Table 50: South Korea Wireless Audio Devices Market Volume (K Unit) Forecast, by Application 2019 & 2032
- Table 51: Southeast Asia Wireless Audio Devices Market Revenue (Million) Forecast, by Application 2019 & 2032
- Table 52: Southeast Asia Wireless Audio Devices Market Volume (K Unit) Forecast, by Application 2019 & 2032
- Table 53: Australia Wireless Audio Devices Market Revenue (Million) Forecast, by Application 2019 & 2032
- Table 54: Australia Wireless Audio Devices Market Volume (K Unit) Forecast, by Application 2019 & 2032
- Table 55: Indonesia Wireless Audio Devices Market Revenue (Million) Forecast, by Application 2019 & 2032
- Table 56: Indonesia Wireless Audio Devices Market Volume (K Unit) Forecast, by Application 2019 & 2032
- Table 57: Phillipes Wireless Audio Devices Market Revenue (Million) Forecast, by Application 2019 & 2032
- Table 58: Phillipes Wireless Audio Devices Market Volume (K Unit) Forecast, by Application 2019 & 2032
- Table 59: Singapore Wireless Audio Devices Market Revenue (Million) Forecast, by Application 2019 & 2032
- Table 60: Singapore Wireless Audio Devices Market Volume (K Unit) Forecast, by Application 2019 & 2032
- Table 61: Thailandc Wireless Audio Devices Market Revenue (Million) Forecast, by Application 2019 & 2032
- Table 62: Thailandc Wireless Audio Devices Market Volume (K Unit) Forecast, by Application 2019 & 2032
- Table 63: Rest of Asia Pacific Wireless Audio Devices Market Revenue (Million) Forecast, by Application 2019 & 2032
- Table 64: Rest of Asia Pacific Wireless Audio Devices Market Volume (K Unit) Forecast, by Application 2019 & 2032
- Table 65: Global Wireless Audio Devices Market Revenue Million Forecast, by Country 2019 & 2032
- Table 66: Global Wireless Audio Devices Market Volume K Unit Forecast, by Country 2019 & 2032
- Table 67: Brazil Wireless Audio Devices Market Revenue (Million) Forecast, by Application 2019 & 2032
- Table 68: Brazil Wireless Audio Devices Market Volume (K Unit) Forecast, by Application 2019 & 2032
- Table 69: Argentina Wireless Audio Devices Market Revenue (Million) Forecast, by Application 2019 & 2032
- Table 70: Argentina Wireless Audio Devices Market Volume (K Unit) Forecast, by Application 2019 & 2032
- Table 71: Peru Wireless Audio Devices Market Revenue (Million) Forecast, by Application 2019 & 2032
- Table 72: Peru Wireless Audio Devices Market Volume (K Unit) Forecast, by Application 2019 & 2032
- Table 73: Chile Wireless Audio Devices Market Revenue (Million) Forecast, by Application 2019 & 2032
- Table 74: Chile Wireless Audio Devices Market Volume (K Unit) Forecast, by Application 2019 & 2032
- Table 75: Colombia Wireless Audio Devices Market Revenue (Million) Forecast, by Application 2019 & 2032
- Table 76: Colombia Wireless Audio Devices Market Volume (K Unit) Forecast, by Application 2019 & 2032
- Table 77: Ecuador Wireless Audio Devices Market Revenue (Million) Forecast, by Application 2019 & 2032
- Table 78: Ecuador Wireless Audio Devices Market Volume (K Unit) Forecast, by Application 2019 & 2032
- Table 79: Venezuela Wireless Audio Devices Market Revenue (Million) Forecast, by Application 2019 & 2032
- Table 80: Venezuela Wireless Audio Devices Market Volume (K Unit) Forecast, by Application 2019 & 2032
- Table 81: Rest of South America Wireless Audio Devices Market Revenue (Million) Forecast, by Application 2019 & 2032
- Table 82: Rest of South America Wireless Audio Devices Market Volume (K Unit) Forecast, by Application 2019 & 2032
- Table 83: Global Wireless Audio Devices Market Revenue Million Forecast, by Country 2019 & 2032
- Table 84: Global Wireless Audio Devices Market Volume K Unit Forecast, by Country 2019 & 2032
- Table 85: United Arab Emirates Wireless Audio Devices Market Revenue (Million) Forecast, by Application 2019 & 2032
- Table 86: United Arab Emirates Wireless Audio Devices Market Volume (K Unit) Forecast, by Application 2019 & 2032
- Table 87: Saudi Arabia Wireless Audio Devices Market Revenue (Million) Forecast, by Application 2019 & 2032
- Table 88: Saudi Arabia Wireless Audio Devices Market Volume (K Unit) Forecast, by Application 2019 & 2032
- Table 89: South Africa Wireless Audio Devices Market Revenue (Million) Forecast, by Application 2019 & 2032
- Table 90: South Africa Wireless Audio Devices Market Volume (K Unit) Forecast, by Application 2019 & 2032
- Table 91: Rest of Middle East and Africa Wireless Audio Devices Market Revenue (Million) Forecast, by Application 2019 & 2032
- Table 92: Rest of Middle East and Africa Wireless Audio Devices Market Volume (K Unit) Forecast, by Application 2019 & 2032
- Table 93: Global Wireless Audio Devices Market Revenue Million Forecast, by Technology 2019 & 2032
- Table 94: Global Wireless Audio Devices Market Volume K Unit Forecast, by Technology 2019 & 2032
- Table 95: Global Wireless Audio Devices Market Revenue Million Forecast, by Product 2019 & 2032
- Table 96: Global Wireless Audio Devices Market Volume K Unit Forecast, by Product 2019 & 2032
- Table 97: Global Wireless Audio Devices Market Revenue Million Forecast, by Application 2019 & 2032
- Table 98: Global Wireless Audio Devices Market Volume K Unit Forecast, by Application 2019 & 2032
- Table 99: Global Wireless Audio Devices Market Revenue Million Forecast, by Country 2019 & 2032
- Table 100: Global Wireless Audio Devices Market Volume K Unit Forecast, by Country 2019 & 2032
- Table 101: United States Wireless Audio Devices Market Revenue (Million) Forecast, by Application 2019 & 2032
- Table 102: United States Wireless Audio Devices Market Volume (K Unit) Forecast, by Application 2019 & 2032
- Table 103: Canada Wireless Audio Devices Market Revenue (Million) Forecast, by Application 2019 & 2032
- Table 104: Canada Wireless Audio Devices Market Volume (K Unit) Forecast, by Application 2019 & 2032
- Table 105: Global Wireless Audio Devices Market Revenue Million Forecast, by Technology 2019 & 2032
- Table 106: Global Wireless Audio Devices Market Volume K Unit Forecast, by Technology 2019 & 2032
- Table 107: Global Wireless Audio Devices Market Revenue Million Forecast, by Product 2019 & 2032
- Table 108: Global Wireless Audio Devices Market Volume K Unit Forecast, by Product 2019 & 2032
- Table 109: Global Wireless Audio Devices Market Revenue Million Forecast, by Application 2019 & 2032
- Table 110: Global Wireless Audio Devices Market Volume K Unit Forecast, by Application 2019 & 2032
- Table 111: Global Wireless Audio Devices Market Revenue Million Forecast, by Country 2019 & 2032
- Table 112: Global Wireless Audio Devices Market Volume K Unit Forecast, by Country 2019 & 2032
- Table 113: United Kingdom Wireless Audio Devices Market Revenue (Million) Forecast, by Application 2019 & 2032
- Table 114: United Kingdom Wireless Audio Devices Market Volume (K Unit) Forecast, by Application 2019 & 2032
- Table 115: Germany Wireless Audio Devices Market Revenue (Million) Forecast, by Application 2019 & 2032
- Table 116: Germany Wireless Audio Devices Market Volume (K Unit) Forecast, by Application 2019 & 2032
- Table 117: France Wireless Audio Devices Market Revenue (Million) Forecast, by Application 2019 & 2032
- Table 118: France Wireless Audio Devices Market Volume (K Unit) Forecast, by Application 2019 & 2032
- Table 119: Rest of Europe Wireless Audio Devices Market Revenue (Million) Forecast, by Application 2019 & 2032
- Table 120: Rest of Europe Wireless Audio Devices Market Volume (K Unit) Forecast, by Application 2019 & 2032
- Table 121: Global Wireless Audio Devices Market Revenue Million Forecast, by Technology 2019 & 2032
- Table 122: Global Wireless Audio Devices Market Volume K Unit Forecast, by Technology 2019 & 2032
- Table 123: Global Wireless Audio Devices Market Revenue Million Forecast, by Product 2019 & 2032
- Table 124: Global Wireless Audio Devices Market Volume K Unit Forecast, by Product 2019 & 2032
- Table 125: Global Wireless Audio Devices Market Revenue Million Forecast, by Application 2019 & 2032
- Table 126: Global Wireless Audio Devices Market Volume K Unit Forecast, by Application 2019 & 2032
- Table 127: Global Wireless Audio Devices Market Revenue Million Forecast, by Country 2019 & 2032
- Table 128: Global Wireless Audio Devices Market Volume K Unit Forecast, by Country 2019 & 2032
- Table 129: China Wireless Audio Devices Market Revenue (Million) Forecast, by Application 2019 & 2032
- Table 130: China Wireless Audio Devices Market Volume (K Unit) Forecast, by Application 2019 & 2032
- Table 131: Japan Wireless Audio Devices Market Revenue (Million) Forecast, by Application 2019 & 2032
- Table 132: Japan Wireless Audio Devices Market Volume (K Unit) Forecast, by Application 2019 & 2032
- Table 133: India Wireless Audio Devices Market Revenue (Million) Forecast, by Application 2019 & 2032
- Table 134: India Wireless Audio Devices Market Volume (K Unit) Forecast, by Application 2019 & 2032
- Table 135: Rest of Asia Pacific Wireless Audio Devices Market Revenue (Million) Forecast, by Application 2019 & 2032
- Table 136: Rest of Asia Pacific Wireless Audio Devices Market Volume (K Unit) Forecast, by Application 2019 & 2032
- Table 137: Global Wireless Audio Devices Market Revenue Million Forecast, by Technology 2019 & 2032
- Table 138: Global Wireless Audio Devices Market Volume K Unit Forecast, by Technology 2019 & 2032
- Table 139: Global Wireless Audio Devices Market Revenue Million Forecast, by Product 2019 & 2032
- Table 140: Global Wireless Audio Devices Market Volume K Unit Forecast, by Product 2019 & 2032
- Table 141: Global Wireless Audio Devices Market Revenue Million Forecast, by Application 2019 & 2032
- Table 142: Global Wireless Audio Devices Market Volume K Unit Forecast, by Application 2019 & 2032
- Table 143: Global Wireless Audio Devices Market Revenue Million Forecast, by Country 2019 & 2032
- Table 144: Global Wireless Audio Devices Market Volume K Unit Forecast, by Country 2019 & 2032
- Table 145: Global Wireless Audio Devices Market Revenue Million Forecast, by Technology 2019 & 2032
- Table 146: Global Wireless Audio Devices Market Volume K Unit Forecast, by Technology 2019 & 2032
- Table 147: Global Wireless Audio Devices Market Revenue Million Forecast, by Product 2019 & 2032
- Table 148: Global Wireless Audio Devices Market Volume K Unit Forecast, by Product 2019 & 2032
- Table 149: Global Wireless Audio Devices Market Revenue Million Forecast, by Application 2019 & 2032
- Table 150: Global Wireless Audio Devices Market Volume K Unit Forecast, by Application 2019 & 2032
- Table 151: Global Wireless Audio Devices Market Revenue Million Forecast, by Country 2019 & 2032
- Table 152: Global Wireless Audio Devices Market Volume K Unit Forecast, by Country 2019 & 2032
Frequently Asked Questions
1. What is the projected Compound Annual Growth Rate (CAGR) of the Wireless Audio Devices Market?
The projected CAGR is approximately 15.90%.
2. Which companies are prominent players in the Wireless Audio Devices Market?
Key companies in the market include Shure Incorporated, DEI Holdings Inc, Bose Corporation, Samsung Electronics Co Ltd (Harman International Inc ), Vizio Inc, Sennheiser Electronic GMBH & Co KG, Koninklijke Philips NV, Apple Inc, Sony Corporation.
3. What are the main segments of the Wireless Audio Devices Market?
The market segments include Technology, Product, Application.
4. Can you provide details about the market size?
The market size is estimated to be USD XX Million as of 2022.
5. What are some drivers contributing to market growth?
Increasing Mobility Requirements; Rising Disposable Income of Consumers.
6. What are the notable trends driving market growth?
Bluetooth Technology to lead the Wireless Audio Device Market.
7. Are there any restraints impacting market growth?
Issues Related with Operating Frequency Compliance.
8. Can you provide examples of recent developments in the market?
September 2022: Apple released its latest version of AirPods, the AirPods Pro. With the new H2 processor's strength, AirPods Pro is claimed to unlock advanced audio performance, including significant improvements to active noise cancellation and transparency mode, while also providing a special way to enjoy spatial audio in a way that is even more immersive. With extended battery life, a new charging case, and an additional ear tip size for a better fit, consumers are equipped with touch control for music playback and volume adjustments right from the stem.
9. What pricing options are available for accessing the report?
Pricing options include single-user, multi-user, and enterprise licenses priced at USD 4750, USD 5250, and USD 8750 respectively.
10. Is the market size provided in terms of value or volume?
The market size is provided in terms of value, measured in Million and volume, measured in K Unit.
11. Are there any specific market keywords associated with the report?
Yes, the market keyword associated with the report is "Wireless Audio Devices Market," which aids in identifying and referencing the specific market segment covered.
12. How do I determine which pricing option suits my needs best?
The pricing options vary based on user requirements and access needs. Individual users may opt for single-user licenses, while businesses requiring broader access may choose multi-user or enterprise licenses for cost-effective access to the report.
13. Are there any additional resources or data provided in the Wireless Audio Devices Market report?
While the report offers comprehensive insights, it's advisable to review the specific contents or supplementary materials provided to ascertain if additional resources or data are available.
14. How can I stay updated on further developments or reports in the Wireless Audio Devices Market?
To stay informed about further developments, trends, and reports in the Wireless Audio Devices Market, consider subscribing to industry newsletters, following relevant companies and organizations, or regularly checking reputable industry news sources and publications.
Methodology
Step 1 - Identification of Relevant Samples Size from Population Database


Step 2 - Approaches for Defining Global Market Size (Value, Volume* & Price*)

Note*: In applicable scenarios
Step 3 - Data Sources
Primary Research
- Web Analytics
- Survey Reports
- Research Institute
- Latest Research Reports
- Opinion Leaders
Secondary Research
- Annual Reports
- White Paper
- Latest Press Release
- Industry Association
- Paid Database
- Investor Presentations

Step 4 - Data Triangulation
Involves using different sources of information in order to increase the validity of a study
These sources are likely to be stakeholders in a program - participants, other researchers, program staff, other community members, and so on.
Then we put all data in single framework & apply various statistical tools to find out the dynamic on the market.
During the analysis stage, feedback from the stakeholder groups would be compared to determine areas of agreement as well as areas of divergence


