

Key Insights
The Belgian e-commerce market is poised for significant expansion, with a projected market size of 22.71 billion by 2025. The market is expected to grow at a compound annual growth rate (CAGR) of 6.95% between 2025 and 2033. This robust growth is underpinned by increasing internet and smartphone penetration, a growing consumer preference for online shopping convenience, and an expanding array of products and services available online. Enhanced logistics and delivery infrastructure, alongside the widespread adoption of digital payment methods, are key catalysts. Emerging trends such as personalized shopping experiences, omnichannel strategies, and the proliferation of social commerce are further accelerating market expansion. Potential challenges may include data security and privacy concerns, intense competition from established international players, and the necessity for further digital infrastructure development in rural areas. The market is segmented by application, reflecting a diverse range of online retail, from fashion and electronics to groceries and home goods. Prominent players like BIRKENSHOP, Amazon, Zalando, and bol.com highlight the competitive environment and the market's appeal to both domestic and international businesses.
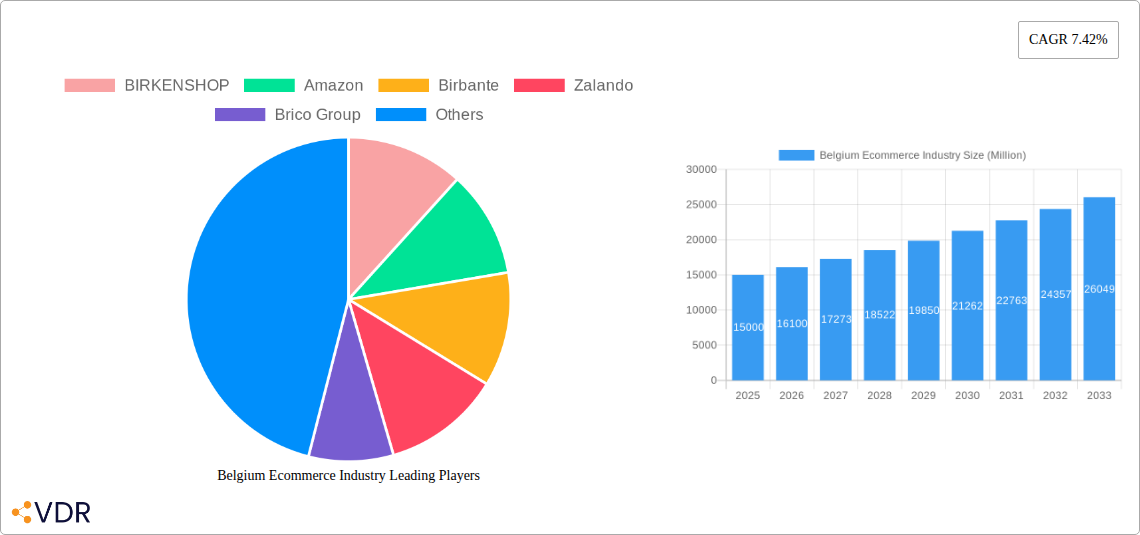
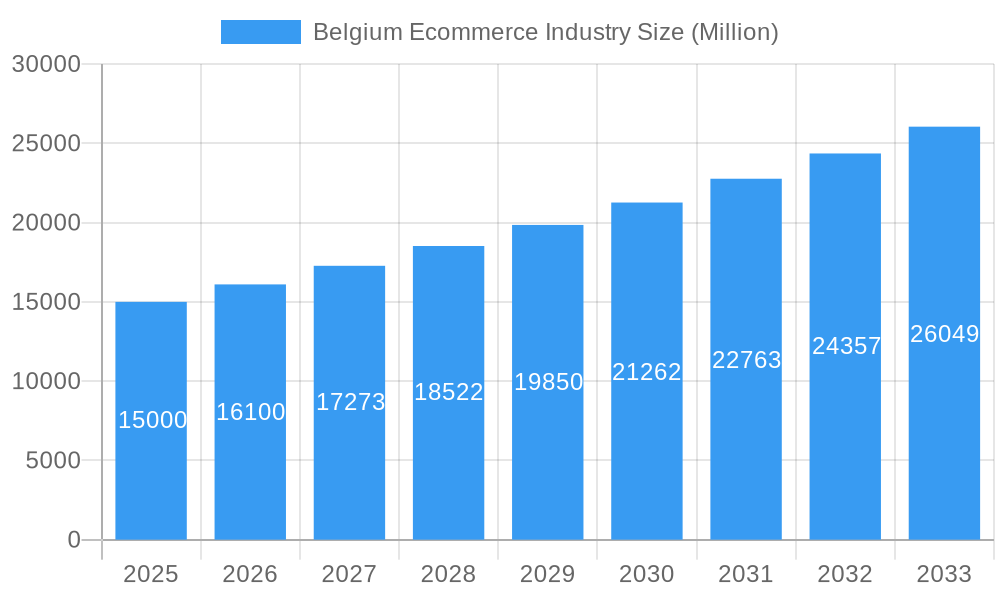
Belgium Ecommerce Industry Market Size (In Billion)
The substantial market size in 2025, coupled with a healthy CAGR, signals strong potential for continued growth. The presence of major international e-commerce entities alongside local competitors suggests a future characterized by heightened competition and potential market consolidation. Businesses that effectively target niche markets, deliver exceptional customer service, and embrace innovative technologies are best positioned for success. Future expansion will hinge on addressing potential impediments, such as strengthening cybersecurity measures and narrowing the digital divide across Belgium. A deep understanding of consumer behavior and preferences, a commitment to seamless customer experiences, and strategic investment in robust logistical capabilities will be paramount for sustained success in the dynamic Belgian e-commerce landscape.
Belgium Ecommerce Industry Company Market Share
Belgium Ecommerce Industry Market Report: 2019-2033
This comprehensive report provides a detailed analysis of the Belgium ecommerce industry, covering market dynamics, growth trends, key players, and future outlook. With a focus on both parent and child markets, this report is essential for businesses, investors, and industry professionals seeking to understand and capitalize on opportunities within this rapidly evolving sector. The study period spans from 2019 to 2033, with a base year of 2025 and a forecast period of 2025-2033.
Belgium Ecommerce Industry Market Dynamics & Structure
This section analyzes the competitive landscape, technological advancements, regulatory influences, and market trends within the Belgian ecommerce industry. The market is characterized by a mix of large multinational players and smaller, specialized businesses, resulting in a moderately concentrated market structure. The precise market share of each key player is difficult to obtain for all players, but estimates indicate that the top 5 players likely hold xx% of the total market share as of 2025.
- Market Concentration: Moderate, with several dominant players and a significant number of smaller businesses. Exact market share data for all players is unavailable but a projected split is provided above.
- Technological Innovation: Driven by advancements in mobile commerce, AI-powered personalization, and efficient logistics solutions. Barriers to innovation include high initial investment costs and adapting to rapid technological changes.
- Regulatory Framework: The Belgian government's stance on data privacy, consumer protection, and cross-border e-commerce significantly influences industry practices.
- Competitive Product Substitutes: Traditional brick-and-mortar retail remains a significant competitor, although the ecommerce sector shows continuous growth.
- End-User Demographics: The Belgian ecommerce market caters to a diverse consumer base, with growing penetration across all age groups and socio-economic strata.
- M&A Trends: Consolidation within the industry is expected to continue, driven by the need for scale and expansion into new markets. The number of M&A deals in the period 2019-2024 is estimated at xx.
Belgium Ecommerce Industry Growth Trends & Insights
The Belgian ecommerce market exhibits robust growth, driven by rising internet penetration, increasing smartphone usage, and evolving consumer preferences. The historical period (2019-2024) witnessed a CAGR of xx%, while the forecast period (2025-2033) projects a CAGR of xx%. Market penetration continues to increase, with a projected xx% of the total retail market share accounted for by ecommerce in 2025. Technological disruptions, such as the rise of mobile commerce and the adoption of advanced analytics, are key factors driving this growth. Consumer behavior shifts toward online shopping, facilitated by increased convenience and wider product selection, further contribute to market expansion.
Dominant Regions, Countries, or Segments in Belgium Ecommerce Industry
The Flemish Region is currently the leading region in the Belgian ecommerce market, driven by higher internet penetration, higher disposable incomes, and a strong concentration of businesses. The region's robust infrastructure and supportive economic policies further contribute to its dominance. The Wallonia region shows promising growth potential, however it lags behind Flanders due to lower internet penetration and economic activity.
- Key Drivers in Flanders:
- High internet and smartphone penetration
- Strong infrastructure (logistics, internet access)
- Supportive government policies for business development
- Higher disposable incomes compared to other regions
- Growth Potential in Wallonia:
- Government initiatives to improve digital infrastructure
- Growing focus on attracting e-commerce businesses
- Increasing internet penetration
Belgium Ecommerce Industry Product Landscape
The Belgian ecommerce market encompasses a broad range of products and services, from fashion and electronics to groceries and home improvement. Innovation is evident in personalized recommendations, improved online shopping experiences (like AR/VR integration), and subscription-based services. Technological advancements, such as AI-driven chatbots and advanced analytics, are enhancing customer service and optimizing business operations. Unique selling propositions often involve fast delivery, user-friendly websites/apps, and loyalty programs.
Key Drivers, Barriers & Challenges in Belgium Ecommerce Industry
Key Drivers: Rising internet penetration, increasing smartphone usage, and growing consumer preference for online shopping are the primary drivers. Government initiatives supporting digitalization and technological advancements further contribute to market expansion. The robust logistics network within Belgium also plays a significant role.
Key Challenges: Competition from traditional retailers, regulatory hurdles related to data privacy and consumer protection, and maintaining efficient and cost-effective supply chains represent significant challenges. Furthermore, the evolving cybersecurity landscape poses a threat to consumers and businesses alike. The rising costs of logistics due to global events such as the war in Ukraine and increased fuel prices, also significantly impact the industry.
Emerging Opportunities in Belgium Ecommerce Industry
Untapped markets within specific demographics (e.g., elderly populations), niche product categories, and the expansion into cross-border ecommerce present significant opportunities. Personalized shopping experiences, incorporating augmented reality (AR) and virtual reality (VR) technology, offer considerable potential for market growth. The increasing demand for sustainable and ethical products also provides opportunities for businesses focusing on environmentally conscious practices and transparent supply chains.
Growth Accelerators in the Belgium Ecommerce Industry
Long-term growth will be fueled by continued improvements in digital infrastructure, the adoption of advanced technologies like AI and machine learning, and strategic partnerships between e-commerce platforms and logistics providers. Expansion into new markets and the integration of omnichannel strategies are key factors driving the continued expansion of the Belgian ecommerce sector. Furthermore, the increasing adoption of mobile payment solutions will accelerate growth.
Notable Milestones in Belgium Ecommerce Industry Sector
- February 2022: Amazon announces plans to build a fulfillment center in Antwerp.
- April 2022: ViaEurope launches a fully automated sorting belt in its Liege E-Hub, enhancing logistics efficiency.
In-Depth Belgium Ecommerce Industry Market Outlook
The Belgian ecommerce market is poised for continued strong growth, driven by technological advancements, increased consumer adoption, and supportive government policies. Strategic opportunities exist in focusing on niche markets, implementing omnichannel strategies, and leveraging data analytics to enhance customer experiences. The future of the Belgian ecommerce market is bright, with significant potential for both established players and new entrants.
Belgium Ecommerce Industry Segmentation
-
1. B2C E-commerce
- 1.1. Market size (GMV) for the period of 2017-2027
-
1.2. Market Segmentation - by Application
- 1.2.1. Beauty & Personal Care
- 1.2.2. Consumer Electronics
- 1.2.3. Fashion & Apparel
- 1.2.4. Food & Beverage
- 1.2.5. Furniture & Home
- 1.2.6. Others (Toys, DIY, Media, etc.)
- 2. Market size (GMV) for the period of 2017-2027
-
3. Application
- 3.1. Beauty & Personal Care
- 3.2. Consumer Electronics
- 3.3. Fashion & Apparel
- 3.4. Food & Beverage
- 3.5. Furniture & Home
- 3.6. Others (Toys, DIY, Media, etc.)
- 4. Beauty & Personal Care
- 5. Consumer Electronics
- 6. Fashion & Apparel
- 7. Food & Beverage
- 8. Furniture & Home
- 9. Others (Toys, DIY, Media, etc.)
-
10. B2B E-commerce
- 10.1. Market size for the period of 2017-2027
Belgium Ecommerce Industry Segmentation By Geography
- 1. Belgium
Belgium Ecommerce Industry Regional Market Share
Geographic Coverage of Belgium Ecommerce Industry
Belgium Ecommerce Industry REPORT HIGHLIGHTS
| Aspects | Details |
|---|---|
| Study Period | 2020-2034 |
| Base Year | 2025 |
| Estimated Year | 2026 |
| Forecast Period | 2026-2034 |
| Historical Period | 2020-2025 |
| Growth Rate | CAGR of 6.95% from 2020-2034 |
| Segmentation |
|
Table of Contents
- 1. Introduction
- 1.1. Research Scope
- 1.2. Market Segmentation
- 1.3. Research Objective
- 1.4. Definitions and Assumptions
- 2. Executive Summary
- 2.1. Market Snapshot
- 3. Market Dynamics
- 3.1. Market Drivers
- 3.2. Market Restrains
- 3.3. Market Trends
- 3.4. Market Opportunities
- 4. Market Factor Analysis
- 4.1. Porters Five Forces
- 4.1.1. Bargaining Power of Suppliers
- 4.1.2. Bargaining Power of Buyers
- 4.1.3. Threat of New Entrants
- 4.1.4. Threat of Substitutes
- 4.1.5. Competitive Rivalry
- 4.2. PESTEL analysis
- 4.3. BCG Analysis
- 4.3.1. Stars (High Growth, High Market Share)
- 4.3.2. Cash Cows (Low Growth, High Market Share)
- 4.3.3. Question Mark (High Growth, Low Market Share)
- 4.3.4. Dogs (Low Growth, Low Market Share)
- 4.4. Ansoff Matrix Analysis
- 4.5. Supply Chain Analysis
- 4.6. Regulatory Landscape
- 4.7. Current Market Potential and Opportunity Assessment (TAM–SAM–SOM Framework)
- 4.8. VDR Analyst Note
- 4.1. Porters Five Forces
- 5. Market Analysis, Insights and Forecast 2021-2033
- 5.1. Market Analysis, Insights and Forecast - by B2C E-commerce
- 5.1.1. Market size (GMV) for the period of 2017-2027
- 5.1.2. Market Segmentation - by Application
- 5.1.2.1. Beauty & Personal Care
- 5.1.2.2. Consumer Electronics
- 5.1.2.3. Fashion & Apparel
- 5.1.2.4. Food & Beverage
- 5.1.2.5. Furniture & Home
- 5.1.2.6. Others (Toys, DIY, Media, etc.)
- 5.2. Market Analysis, Insights and Forecast - by Market size (GMV) for the period of 2017-2027
- 5.3. Market Analysis, Insights and Forecast - by Application
- 5.3.1. Beauty & Personal Care
- 5.3.2. Consumer Electronics
- 5.3.3. Fashion & Apparel
- 5.3.4. Food & Beverage
- 5.3.5. Furniture & Home
- 5.3.6. Others (Toys, DIY, Media, etc.)
- 5.4. Market Analysis, Insights and Forecast - by Beauty & Personal Care
- 5.5. Market Analysis, Insights and Forecast - by Consumer Electronics
- 5.6. Market Analysis, Insights and Forecast - by Fashion & Apparel
- 5.7. Market Analysis, Insights and Forecast - by Food & Beverage
- 5.8. Market Analysis, Insights and Forecast - by Furniture & Home
- 5.9. Market Analysis, Insights and Forecast - by Others (Toys, DIY, Media, etc.)
- 5.10. Market Analysis, Insights and Forecast - by B2B E-commerce
- 5.10.1. Market size for the period of 2017-2027
- 5.11. Market Analysis, Insights and Forecast - by Region
- 5.11.1. Belgium
- 5.1. Market Analysis, Insights and Forecast - by B2C E-commerce
- 6. Belgium Ecommerce Industry Analysis, Insights and Forecast, 2021-2033
- 6.1. Market Analysis, Insights and Forecast - by B2C E-commerce
- 6.1.1. Market size (GMV) for the period of 2017-2027
- 6.1.2. Market Segmentation - by Application
- 6.1.2.1. Beauty & Personal Care
- 6.1.2.2. Consumer Electronics
- 6.1.2.3. Fashion & Apparel
- 6.1.2.4. Food & Beverage
- 6.1.2.5. Furniture & Home
- 6.1.2.6. Others (Toys, DIY, Media, etc.)
- 6.2. Market Analysis, Insights and Forecast - by Market size (GMV) for the period of 2017-2027
- 6.3. Market Analysis, Insights and Forecast - by Application
- 6.3.1. Beauty & Personal Care
- 6.3.2. Consumer Electronics
- 6.3.3. Fashion & Apparel
- 6.3.4. Food & Beverage
- 6.3.5. Furniture & Home
- 6.3.6. Others (Toys, DIY, Media, etc.)
- 6.4. Market Analysis, Insights and Forecast - by Beauty & Personal Care
- 6.5. Market Analysis, Insights and Forecast - by Consumer Electronics
- 6.6. Market Analysis, Insights and Forecast - by Fashion & Apparel
- 6.7. Market Analysis, Insights and Forecast - by Food & Beverage
- 6.8. Market Analysis, Insights and Forecast - by Furniture & Home
- 6.9. Market Analysis, Insights and Forecast - by Others (Toys, DIY, Media, etc.)
- 6.10. Market Analysis, Insights and Forecast - by B2B E-commerce
- 6.10.1. Market size for the period of 2017-2027
- 6.1. Market Analysis, Insights and Forecast - by B2C E-commerce
- 7. Competitive Analysis
- 7.1. Company Profiles
- 7.1.1 BIRKENSHOP
- 7.1.1.1. Company Overview
- 7.1.1.2. Products
- 7.1.1.3. Company Financials
- 7.1.1.4. SWOT Analysis
- 7.1.2 Amazon
- 7.1.2.1. Company Overview
- 7.1.2.2. Products
- 7.1.2.3. Company Financials
- 7.1.2.4. SWOT Analysis
- 7.1.3 Birbante
- 7.1.3.1. Company Overview
- 7.1.3.2. Products
- 7.1.3.3. Company Financials
- 7.1.3.4. SWOT Analysis
- 7.1.4 Zalando
- 7.1.4.1. Company Overview
- 7.1.4.2. Products
- 7.1.4.3. Company Financials
- 7.1.4.4. SWOT Analysis
- 7.1.5 Brico Group
- 7.1.5.1. Company Overview
- 7.1.5.2. Products
- 7.1.5.3. Company Financials
- 7.1.5.4. SWOT Analysis
- 7.1.6 Coolblue
- 7.1.6.1. Company Overview
- 7.1.6.2. Products
- 7.1.6.3. Company Financials
- 7.1.6.4. SWOT Analysis
- 7.1.7 Veepee*List Not Exhaustive
- 7.1.7.1. Company Overview
- 7.1.7.2. Products
- 7.1.7.3. Company Financials
- 7.1.7.4. SWOT Analysis
- 7.1.8 Qpon
- 7.1.8.1. Company Overview
- 7.1.8.2. Products
- 7.1.8.3. Company Financials
- 7.1.8.4. SWOT Analysis
- 7.1.9 Vanden Borre NV
- 7.1.9.1. Company Overview
- 7.1.9.2. Products
- 7.1.9.3. Company Financials
- 7.1.9.4. SWOT Analysis
- 7.1.10 bol com
- 7.1.10.1. Company Overview
- 7.1.10.2. Products
- 7.1.10.3. Company Financials
- 7.1.10.4. SWOT Analysis
- 7.1.1 BIRKENSHOP
- 7.2. Market Entropy
- 7.2.1 Company's Key Areas Served
- 7.2.2 Recent Developments
- 7.3. Company Market Share Analysis 2025
- 7.3.1 Top 5 Companies Market Share Analysis
- 7.3.2 Top 3 Companies Market Share Analysis
- 7.4. List of Potential Customers
- 8. Research Methodology
List of Figures
- Figure 1: Belgium Ecommerce Industry Revenue Breakdown (billion, %) by Product 2025 & 2033
- Figure 2: Belgium Ecommerce Industry Share (%) by Company 2025
List of Tables
- Table 1: Belgium Ecommerce Industry Revenue billion Forecast, by B2C E-commerce 2020 & 2033
- Table 2: Belgium Ecommerce Industry Revenue billion Forecast, by Market size (GMV) for the period of 2017-2027 2020 & 2033
- Table 3: Belgium Ecommerce Industry Revenue billion Forecast, by Application 2020 & 2033
- Table 4: Belgium Ecommerce Industry Revenue billion Forecast, by Beauty & Personal Care 2020 & 2033
- Table 5: Belgium Ecommerce Industry Revenue billion Forecast, by Consumer Electronics 2020 & 2033
- Table 6: Belgium Ecommerce Industry Revenue billion Forecast, by Fashion & Apparel 2020 & 2033
- Table 7: Belgium Ecommerce Industry Revenue billion Forecast, by Food & Beverage 2020 & 2033
- Table 8: Belgium Ecommerce Industry Revenue billion Forecast, by Furniture & Home 2020 & 2033
- Table 9: Belgium Ecommerce Industry Revenue billion Forecast, by Others (Toys, DIY, Media, etc.) 2020 & 2033
- Table 10: Belgium Ecommerce Industry Revenue billion Forecast, by B2B E-commerce 2020 & 2033
- Table 11: Belgium Ecommerce Industry Revenue billion Forecast, by Region 2020 & 2033
- Table 12: Belgium Ecommerce Industry Revenue billion Forecast, by B2C E-commerce 2020 & 2033
- Table 13: Belgium Ecommerce Industry Revenue billion Forecast, by Market size (GMV) for the period of 2017-2027 2020 & 2033
- Table 14: Belgium Ecommerce Industry Revenue billion Forecast, by Application 2020 & 2033
- Table 15: Belgium Ecommerce Industry Revenue billion Forecast, by Beauty & Personal Care 2020 & 2033
- Table 16: Belgium Ecommerce Industry Revenue billion Forecast, by Consumer Electronics 2020 & 2033
- Table 17: Belgium Ecommerce Industry Revenue billion Forecast, by Fashion & Apparel 2020 & 2033
- Table 18: Belgium Ecommerce Industry Revenue billion Forecast, by Food & Beverage 2020 & 2033
- Table 19: Belgium Ecommerce Industry Revenue billion Forecast, by Furniture & Home 2020 & 2033
- Table 20: Belgium Ecommerce Industry Revenue billion Forecast, by Others (Toys, DIY, Media, etc.) 2020 & 2033
- Table 21: Belgium Ecommerce Industry Revenue billion Forecast, by B2B E-commerce 2020 & 2033
- Table 22: Belgium Ecommerce Industry Revenue billion Forecast, by Country 2020 & 2033
Frequently Asked Questions
1. What is the projected Compound Annual Growth Rate (CAGR) of the Belgium Ecommerce Industry?
The projected CAGR is approximately 6.95%.
2. Which companies are prominent players in the Belgium Ecommerce Industry?
Key companies in the market include BIRKENSHOP, Amazon, Birbante, Zalando, Brico Group, Coolblue, Veepee*List Not Exhaustive, Qpon, Vanden Borre NV, bol com.
3. What are the main segments of the Belgium Ecommerce Industry?
The market segments include B2C E-commerce, Market size (GMV) for the period of 2017-2027, Application, Beauty & Personal Care, Consumer Electronics, Fashion & Apparel, Food & Beverage, Furniture & Home, Others (Toys, DIY, Media, etc.), B2B E-commerce.
4. Can you provide details about the market size?
The market size is estimated to be USD 22.71 billion as of 2022.
5. What are some drivers contributing to market growth?
Increased Internet Penetration Across the Country; Increased Adoption of Smartphones.
6. What are the notable trends driving market growth?
Increase in Internet Penetration Across the Country is Fueling the Growth of the Market..
7. Are there any restraints impacting market growth?
Low Light Sensing Capabilities Act as a Restraining Factor; Low-cost Sensors are Increasing the Threat to Scale Down the Quality.
8. Can you provide examples of recent developments in the market?
April 2022 - ViaEurope, an e-commerce logistics company, has launched a fully automatic sorting belt in its Liege E-Hub. This new system can handle over 3.500 parcels per hour, scan barcodes on five sides of the package, weigh it, measure it, and capture pictures. This system launch was according to the company's commitment to operational safety and efficiency.
9. What pricing options are available for accessing the report?
Pricing options include single-user, multi-user, and enterprise licenses priced at USD 3800, USD 4500, and USD 5800 respectively.
10. Is the market size provided in terms of value or volume?
The market size is provided in terms of value, measured in billion.
11. Are there any specific market keywords associated with the report?
Yes, the market keyword associated with the report is "Belgium Ecommerce Industry," which aids in identifying and referencing the specific market segment covered.
12. How do I determine which pricing option suits my needs best?
The pricing options vary based on user requirements and access needs. Individual users may opt for single-user licenses, while businesses requiring broader access may choose multi-user or enterprise licenses for cost-effective access to the report.
13. Are there any additional resources or data provided in the Belgium Ecommerce Industry report?
While the report offers comprehensive insights, it's advisable to review the specific contents or supplementary materials provided to ascertain if additional resources or data are available.
14. How can I stay updated on further developments or reports in the Belgium Ecommerce Industry?
To stay informed about further developments, trends, and reports in the Belgium Ecommerce Industry, consider subscribing to industry newsletters, following relevant companies and organizations, or regularly checking reputable industry news sources and publications.
Methodology
Step 1 - Identification of Relevant Samples Size from Population Database


Step 2 - Approaches for Defining Global Market Size (Value, Volume* & Price*)

Note*: In applicable scenarios
Step 3 - Data Sources
Primary Research
- Web Analytics
- Survey Reports
- Research Institute
- Latest Research Reports
- Opinion Leaders
Secondary Research
- Annual Reports
- White Paper
- Latest Press Release
- Industry Association
- Paid Database
- Investor Presentations

Step 4 - Data Triangulation
Involves using different sources of information in order to increase the validity of a study
These sources are likely to be stakeholders in a program - participants, other researchers, program staff, other community members, and so on.
Then we put all data in single framework & apply various statistical tools to find out the dynamic on the market.
During the analysis stage, feedback from the stakeholder groups would be compared to determine areas of agreement as well as areas of divergence