
Key Insights
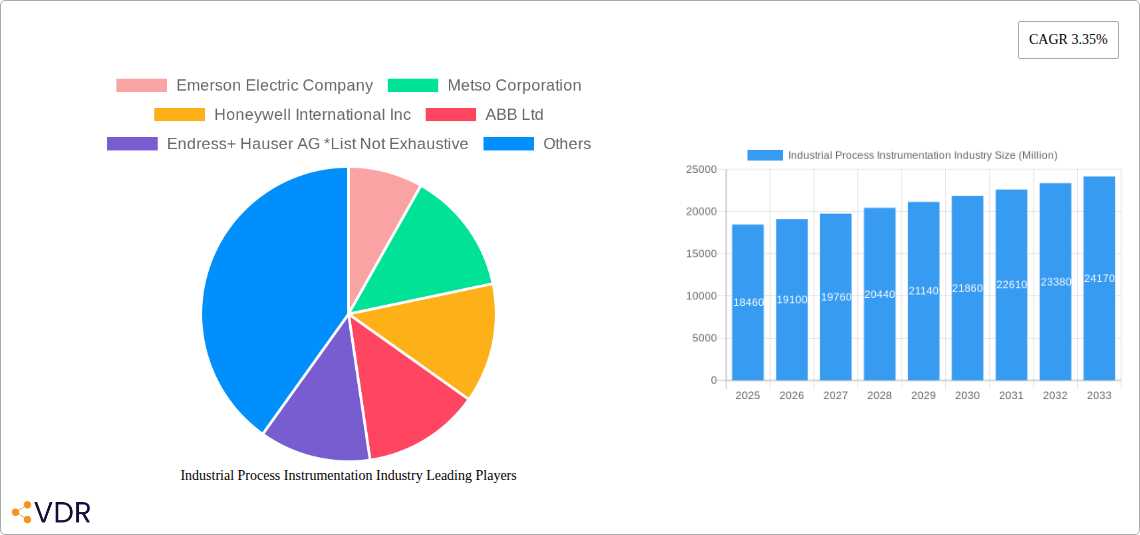
The Industrial Process Instrumentation market, valued at $18.46 billion in 2025, is projected to experience steady growth, driven by increasing automation in process industries and the burgeoning demand for advanced process control solutions. The market's Compound Annual Growth Rate (CAGR) of 3.35% from 2025 to 2033 reflects a consistent, albeit moderate, expansion fueled by several key factors. The rising adoption of sophisticated technologies like Programmable Logic Controllers (PLCs), Distributed Control Systems (DCS), and Supervisory Control and Data Acquisition (SCADA) systems across diverse end-user sectors, including water and wastewater treatment, chemical manufacturing, energy & utilities, and oil & gas, is a significant driver. Furthermore, the increasing need for enhanced operational efficiency, improved safety measures, and real-time monitoring capabilities in industrial processes is boosting market demand. Growth is further propelled by the expanding digitalization efforts within industries, leading to the integration of advanced analytics and predictive maintenance solutions.
However, the market faces certain restraints. High initial investment costs associated with installing and maintaining advanced instrumentation can deter smaller companies, potentially limiting overall market growth. Furthermore, the complexity of integrating various systems and the need for skilled personnel to operate and maintain these technologies could pose challenges. Despite these constraints, the long-term outlook for the Industrial Process Instrumentation market remains positive, driven by ongoing technological advancements, the increasing adoption of Industry 4.0 principles, and stringent environmental regulations pushing for greater process optimization and control across various sectors. The presence of established players like Emerson Electric, Honeywell, and Siemens, alongside emerging innovative companies, indicates a competitive yet dynamic market landscape. Geographic expansion, particularly in rapidly developing economies of Asia-Pacific, will further contribute to market growth in the coming years.
Industrial Process Instrumentation Industry Market Report: 2019-2033
This comprehensive report provides a detailed analysis of the Industrial Process Instrumentation market, encompassing its dynamics, growth trends, regional dominance, product landscape, challenges, opportunities, and key players. The study period covers 2019-2033, with 2025 as the base and estimated year. The report's detailed insights are crucial for industry professionals, investors, and strategists seeking to navigate this dynamic sector. Market values are presented in million units.
Industrial Process Instrumentation Industry Market Dynamics & Structure
The industrial process instrumentation market, valued at xx million units in 2024, is characterized by moderate concentration with key players like Emerson Electric Company, Honeywell International Inc, ABB Ltd, Endress+Hauser AG, and Siemens AG holding significant market shares. The market is driven by technological advancements in areas like Programmable Logic Controllers (PLCs), Distributed Control Systems (DCS), and Supervisory Control and Data Acquisition (SCADA) systems, increasing automation needs across various end-user industries, and stringent regulatory compliance requirements. However, factors like high initial investment costs, complex integration processes, and the availability of substitute technologies pose challenges to market growth.
- Market Concentration: Moderately concentrated, with top 5 players holding approximately xx% market share in 2024.
- Technological Innovation: Strong focus on AI, IoT, and predictive maintenance technologies.
- Regulatory Landscape: Stringent safety and environmental regulations driving demand for advanced instrumentation.
- Competitive Substitutes: Limited direct substitutes, but alternative automation approaches pose indirect competition.
- M&A Activity: Moderate level of M&A activity, primarily focused on expanding product portfolios and geographic reach. Approximately xx deals were recorded between 2019 and 2024.
- End-User Demographics: Significant demand from Chemical Manufacturing, Energy & Utilities, and Oil & Gas Extraction sectors.
Industrial Process Instrumentation Industry Growth Trends & Insights
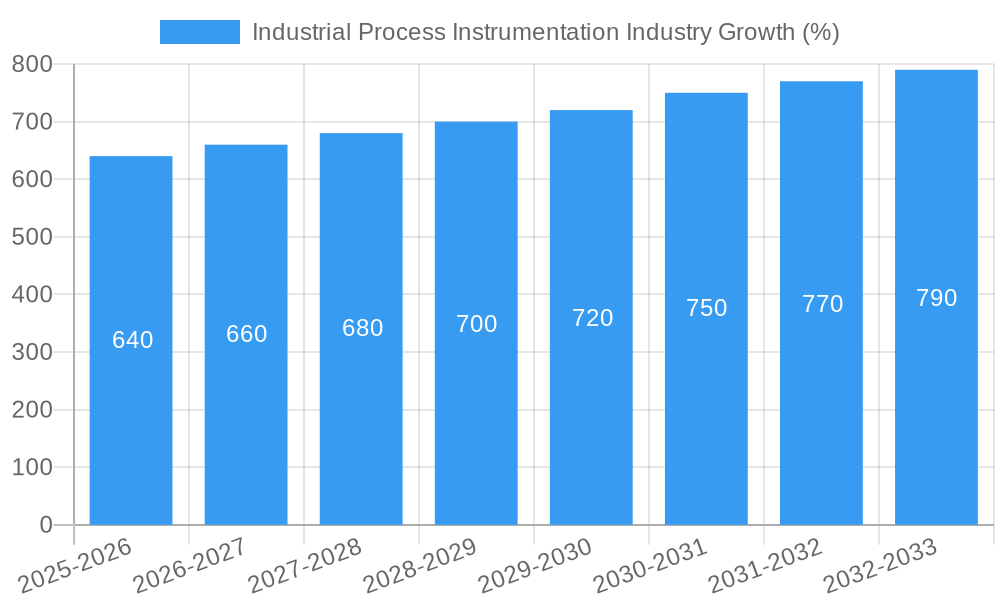
The industrial process instrumentation market experienced a CAGR of xx% during the historical period (2019-2024), driven by increased industrial automation and digitalization efforts. The market is expected to maintain a steady growth trajectory, reaching xx million units by 2033, with a projected CAGR of xx% during the forecast period (2025-2033). This growth is fueled by the rising adoption of advanced technologies like AI-powered predictive maintenance, improved process efficiency, and the increasing demand for enhanced safety and regulatory compliance in various industries. Shifts in consumer behavior towards sustainable and environmentally friendly solutions are also influencing the market. Market penetration of advanced technologies like DCS and MES systems is increasing across various industries.
Dominant Regions, Countries, or Segments in Industrial Process Instrumentation Industry
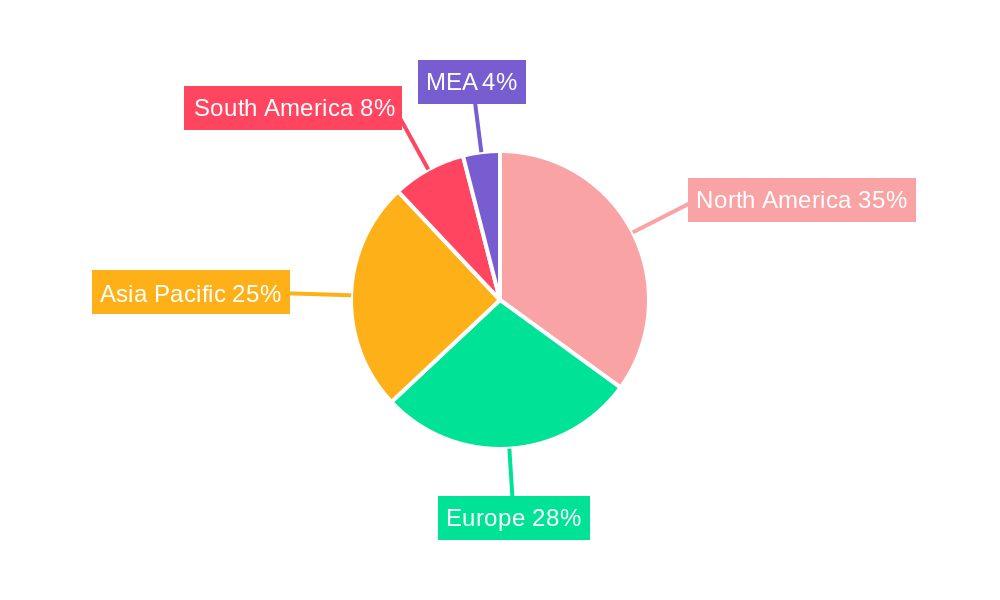
North America and Europe currently dominate the industrial process instrumentation market, driven by strong industrial bases and early adoption of advanced technologies. However, the Asia-Pacific region is expected to experience the fastest growth in the coming years, fueled by rapid industrialization and increasing investments in infrastructure projects. Within segments, the demand for advanced control systems like DCS and PLC's remains high, while the Transmitter and Control Valve segments are experiencing stable, consistent growth. The Chemical Manufacturing, Energy & Utilities, and Oil & Gas Extraction end-user sectors are the largest contributors to market revenue.
- Key Regional Drivers:
- North America: Strong industrial base, technological advancements, and regulatory compliance.
- Europe: High automation levels in key industries, coupled with stringent environmental regulations.
- Asia-Pacific: Rapid industrialization, growing infrastructure investments, and increasing government support for automation.
- Leading Segments: DCS, PLC, and Transmitters consistently show high demand.
- Dominant End-Users: Chemical Manufacturing, Energy & Utilities, and Oil & Gas Extraction sectors.
Industrial Process Instrumentation Industry Product Landscape
The industrial process instrumentation market offers a diverse range of products, including transmitters, control valves, PLCs, DCS, SCADA, and MES systems. Recent innovations focus on improving accuracy, reliability, connectivity, and integration with other industrial automation systems. The integration of AI and IoT technologies is enabling predictive maintenance and real-time process optimization. Key selling propositions include enhanced efficiency, reduced downtime, improved safety, and better environmental compliance.
Key Drivers, Barriers & Challenges in Industrial Process Instrumentation Industry
Key Drivers:
- Increasing automation in industries: Demand for improved efficiency and productivity.
- Advancements in technology: AI, IoT, and cloud computing are driving innovation.
- Stringent safety and environmental regulations: Need for reliable and compliant instrumentation.
Key Challenges:
- High initial investment costs: Can deter smaller companies from adopting advanced technologies.
- Complex integration processes: Requires specialized skills and expertise.
- Supply chain disruptions: Can impact the availability and cost of components. (Estimated impact: xx% reduction in production in 2022).
Emerging Opportunities in Industrial Process Instrumentation Industry
- Growing demand for smart manufacturing solutions: Integration of AI and IoT in process control.
- Expansion into untapped markets: Focus on developing economies and emerging industries.
- Development of sustainable and energy-efficient instrumentation: Meeting environmental concerns.
Growth Accelerators in the Industrial Process Instrumentation Industry Industry
Technological advancements, strategic partnerships between instrumentation providers and industrial automation companies, and expansion into new and emerging markets are key growth accelerators. The increasing adoption of Industry 4.0 principles and the rising focus on digital transformation within various industrial sectors will continue to drive market growth.
Key Players Shaping the Industrial Process Instrumentation Industry Market
- Emerson Electric Company
- Metso Corporation
- Honeywell International Inc
- ABB Ltd
- Endress+Hauser AG
- Mitsubishi Electric Corporation
- Siemens AG
- Danaher Corporation
- Omron Corporation
- Rockwell Automation Inc
- Yokogawa Electric Corporation
Notable Milestones in Industrial Process Instrumentation Industry Sector
- July 2022: Hawk Measurement Systems launches the industry's first Guided Wave Radar Position Transmitter with Power over Ethernet.
- May 2022: SymphonyAI Industrial launches its AI-powered MOM 360 manufacturing operations management solution.
- March 2022: AMETEK Process Instruments launches a new e-commerce platform for the US market.
- January 2022: Parker Hannifin introduces its EP Series Pro-Bloc valves compliant with EEMUA 182.
In-Depth Industrial Process Instrumentation Industry Market Outlook
The future of the industrial process instrumentation market is bright, with continued growth driven by technological innovation, increasing automation across various industries, and the growing adoption of Industry 4.0 principles. Strategic partnerships and expansion into new markets, especially in developing economies, present significant opportunities for growth. The integration of AI, IoT, and cloud computing will further enhance the capabilities and value proposition of industrial process instrumentation, driving long-term market expansion.
Industrial Process Instrumentation Industry Segmentation
-
1. Instrument
- 1.1. Transmitter
- 1.2. Control Valve
-
2. Technology
- 2.1. Programmable Logic Controller (PLC)
- 2.2. Distributed Control System (DCS)
- 2.3. Supervisory Control and Data Acquisition (SCADA)
- 2.4. Manufacturing Execution System (MES)
-
3. End-User
- 3.1. Water and Wastewater Treatment
- 3.2. Chemical Manufacturing
- 3.3. Energy & Utilities
- 3.4. Oil and Gas Extraction
- 3.5. Metals and Mining
- 3.6. Other Process Industries
Industrial Process Instrumentation Industry Segmentation By Geography
- 1. North America
- 2. Europe
- 3. Asia Pacific
- 4. Rest of the World
Industrial Process Instrumentation Industry REPORT HIGHLIGHTS
| Aspects | Details |
|---|---|
| Study Period | 2019-2033 |
| Base Year | 2024 |
| Estimated Year | 2025 |
| Forecast Period | 2025-2033 |
| Historical Period | 2019-2024 |
| Growth Rate | CAGR of 3.35% from 2019-2033 |
| Segmentation |
|
Table of Contents
- 1. Introduction
- 1.1. Research Scope
- 1.2. Market Segmentation
- 1.3. Research Methodology
- 1.4. Definitions and Assumptions
- 2. Executive Summary
- 2.1. Introduction
- 3. Market Dynamics
- 3.1. Introduction
- 3.2. Market Drivers
- 3.2.1. Growing demand for energy-efficient production processes; High level of efficiency with minimum cost
- 3.3. Market Restrains
- 3.3.1. Higher cost of research and development; Higher cost of implementation and maintenance of solutions and devices
- 3.4. Market Trends
- 3.4.1. Water and Wastewater Treatment is Expected to Witness the Highest Growth
- 4. Market Factor Analysis
- 4.1. Porters Five Forces
- 4.2. Supply/Value Chain
- 4.3. PESTEL analysis
- 4.4. Market Entropy
- 4.5. Patent/Trademark Analysis
- 5. Global Industrial Process Instrumentation Industry Analysis, Insights and Forecast, 2019-2031
- 5.1. Market Analysis, Insights and Forecast - by Instrument
- 5.1.1. Transmitter
- 5.1.2. Control Valve
- 5.2. Market Analysis, Insights and Forecast - by Technology
- 5.2.1. Programmable Logic Controller (PLC)
- 5.2.2. Distributed Control System (DCS)
- 5.2.3. Supervisory Control and Data Acquisition (SCADA)
- 5.2.4. Manufacturing Execution System (MES)
- 5.3. Market Analysis, Insights and Forecast - by End-User
- 5.3.1. Water and Wastewater Treatment
- 5.3.2. Chemical Manufacturing
- 5.3.3. Energy & Utilities
- 5.3.4. Oil and Gas Extraction
- 5.3.5. Metals and Mining
- 5.3.6. Other Process Industries
- 5.4. Market Analysis, Insights and Forecast - by Region
- 5.4.1. North America
- 5.4.2. Europe
- 5.4.3. Asia Pacific
- 5.4.4. Rest of the World
- 5.1. Market Analysis, Insights and Forecast - by Instrument
- 6. North America Industrial Process Instrumentation Industry Analysis, Insights and Forecast, 2019-2031
- 6.1. Market Analysis, Insights and Forecast - by Instrument
- 6.1.1. Transmitter
- 6.1.2. Control Valve
- 6.2. Market Analysis, Insights and Forecast - by Technology
- 6.2.1. Programmable Logic Controller (PLC)
- 6.2.2. Distributed Control System (DCS)
- 6.2.3. Supervisory Control and Data Acquisition (SCADA)
- 6.2.4. Manufacturing Execution System (MES)
- 6.3. Market Analysis, Insights and Forecast - by End-User
- 6.3.1. Water and Wastewater Treatment
- 6.3.2. Chemical Manufacturing
- 6.3.3. Energy & Utilities
- 6.3.4. Oil and Gas Extraction
- 6.3.5. Metals and Mining
- 6.3.6. Other Process Industries
- 6.1. Market Analysis, Insights and Forecast - by Instrument
- 7. Europe Industrial Process Instrumentation Industry Analysis, Insights and Forecast, 2019-2031
- 7.1. Market Analysis, Insights and Forecast - by Instrument
- 7.1.1. Transmitter
- 7.1.2. Control Valve
- 7.2. Market Analysis, Insights and Forecast - by Technology
- 7.2.1. Programmable Logic Controller (PLC)
- 7.2.2. Distributed Control System (DCS)
- 7.2.3. Supervisory Control and Data Acquisition (SCADA)
- 7.2.4. Manufacturing Execution System (MES)
- 7.3. Market Analysis, Insights and Forecast - by End-User
- 7.3.1. Water and Wastewater Treatment
- 7.3.2. Chemical Manufacturing
- 7.3.3. Energy & Utilities
- 7.3.4. Oil and Gas Extraction
- 7.3.5. Metals and Mining
- 7.3.6. Other Process Industries
- 7.1. Market Analysis, Insights and Forecast - by Instrument
- 8. Asia Pacific Industrial Process Instrumentation Industry Analysis, Insights and Forecast, 2019-2031
- 8.1. Market Analysis, Insights and Forecast - by Instrument
- 8.1.1. Transmitter
- 8.1.2. Control Valve
- 8.2. Market Analysis, Insights and Forecast - by Technology
- 8.2.1. Programmable Logic Controller (PLC)
- 8.2.2. Distributed Control System (DCS)
- 8.2.3. Supervisory Control and Data Acquisition (SCADA)
- 8.2.4. Manufacturing Execution System (MES)
- 8.3. Market Analysis, Insights and Forecast - by End-User
- 8.3.1. Water and Wastewater Treatment
- 8.3.2. Chemical Manufacturing
- 8.3.3. Energy & Utilities
- 8.3.4. Oil and Gas Extraction
- 8.3.5. Metals and Mining
- 8.3.6. Other Process Industries
- 8.1. Market Analysis, Insights and Forecast - by Instrument
- 9. Rest of the World Industrial Process Instrumentation Industry Analysis, Insights and Forecast, 2019-2031
- 9.1. Market Analysis, Insights and Forecast - by Instrument
- 9.1.1. Transmitter
- 9.1.2. Control Valve
- 9.2. Market Analysis, Insights and Forecast - by Technology
- 9.2.1. Programmable Logic Controller (PLC)
- 9.2.2. Distributed Control System (DCS)
- 9.2.3. Supervisory Control and Data Acquisition (SCADA)
- 9.2.4. Manufacturing Execution System (MES)
- 9.3. Market Analysis, Insights and Forecast - by End-User
- 9.3.1. Water and Wastewater Treatment
- 9.3.2. Chemical Manufacturing
- 9.3.3. Energy & Utilities
- 9.3.4. Oil and Gas Extraction
- 9.3.5. Metals and Mining
- 9.3.6. Other Process Industries
- 9.1. Market Analysis, Insights and Forecast - by Instrument
- 10. North America Industrial Process Instrumentation Industry Analysis, Insights and Forecast, 2019-2031
- 10.1. Market Analysis, Insights and Forecast - By Country/Sub-region
- 10.1.1 United States
- 10.1.2 Canada
- 10.1.3 Mexico
- 11. Europe Industrial Process Instrumentation Industry Analysis, Insights and Forecast, 2019-2031
- 11.1. Market Analysis, Insights and Forecast - By Country/Sub-region
- 11.1.1 Germany
- 11.1.2 United Kingdom
- 11.1.3 France
- 11.1.4 Spain
- 11.1.5 Italy
- 11.1.6 Spain
- 11.1.7 Belgium
- 11.1.8 Netherland
- 11.1.9 Nordics
- 11.1.10 Rest of Europe
- 12. Asia Pacific Industrial Process Instrumentation Industry Analysis, Insights and Forecast, 2019-2031
- 12.1. Market Analysis, Insights and Forecast - By Country/Sub-region
- 12.1.1 China
- 12.1.2 Japan
- 12.1.3 India
- 12.1.4 South Korea
- 12.1.5 Southeast Asia
- 12.1.6 Australia
- 12.1.7 Indonesia
- 12.1.8 Phillipes
- 12.1.9 Singapore
- 12.1.10 Thailandc
- 12.1.11 Rest of Asia Pacific
- 13. South America Industrial Process Instrumentation Industry Analysis, Insights and Forecast, 2019-2031
- 13.1. Market Analysis, Insights and Forecast - By Country/Sub-region
- 13.1.1 Brazil
- 13.1.2 Argentina
- 13.1.3 Peru
- 13.1.4 Chile
- 13.1.5 Colombia
- 13.1.6 Ecuador
- 13.1.7 Venezuela
- 13.1.8 Rest of South America
- 14. North America Industrial Process Instrumentation Industry Analysis, Insights and Forecast, 2019-2031
- 14.1. Market Analysis, Insights and Forecast - By Country/Sub-region
- 14.1.1 United States
- 14.1.2 Canada
- 14.1.3 Mexico
- 15. MEA Industrial Process Instrumentation Industry Analysis, Insights and Forecast, 2019-2031
- 15.1. Market Analysis, Insights and Forecast - By Country/Sub-region
- 15.1.1 United Arab Emirates
- 15.1.2 Saudi Arabia
- 15.1.3 South Africa
- 15.1.4 Rest of Middle East and Africa
- 16. Competitive Analysis
- 16.1. Global Market Share Analysis 2024
- 16.2. Company Profiles
- 16.2.1 Emerson Electric Company
- 16.2.1.1. Overview
- 16.2.1.2. Products
- 16.2.1.3. SWOT Analysis
- 16.2.1.4. Recent Developments
- 16.2.1.5. Financials (Based on Availability)
- 16.2.2 Metso Corporation
- 16.2.2.1. Overview
- 16.2.2.2. Products
- 16.2.2.3. SWOT Analysis
- 16.2.2.4. Recent Developments
- 16.2.2.5. Financials (Based on Availability)
- 16.2.3 Honeywell International Inc
- 16.2.3.1. Overview
- 16.2.3.2. Products
- 16.2.3.3. SWOT Analysis
- 16.2.3.4. Recent Developments
- 16.2.3.5. Financials (Based on Availability)
- 16.2.4 ABB Ltd
- 16.2.4.1. Overview
- 16.2.4.2. Products
- 16.2.4.3. SWOT Analysis
- 16.2.4.4. Recent Developments
- 16.2.4.5. Financials (Based on Availability)
- 16.2.5 Endress+ Hauser AG *List Not Exhaustive
- 16.2.5.1. Overview
- 16.2.5.2. Products
- 16.2.5.3. SWOT Analysis
- 16.2.5.4. Recent Developments
- 16.2.5.5. Financials (Based on Availability)
- 16.2.6 Mitsubishi Electric Corporation
- 16.2.6.1. Overview
- 16.2.6.2. Products
- 16.2.6.3. SWOT Analysis
- 16.2.6.4. Recent Developments
- 16.2.6.5. Financials (Based on Availability)
- 16.2.7 Siemens AG
- 16.2.7.1. Overview
- 16.2.7.2. Products
- 16.2.7.3. SWOT Analysis
- 16.2.7.4. Recent Developments
- 16.2.7.5. Financials (Based on Availability)
- 16.2.8 Danaher Corporation
- 16.2.8.1. Overview
- 16.2.8.2. Products
- 16.2.8.3. SWOT Analysis
- 16.2.8.4. Recent Developments
- 16.2.8.5. Financials (Based on Availability)
- 16.2.9 Omron Corporation
- 16.2.9.1. Overview
- 16.2.9.2. Products
- 16.2.9.3. SWOT Analysis
- 16.2.9.4. Recent Developments
- 16.2.9.5. Financials (Based on Availability)
- 16.2.10 Rockwell Automation Inc
- 16.2.10.1. Overview
- 16.2.10.2. Products
- 16.2.10.3. SWOT Analysis
- 16.2.10.4. Recent Developments
- 16.2.10.5. Financials (Based on Availability)
- 16.2.11 Yokogawa Electric Corporation
- 16.2.11.1. Overview
- 16.2.11.2. Products
- 16.2.11.3. SWOT Analysis
- 16.2.11.4. Recent Developments
- 16.2.11.5. Financials (Based on Availability)
- 16.2.1 Emerson Electric Company
List of Figures
- Figure 1: Global Industrial Process Instrumentation Industry Revenue Breakdown (Million, %) by Region 2024 & 2032
- Figure 2: North America Industrial Process Instrumentation Industry Revenue (Million), by Country 2024 & 2032
- Figure 3: North America Industrial Process Instrumentation Industry Revenue Share (%), by Country 2024 & 2032
- Figure 4: Europe Industrial Process Instrumentation Industry Revenue (Million), by Country 2024 & 2032
- Figure 5: Europe Industrial Process Instrumentation Industry Revenue Share (%), by Country 2024 & 2032
- Figure 6: Asia Pacific Industrial Process Instrumentation Industry Revenue (Million), by Country 2024 & 2032
- Figure 7: Asia Pacific Industrial Process Instrumentation Industry Revenue Share (%), by Country 2024 & 2032
- Figure 8: South America Industrial Process Instrumentation Industry Revenue (Million), by Country 2024 & 2032
- Figure 9: South America Industrial Process Instrumentation Industry Revenue Share (%), by Country 2024 & 2032
- Figure 10: North America Industrial Process Instrumentation Industry Revenue (Million), by Country 2024 & 2032
- Figure 11: North America Industrial Process Instrumentation Industry Revenue Share (%), by Country 2024 & 2032
- Figure 12: MEA Industrial Process Instrumentation Industry Revenue (Million), by Country 2024 & 2032
- Figure 13: MEA Industrial Process Instrumentation Industry Revenue Share (%), by Country 2024 & 2032
- Figure 14: North America Industrial Process Instrumentation Industry Revenue (Million), by Instrument 2024 & 2032
- Figure 15: North America Industrial Process Instrumentation Industry Revenue Share (%), by Instrument 2024 & 2032
- Figure 16: North America Industrial Process Instrumentation Industry Revenue (Million), by Technology 2024 & 2032
- Figure 17: North America Industrial Process Instrumentation Industry Revenue Share (%), by Technology 2024 & 2032
- Figure 18: North America Industrial Process Instrumentation Industry Revenue (Million), by End-User 2024 & 2032
- Figure 19: North America Industrial Process Instrumentation Industry Revenue Share (%), by End-User 2024 & 2032
- Figure 20: North America Industrial Process Instrumentation Industry Revenue (Million), by Country 2024 & 2032
- Figure 21: North America Industrial Process Instrumentation Industry Revenue Share (%), by Country 2024 & 2032
- Figure 22: Europe Industrial Process Instrumentation Industry Revenue (Million), by Instrument 2024 & 2032
- Figure 23: Europe Industrial Process Instrumentation Industry Revenue Share (%), by Instrument 2024 & 2032
- Figure 24: Europe Industrial Process Instrumentation Industry Revenue (Million), by Technology 2024 & 2032
- Figure 25: Europe Industrial Process Instrumentation Industry Revenue Share (%), by Technology 2024 & 2032
- Figure 26: Europe Industrial Process Instrumentation Industry Revenue (Million), by End-User 2024 & 2032
- Figure 27: Europe Industrial Process Instrumentation Industry Revenue Share (%), by End-User 2024 & 2032
- Figure 28: Europe Industrial Process Instrumentation Industry Revenue (Million), by Country 2024 & 2032
- Figure 29: Europe Industrial Process Instrumentation Industry Revenue Share (%), by Country 2024 & 2032
- Figure 30: Asia Pacific Industrial Process Instrumentation Industry Revenue (Million), by Instrument 2024 & 2032
- Figure 31: Asia Pacific Industrial Process Instrumentation Industry Revenue Share (%), by Instrument 2024 & 2032
- Figure 32: Asia Pacific Industrial Process Instrumentation Industry Revenue (Million), by Technology 2024 & 2032
- Figure 33: Asia Pacific Industrial Process Instrumentation Industry Revenue Share (%), by Technology 2024 & 2032
- Figure 34: Asia Pacific Industrial Process Instrumentation Industry Revenue (Million), by End-User 2024 & 2032
- Figure 35: Asia Pacific Industrial Process Instrumentation Industry Revenue Share (%), by End-User 2024 & 2032
- Figure 36: Asia Pacific Industrial Process Instrumentation Industry Revenue (Million), by Country 2024 & 2032
- Figure 37: Asia Pacific Industrial Process Instrumentation Industry Revenue Share (%), by Country 2024 & 2032
- Figure 38: Rest of the World Industrial Process Instrumentation Industry Revenue (Million), by Instrument 2024 & 2032
- Figure 39: Rest of the World Industrial Process Instrumentation Industry Revenue Share (%), by Instrument 2024 & 2032
- Figure 40: Rest of the World Industrial Process Instrumentation Industry Revenue (Million), by Technology 2024 & 2032
- Figure 41: Rest of the World Industrial Process Instrumentation Industry Revenue Share (%), by Technology 2024 & 2032
- Figure 42: Rest of the World Industrial Process Instrumentation Industry Revenue (Million), by End-User 2024 & 2032
- Figure 43: Rest of the World Industrial Process Instrumentation Industry Revenue Share (%), by End-User 2024 & 2032
- Figure 44: Rest of the World Industrial Process Instrumentation Industry Revenue (Million), by Country 2024 & 2032
- Figure 45: Rest of the World Industrial Process Instrumentation Industry Revenue Share (%), by Country 2024 & 2032
List of Tables
- Table 1: Global Industrial Process Instrumentation Industry Revenue Million Forecast, by Region 2019 & 2032
- Table 2: Global Industrial Process Instrumentation Industry Revenue Million Forecast, by Instrument 2019 & 2032
- Table 3: Global Industrial Process Instrumentation Industry Revenue Million Forecast, by Technology 2019 & 2032
- Table 4: Global Industrial Process Instrumentation Industry Revenue Million Forecast, by End-User 2019 & 2032
- Table 5: Global Industrial Process Instrumentation Industry Revenue Million Forecast, by Region 2019 & 2032
- Table 6: Global Industrial Process Instrumentation Industry Revenue Million Forecast, by Country 2019 & 2032
- Table 7: United States Industrial Process Instrumentation Industry Revenue (Million) Forecast, by Application 2019 & 2032
- Table 8: Canada Industrial Process Instrumentation Industry Revenue (Million) Forecast, by Application 2019 & 2032
- Table 9: Mexico Industrial Process Instrumentation Industry Revenue (Million) Forecast, by Application 2019 & 2032
- Table 10: Global Industrial Process Instrumentation Industry Revenue Million Forecast, by Country 2019 & 2032
- Table 11: Germany Industrial Process Instrumentation Industry Revenue (Million) Forecast, by Application 2019 & 2032
- Table 12: United Kingdom Industrial Process Instrumentation Industry Revenue (Million) Forecast, by Application 2019 & 2032
- Table 13: France Industrial Process Instrumentation Industry Revenue (Million) Forecast, by Application 2019 & 2032
- Table 14: Spain Industrial Process Instrumentation Industry Revenue (Million) Forecast, by Application 2019 & 2032
- Table 15: Italy Industrial Process Instrumentation Industry Revenue (Million) Forecast, by Application 2019 & 2032
- Table 16: Spain Industrial Process Instrumentation Industry Revenue (Million) Forecast, by Application 2019 & 2032
- Table 17: Belgium Industrial Process Instrumentation Industry Revenue (Million) Forecast, by Application 2019 & 2032
- Table 18: Netherland Industrial Process Instrumentation Industry Revenue (Million) Forecast, by Application 2019 & 2032
- Table 19: Nordics Industrial Process Instrumentation Industry Revenue (Million) Forecast, by Application 2019 & 2032
- Table 20: Rest of Europe Industrial Process Instrumentation Industry Revenue (Million) Forecast, by Application 2019 & 2032
- Table 21: Global Industrial Process Instrumentation Industry Revenue Million Forecast, by Country 2019 & 2032
- Table 22: China Industrial Process Instrumentation Industry Revenue (Million) Forecast, by Application 2019 & 2032
- Table 23: Japan Industrial Process Instrumentation Industry Revenue (Million) Forecast, by Application 2019 & 2032
- Table 24: India Industrial Process Instrumentation Industry Revenue (Million) Forecast, by Application 2019 & 2032
- Table 25: South Korea Industrial Process Instrumentation Industry Revenue (Million) Forecast, by Application 2019 & 2032
- Table 26: Southeast Asia Industrial Process Instrumentation Industry Revenue (Million) Forecast, by Application 2019 & 2032
- Table 27: Australia Industrial Process Instrumentation Industry Revenue (Million) Forecast, by Application 2019 & 2032
- Table 28: Indonesia Industrial Process Instrumentation Industry Revenue (Million) Forecast, by Application 2019 & 2032
- Table 29: Phillipes Industrial Process Instrumentation Industry Revenue (Million) Forecast, by Application 2019 & 2032
- Table 30: Singapore Industrial Process Instrumentation Industry Revenue (Million) Forecast, by Application 2019 & 2032
- Table 31: Thailandc Industrial Process Instrumentation Industry Revenue (Million) Forecast, by Application 2019 & 2032
- Table 32: Rest of Asia Pacific Industrial Process Instrumentation Industry Revenue (Million) Forecast, by Application 2019 & 2032
- Table 33: Global Industrial Process Instrumentation Industry Revenue Million Forecast, by Country 2019 & 2032
- Table 34: Brazil Industrial Process Instrumentation Industry Revenue (Million) Forecast, by Application 2019 & 2032
- Table 35: Argentina Industrial Process Instrumentation Industry Revenue (Million) Forecast, by Application 2019 & 2032
- Table 36: Peru Industrial Process Instrumentation Industry Revenue (Million) Forecast, by Application 2019 & 2032
- Table 37: Chile Industrial Process Instrumentation Industry Revenue (Million) Forecast, by Application 2019 & 2032
- Table 38: Colombia Industrial Process Instrumentation Industry Revenue (Million) Forecast, by Application 2019 & 2032
- Table 39: Ecuador Industrial Process Instrumentation Industry Revenue (Million) Forecast, by Application 2019 & 2032
- Table 40: Venezuela Industrial Process Instrumentation Industry Revenue (Million) Forecast, by Application 2019 & 2032
- Table 41: Rest of South America Industrial Process Instrumentation Industry Revenue (Million) Forecast, by Application 2019 & 2032
- Table 42: Global Industrial Process Instrumentation Industry Revenue Million Forecast, by Country 2019 & 2032
- Table 43: United States Industrial Process Instrumentation Industry Revenue (Million) Forecast, by Application 2019 & 2032
- Table 44: Canada Industrial Process Instrumentation Industry Revenue (Million) Forecast, by Application 2019 & 2032
- Table 45: Mexico Industrial Process Instrumentation Industry Revenue (Million) Forecast, by Application 2019 & 2032
- Table 46: Global Industrial Process Instrumentation Industry Revenue Million Forecast, by Country 2019 & 2032
- Table 47: United Arab Emirates Industrial Process Instrumentation Industry Revenue (Million) Forecast, by Application 2019 & 2032
- Table 48: Saudi Arabia Industrial Process Instrumentation Industry Revenue (Million) Forecast, by Application 2019 & 2032
- Table 49: South Africa Industrial Process Instrumentation Industry Revenue (Million) Forecast, by Application 2019 & 2032
- Table 50: Rest of Middle East and Africa Industrial Process Instrumentation Industry Revenue (Million) Forecast, by Application 2019 & 2032
- Table 51: Global Industrial Process Instrumentation Industry Revenue Million Forecast, by Instrument 2019 & 2032
- Table 52: Global Industrial Process Instrumentation Industry Revenue Million Forecast, by Technology 2019 & 2032
- Table 53: Global Industrial Process Instrumentation Industry Revenue Million Forecast, by End-User 2019 & 2032
- Table 54: Global Industrial Process Instrumentation Industry Revenue Million Forecast, by Country 2019 & 2032
- Table 55: Global Industrial Process Instrumentation Industry Revenue Million Forecast, by Instrument 2019 & 2032
- Table 56: Global Industrial Process Instrumentation Industry Revenue Million Forecast, by Technology 2019 & 2032
- Table 57: Global Industrial Process Instrumentation Industry Revenue Million Forecast, by End-User 2019 & 2032
- Table 58: Global Industrial Process Instrumentation Industry Revenue Million Forecast, by Country 2019 & 2032
- Table 59: Global Industrial Process Instrumentation Industry Revenue Million Forecast, by Instrument 2019 & 2032
- Table 60: Global Industrial Process Instrumentation Industry Revenue Million Forecast, by Technology 2019 & 2032
- Table 61: Global Industrial Process Instrumentation Industry Revenue Million Forecast, by End-User 2019 & 2032
- Table 62: Global Industrial Process Instrumentation Industry Revenue Million Forecast, by Country 2019 & 2032
- Table 63: Global Industrial Process Instrumentation Industry Revenue Million Forecast, by Instrument 2019 & 2032
- Table 64: Global Industrial Process Instrumentation Industry Revenue Million Forecast, by Technology 2019 & 2032
- Table 65: Global Industrial Process Instrumentation Industry Revenue Million Forecast, by End-User 2019 & 2032
- Table 66: Global Industrial Process Instrumentation Industry Revenue Million Forecast, by Country 2019 & 2032
Frequently Asked Questions
1. What is the projected Compound Annual Growth Rate (CAGR) of the Industrial Process Instrumentation Industry?
The projected CAGR is approximately 3.35%.
2. Which companies are prominent players in the Industrial Process Instrumentation Industry?
Key companies in the market include Emerson Electric Company, Metso Corporation, Honeywell International Inc, ABB Ltd, Endress+ Hauser AG *List Not Exhaustive, Mitsubishi Electric Corporation, Siemens AG, Danaher Corporation, Omron Corporation, Rockwell Automation Inc, Yokogawa Electric Corporation.
3. What are the main segments of the Industrial Process Instrumentation Industry?
The market segments include Instrument, Technology , End-User.
4. Can you provide details about the market size?
The market size is estimated to be USD 18.46 Million as of 2022.
5. What are some drivers contributing to market growth?
Growing demand for energy-efficient production processes; High level of efficiency with minimum cost.
6. What are the notable trends driving market growth?
Water and Wastewater Treatment is Expected to Witness the Highest Growth.
7. Are there any restraints impacting market growth?
Higher cost of research and development; Higher cost of implementation and maintenance of solutions and devices.
8. Can you provide examples of recent developments in the market?
July 2022 - Hawk Measurement Systems (HAWK), a pioneer in positioning, level, asset monitoring, and fiber optical monitoring systems, created the industry's first Guided Wave Radar Position Transmitter with Power through Ethernet communications.
9. What pricing options are available for accessing the report?
Pricing options include single-user, multi-user, and enterprise licenses priced at USD 4750, USD 5250, and USD 8750 respectively.
10. Is the market size provided in terms of value or volume?
The market size is provided in terms of value, measured in Million.
11. Are there any specific market keywords associated with the report?
Yes, the market keyword associated with the report is "Industrial Process Instrumentation Industry," which aids in identifying and referencing the specific market segment covered.
12. How do I determine which pricing option suits my needs best?
The pricing options vary based on user requirements and access needs. Individual users may opt for single-user licenses, while businesses requiring broader access may choose multi-user or enterprise licenses for cost-effective access to the report.
13. Are there any additional resources or data provided in the Industrial Process Instrumentation Industry report?
While the report offers comprehensive insights, it's advisable to review the specific contents or supplementary materials provided to ascertain if additional resources or data are available.
14. How can I stay updated on further developments or reports in the Industrial Process Instrumentation Industry?
To stay informed about further developments, trends, and reports in the Industrial Process Instrumentation Industry, consider subscribing to industry newsletters, following relevant companies and organizations, or regularly checking reputable industry news sources and publications.
Methodology
Step 1 - Identification of Relevant Samples Size from Population Database


Step 2 - Approaches for Defining Global Market Size (Value, Volume* & Price*)

Note*: In applicable scenarios
Step 3 - Data Sources
Primary Research
- Web Analytics
- Survey Reports
- Research Institute
- Latest Research Reports
- Opinion Leaders
Secondary Research
- Annual Reports
- White Paper
- Latest Press Release
- Industry Association
- Paid Database
- Investor Presentations

Step 4 - Data Triangulation
Involves using different sources of information in order to increase the validity of a study
These sources are likely to be stakeholders in a program - participants, other researchers, program staff, other community members, and so on.
Then we put all data in single framework & apply various statistical tools to find out the dynamic on the market.
During the analysis stage, feedback from the stakeholder groups would be compared to determine areas of agreement as well as areas of divergence


