
Key Insights
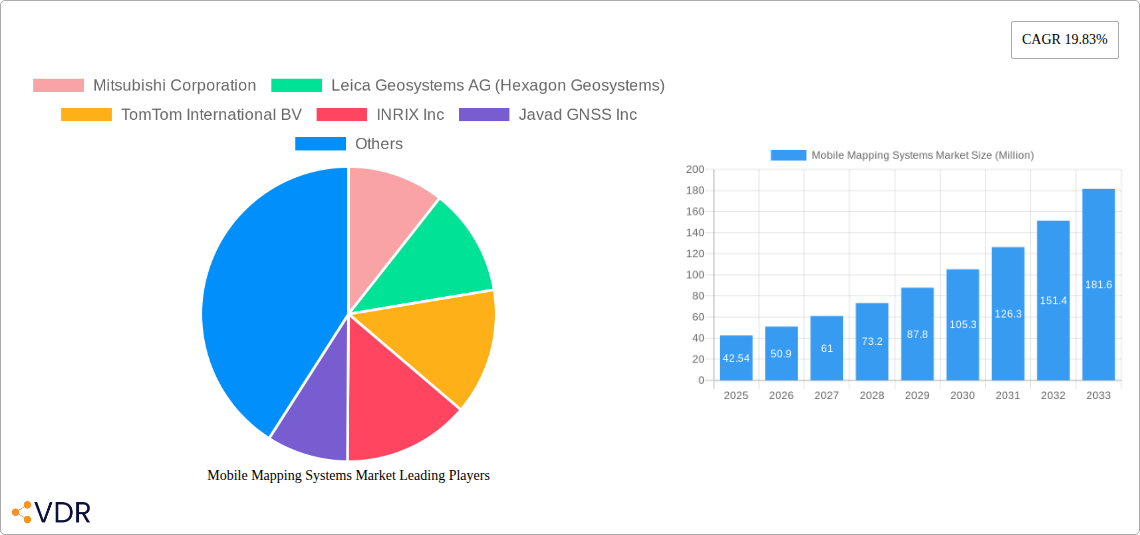
The Mobile Mapping Systems market is experiencing robust growth, projected to reach a value of $42.54 million in 2025 and expanding at a Compound Annual Growth Rate (CAGR) of 19.83% from 2025 to 2033. This significant expansion is driven by several key factors. The increasing demand for precise and efficient data acquisition across various sectors, including government infrastructure management, oil and gas exploration, and the expanding construction industry, fuels market growth. Furthermore, advancements in sensor technology, particularly in LiDAR and camera systems, are enhancing the accuracy and detail of mobile mapping data, making it an invaluable tool for numerous applications. The integration of mobile mapping systems with Geographic Information Systems (GIS) software further streamlines data analysis and visualization, boosting their adoption across different end-user verticals. The rising adoption of cloud-based solutions for data storage and processing also contributes to market expansion by offering enhanced accessibility and scalability. Finally, the increasing focus on smart city initiatives and infrastructure development globally necessitates high-quality mapping data, providing substantial impetus to the growth of this market.
Competitive pressures among established players like Leica Geosystems AG, Trimble Inc., and Topcon Corporation, alongside the emergence of innovative solutions from companies such as Google LLC and TomTom International BV, are shaping the market landscape. While North America currently holds a significant market share due to early adoption and technological advancements, the Asia-Pacific region is poised for rapid growth owing to increasing infrastructure development and investment in advanced technologies. This expansion is further supported by government initiatives promoting digitalization and smart city development in many Asia-Pacific countries. However, high initial investment costs associated with acquiring and maintaining mobile mapping systems and the need for skilled personnel to operate and interpret the data pose challenges to market penetration, particularly in developing economies. Despite these challenges, the overall market outlook for mobile mapping systems remains extremely positive, with substantial growth anticipated across various geographic regions and applications in the coming years.
Mobile Mapping Systems Market: A Comprehensive Report (2019-2033)
This in-depth report provides a comprehensive analysis of the Mobile Mapping Systems market, encompassing market dynamics, growth trends, regional dominance, product landscape, key players, and future outlook. The study period covers 2019-2033, with a base year of 2025 and a forecast period of 2025-2033. The market is segmented by application (Imaging Services, Aerial Mobile Mapping, Emergency Response Planning, Internet Applications, Facility Management, Satellite) and end-user verticals (Government, Oil and Gas, Mining, Military, Other End-user Verticals). The global market size is projected to reach xx Million units by 2033.
Mobile Mapping Systems Market Market Dynamics & Structure
The Mobile Mapping Systems market is characterized by moderate concentration, with key players holding significant market share. Technological innovation, particularly in GNSS technology and sensor integration, is a primary growth driver. Stringent regulatory frameworks related to data privacy and accuracy influence market dynamics. Competitive product substitutes, such as traditional surveying methods, pose a challenge, but the increasing demand for precise and efficient data collection is driving market expansion. The market witnesses frequent mergers and acquisitions (M&A) activities, reflecting consolidation and technological advancements.
- Market Concentration: Moderate, with top 5 players holding approximately xx% market share in 2025.
- Technological Innovation: Advancements in LiDAR, IMU, and GNSS technologies are key drivers.
- Regulatory Landscape: Data privacy regulations and accuracy standards influence market growth.
- Competitive Substitutes: Traditional surveying methods represent a competitive challenge.
- M&A Activity: Significant M&A activity is observed, reflecting industry consolidation (xx deals in 2024).
- End-User Demographics: Growing demand from Government and Oil & Gas sectors.
Mobile Mapping Systems Market Growth Trends & Insights
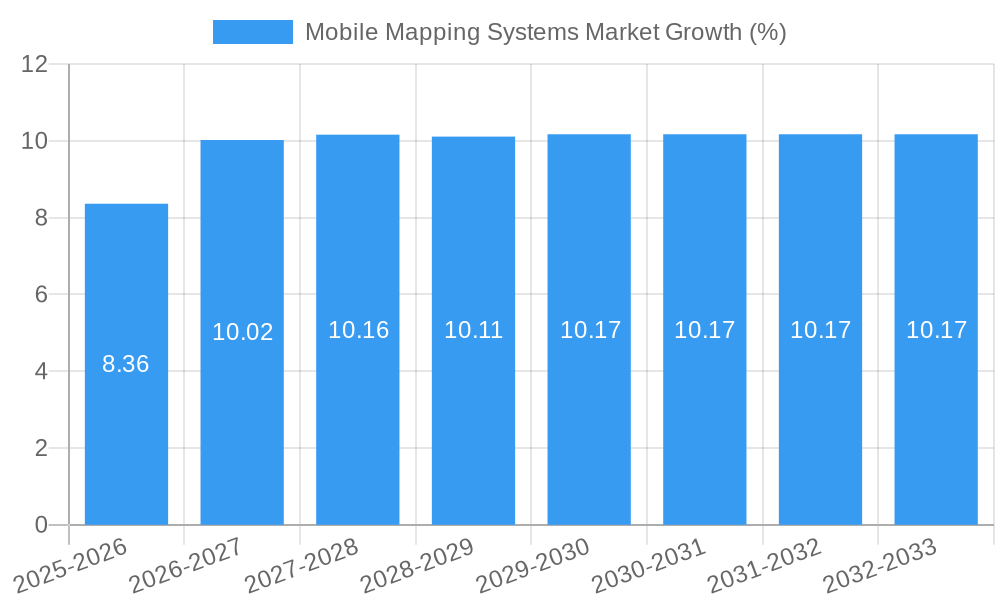
The Mobile Mapping Systems market has exhibited steady growth during the historical period (2019-2024), driven by increasing adoption across various sectors. The market size is estimated at xx Million units in 2025, with a projected CAGR of xx% during the forecast period (2025-2033). Technological disruptions, such as the integration of AI and machine learning for data processing, are accelerating market growth. Shifts in consumer behavior towards data-driven decision-making further enhance market adoption. The penetration rate of mobile mapping systems is expected to increase from xx% in 2025 to xx% by 2033.
Dominant Regions, Countries, or Segments in Mobile Mapping Systems Market
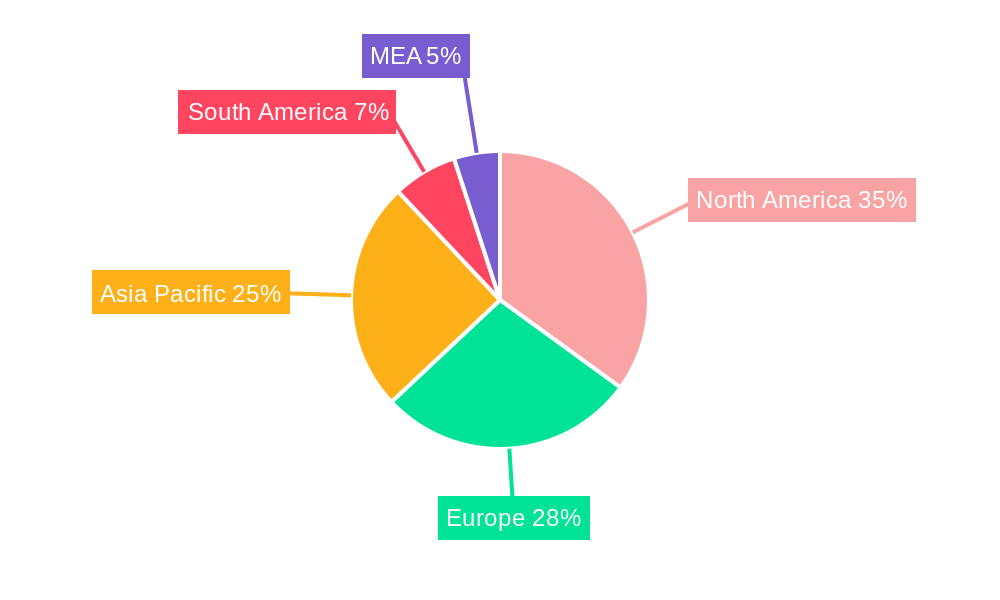
The North American region currently holds the largest market share in the Mobile Mapping Systems market, driven by robust infrastructure development and high technology adoption rates. However, the Asia-Pacific region is expected to witness the fastest growth during the forecast period due to rapid urbanization and infrastructure investments.
- By Application: Imaging Services and Aerial Mobile Mapping dominate the market, accounting for xx% of total revenue.
- By End-user Vertical: Government and Oil & Gas are the leading end-user segments.
- Key Regional Drivers:
- North America: Strong infrastructure spending and technology adoption.
- Asia-Pacific: Rapid urbanization and infrastructure development.
- Europe: Growing investments in smart city initiatives.
Mobile Mapping Systems Market Product Landscape
The mobile mapping systems market offers a range of products, including LiDAR-based systems, camera-based systems, and integrated systems incorporating multiple sensors. These systems are designed for various applications, from creating high-resolution 3D models to mapping infrastructure. Technological advancements focus on improving accuracy, increasing data processing speed, and enhancing data visualization capabilities. Unique selling propositions include real-time data acquisition, enhanced data accuracy and automation of data processing.
Key Drivers, Barriers & Challenges in Mobile Mapping Systems Market
Key Drivers:
- Increasing demand for precise geospatial data across various industries.
- Technological advancements leading to improved accuracy and efficiency.
- Growing investments in infrastructure development and smart city initiatives.
Key Challenges:
- High initial investment costs for advanced systems.
- Data processing complexities and the need for skilled professionals.
- Potential for data security breaches and privacy concerns. The impact of these challenges is estimated to reduce market growth by approximately xx% by 2033.
Emerging Opportunities in Mobile Mapping Systems Market
Emerging opportunities include the integration of mobile mapping systems with autonomous vehicles, expanding applications in agriculture and environmental monitoring, and the development of cost-effective solutions for small and medium-sized enterprises. The untapped potential in developing economies represents a significant growth avenue.
Growth Accelerators in the Mobile Mapping Systems Market Industry
Technological breakthroughs in sensor technology, AI-powered data processing, and cloud-based data storage are significant catalysts. Strategic partnerships between technology providers and end-users accelerate market expansion. Expansion into new applications and markets, particularly in developing countries, will further fuel growth.
Key Players Shaping the Mobile Mapping Systems Market Market
- Mitsubishi Corporation
- Leica Geosystems AG (Hexagon Geosystems)
- TomTom International BV
- INRIX Inc
- Javad GNSS Inc
- Teledyne Optech
- Cyclomedia Technology BV
- Imajing SAS
- Google LLC (Alphabet Inc)
- NovAtel Inc
- Trimble Inc
- Topcon Corporation
Notable Milestones in Mobile Mapping Systems Market Sector
- October 2022: Javad GNSS Inc. announced innovative GNSS products, enhancing the accuracy and efficiency of mobile mapping systems. This contributed to increased market competition and innovation.
- November 2022: Topcon's investment in TU Dublin's construction program fosters a skilled workforce, potentially boosting long-term market growth by improving the quality of professionals working with mobile mapping technologies.
In-Depth Mobile Mapping Systems Market Market Outlook
The Mobile Mapping Systems market is poised for significant growth, driven by ongoing technological advancements, increasing demand for precise geospatial data, and expansion into new applications. Strategic partnerships and investments in research and development will further enhance market potential, creating lucrative opportunities for industry players. The market is expected to experience strong growth in the coming years, driven by increased adoption across various sectors and continuous innovation.
Mobile Mapping Systems Market Segmentation
-
1. Application
- 1.1. Imaging Services
- 1.2. Aerial Mobile Mapping
- 1.3. Emergency Response Planning
- 1.4. Internet Applications
- 1.5. Facility Management
- 1.6. Satellite
-
2. End-user Verticals
- 2.1. Government
- 2.2. Oil and Gas
- 2.3. Mining
- 2.4. Military
- 2.5. Other End-user Verticals
Mobile Mapping Systems Market Segmentation By Geography
- 1. North America
- 2. Europe
- 3. Asia Pacific
- 4. Latin America
- 5. Middle East and Africa
Mobile Mapping Systems Market REPORT HIGHLIGHTS
| Aspects | Details |
|---|---|
| Study Period | 2019-2033 |
| Base Year | 2024 |
| Estimated Year | 2025 |
| Forecast Period | 2025-2033 |
| Historical Period | 2019-2024 |
| Growth Rate | CAGR of 19.83% from 2019-2033 |
| Segmentation |
|
Table of Contents
- 1. Introduction
- 1.1. Research Scope
- 1.2. Market Segmentation
- 1.3. Research Methodology
- 1.4. Definitions and Assumptions
- 2. Executive Summary
- 2.1. Introduction
- 3. Market Dynamics
- 3.1. Introduction
- 3.2. Market Drivers
- 3.2.1. Integration with All Kinds of Vehicles
- 3.3. Market Restrains
- 3.3.1. High Cost of System Acquisition and Deployment
- 3.4. Market Trends
- 3.4.1. Imaging Services Segment to Dominate the Market
- 4. Market Factor Analysis
- 4.1. Porters Five Forces
- 4.2. Supply/Value Chain
- 4.3. PESTEL analysis
- 4.4. Market Entropy
- 4.5. Patent/Trademark Analysis
- 5. Global Mobile Mapping Systems Market Analysis, Insights and Forecast, 2019-2031
- 5.1. Market Analysis, Insights and Forecast - by Application
- 5.1.1. Imaging Services
- 5.1.2. Aerial Mobile Mapping
- 5.1.3. Emergency Response Planning
- 5.1.4. Internet Applications
- 5.1.5. Facility Management
- 5.1.6. Satellite
- 5.2. Market Analysis, Insights and Forecast - by End-user Verticals
- 5.2.1. Government
- 5.2.2. Oil and Gas
- 5.2.3. Mining
- 5.2.4. Military
- 5.2.5. Other End-user Verticals
- 5.3. Market Analysis, Insights and Forecast - by Region
- 5.3.1. North America
- 5.3.2. Europe
- 5.3.3. Asia Pacific
- 5.3.4. Latin America
- 5.3.5. Middle East and Africa
- 5.1. Market Analysis, Insights and Forecast - by Application
- 6. North America Mobile Mapping Systems Market Analysis, Insights and Forecast, 2019-2031
- 6.1. Market Analysis, Insights and Forecast - by Application
- 6.1.1. Imaging Services
- 6.1.2. Aerial Mobile Mapping
- 6.1.3. Emergency Response Planning
- 6.1.4. Internet Applications
- 6.1.5. Facility Management
- 6.1.6. Satellite
- 6.2. Market Analysis, Insights and Forecast - by End-user Verticals
- 6.2.1. Government
- 6.2.2. Oil and Gas
- 6.2.3. Mining
- 6.2.4. Military
- 6.2.5. Other End-user Verticals
- 6.1. Market Analysis, Insights and Forecast - by Application
- 7. Europe Mobile Mapping Systems Market Analysis, Insights and Forecast, 2019-2031
- 7.1. Market Analysis, Insights and Forecast - by Application
- 7.1.1. Imaging Services
- 7.1.2. Aerial Mobile Mapping
- 7.1.3. Emergency Response Planning
- 7.1.4. Internet Applications
- 7.1.5. Facility Management
- 7.1.6. Satellite
- 7.2. Market Analysis, Insights and Forecast - by End-user Verticals
- 7.2.1. Government
- 7.2.2. Oil and Gas
- 7.2.3. Mining
- 7.2.4. Military
- 7.2.5. Other End-user Verticals
- 7.1. Market Analysis, Insights and Forecast - by Application
- 8. Asia Pacific Mobile Mapping Systems Market Analysis, Insights and Forecast, 2019-2031
- 8.1. Market Analysis, Insights and Forecast - by Application
- 8.1.1. Imaging Services
- 8.1.2. Aerial Mobile Mapping
- 8.1.3. Emergency Response Planning
- 8.1.4. Internet Applications
- 8.1.5. Facility Management
- 8.1.6. Satellite
- 8.2. Market Analysis, Insights and Forecast - by End-user Verticals
- 8.2.1. Government
- 8.2.2. Oil and Gas
- 8.2.3. Mining
- 8.2.4. Military
- 8.2.5. Other End-user Verticals
- 8.1. Market Analysis, Insights and Forecast - by Application
- 9. Latin America Mobile Mapping Systems Market Analysis, Insights and Forecast, 2019-2031
- 9.1. Market Analysis, Insights and Forecast - by Application
- 9.1.1. Imaging Services
- 9.1.2. Aerial Mobile Mapping
- 9.1.3. Emergency Response Planning
- 9.1.4. Internet Applications
- 9.1.5. Facility Management
- 9.1.6. Satellite
- 9.2. Market Analysis, Insights and Forecast - by End-user Verticals
- 9.2.1. Government
- 9.2.2. Oil and Gas
- 9.2.3. Mining
- 9.2.4. Military
- 9.2.5. Other End-user Verticals
- 9.1. Market Analysis, Insights and Forecast - by Application
- 10. Middle East and Africa Mobile Mapping Systems Market Analysis, Insights and Forecast, 2019-2031
- 10.1. Market Analysis, Insights and Forecast - by Application
- 10.1.1. Imaging Services
- 10.1.2. Aerial Mobile Mapping
- 10.1.3. Emergency Response Planning
- 10.1.4. Internet Applications
- 10.1.5. Facility Management
- 10.1.6. Satellite
- 10.2. Market Analysis, Insights and Forecast - by End-user Verticals
- 10.2.1. Government
- 10.2.2. Oil and Gas
- 10.2.3. Mining
- 10.2.4. Military
- 10.2.5. Other End-user Verticals
- 10.1. Market Analysis, Insights and Forecast - by Application
- 11. North America Mobile Mapping Systems Market Analysis, Insights and Forecast, 2019-2031
- 11.1. Market Analysis, Insights and Forecast - By Country/Sub-region
- 11.1.1 United States
- 11.1.2 Canada
- 11.1.3 Mexico
- 12. Europe Mobile Mapping Systems Market Analysis, Insights and Forecast, 2019-2031
- 12.1. Market Analysis, Insights and Forecast - By Country/Sub-region
- 12.1.1 Germany
- 12.1.2 United Kingdom
- 12.1.3 France
- 12.1.4 Spain
- 12.1.5 Italy
- 12.1.6 Spain
- 12.1.7 Belgium
- 12.1.8 Netherland
- 12.1.9 Nordics
- 12.1.10 Rest of Europe
- 13. Asia Pacific Mobile Mapping Systems Market Analysis, Insights and Forecast, 2019-2031
- 13.1. Market Analysis, Insights and Forecast - By Country/Sub-region
- 13.1.1 China
- 13.1.2 Japan
- 13.1.3 India
- 13.1.4 South Korea
- 13.1.5 Southeast Asia
- 13.1.6 Australia
- 13.1.7 Indonesia
- 13.1.8 Phillipes
- 13.1.9 Singapore
- 13.1.10 Thailandc
- 13.1.11 Rest of Asia Pacific
- 14. South America Mobile Mapping Systems Market Analysis, Insights and Forecast, 2019-2031
- 14.1. Market Analysis, Insights and Forecast - By Country/Sub-region
- 14.1.1 Brazil
- 14.1.2 Argentina
- 14.1.3 Peru
- 14.1.4 Chile
- 14.1.5 Colombia
- 14.1.6 Ecuador
- 14.1.7 Venezuela
- 14.1.8 Rest of South America
- 15. North America Mobile Mapping Systems Market Analysis, Insights and Forecast, 2019-2031
- 15.1. Market Analysis, Insights and Forecast - By Country/Sub-region
- 15.1.1 United States
- 15.1.2 Canada
- 15.1.3 Mexico
- 16. MEA Mobile Mapping Systems Market Analysis, Insights and Forecast, 2019-2031
- 16.1. Market Analysis, Insights and Forecast - By Country/Sub-region
- 16.1.1 United Arab Emirates
- 16.1.2 Saudi Arabia
- 16.1.3 South Africa
- 16.1.4 Rest of Middle East and Africa
- 17. Competitive Analysis
- 17.1. Global Market Share Analysis 2024
- 17.2. Company Profiles
- 17.2.1 Mitsubishi Corporation
- 17.2.1.1. Overview
- 17.2.1.2. Products
- 17.2.1.3. SWOT Analysis
- 17.2.1.4. Recent Developments
- 17.2.1.5. Financials (Based on Availability)
- 17.2.2 Leica Geosystems AG (Hexagon Geosystems)
- 17.2.2.1. Overview
- 17.2.2.2. Products
- 17.2.2.3. SWOT Analysis
- 17.2.2.4. Recent Developments
- 17.2.2.5. Financials (Based on Availability)
- 17.2.3 TomTom International BV
- 17.2.3.1. Overview
- 17.2.3.2. Products
- 17.2.3.3. SWOT Analysis
- 17.2.3.4. Recent Developments
- 17.2.3.5. Financials (Based on Availability)
- 17.2.4 INRIX Inc
- 17.2.4.1. Overview
- 17.2.4.2. Products
- 17.2.4.3. SWOT Analysis
- 17.2.4.4. Recent Developments
- 17.2.4.5. Financials (Based on Availability)
- 17.2.5 Javad GNSS Inc
- 17.2.5.1. Overview
- 17.2.5.2. Products
- 17.2.5.3. SWOT Analysis
- 17.2.5.4. Recent Developments
- 17.2.5.5. Financials (Based on Availability)
- 17.2.6 Teledyne Optech
- 17.2.6.1. Overview
- 17.2.6.2. Products
- 17.2.6.3. SWOT Analysis
- 17.2.6.4. Recent Developments
- 17.2.6.5. Financials (Based on Availability)
- 17.2.7 Cyclomedia Technology BV
- 17.2.7.1. Overview
- 17.2.7.2. Products
- 17.2.7.3. SWOT Analysis
- 17.2.7.4. Recent Developments
- 17.2.7.5. Financials (Based on Availability)
- 17.2.8 Imajing SAS
- 17.2.8.1. Overview
- 17.2.8.2. Products
- 17.2.8.3. SWOT Analysis
- 17.2.8.4. Recent Developments
- 17.2.8.5. Financials (Based on Availability)
- 17.2.9 Google LLC (Alphabet Inc )
- 17.2.9.1. Overview
- 17.2.9.2. Products
- 17.2.9.3. SWOT Analysis
- 17.2.9.4. Recent Developments
- 17.2.9.5. Financials (Based on Availability)
- 17.2.10 NovAtel Inc
- 17.2.10.1. Overview
- 17.2.10.2. Products
- 17.2.10.3. SWOT Analysis
- 17.2.10.4. Recent Developments
- 17.2.10.5. Financials (Based on Availability)
- 17.2.11 Trimble Inc
- 17.2.11.1. Overview
- 17.2.11.2. Products
- 17.2.11.3. SWOT Analysis
- 17.2.11.4. Recent Developments
- 17.2.11.5. Financials (Based on Availability)
- 17.2.12 Topcon Corporation
- 17.2.12.1. Overview
- 17.2.12.2. Products
- 17.2.12.3. SWOT Analysis
- 17.2.12.4. Recent Developments
- 17.2.12.5. Financials (Based on Availability)
- 17.2.1 Mitsubishi Corporation
List of Figures
- Figure 1: Global Mobile Mapping Systems Market Revenue Breakdown (Million, %) by Region 2024 & 2032
- Figure 2: Global Mobile Mapping Systems Market Volume Breakdown (K Unit, %) by Region 2024 & 2032
- Figure 3: North America Mobile Mapping Systems Market Revenue (Million), by Country 2024 & 2032
- Figure 4: North America Mobile Mapping Systems Market Volume (K Unit), by Country 2024 & 2032
- Figure 5: North America Mobile Mapping Systems Market Revenue Share (%), by Country 2024 & 2032
- Figure 6: North America Mobile Mapping Systems Market Volume Share (%), by Country 2024 & 2032
- Figure 7: Europe Mobile Mapping Systems Market Revenue (Million), by Country 2024 & 2032
- Figure 8: Europe Mobile Mapping Systems Market Volume (K Unit), by Country 2024 & 2032
- Figure 9: Europe Mobile Mapping Systems Market Revenue Share (%), by Country 2024 & 2032
- Figure 10: Europe Mobile Mapping Systems Market Volume Share (%), by Country 2024 & 2032
- Figure 11: Asia Pacific Mobile Mapping Systems Market Revenue (Million), by Country 2024 & 2032
- Figure 12: Asia Pacific Mobile Mapping Systems Market Volume (K Unit), by Country 2024 & 2032
- Figure 13: Asia Pacific Mobile Mapping Systems Market Revenue Share (%), by Country 2024 & 2032
- Figure 14: Asia Pacific Mobile Mapping Systems Market Volume Share (%), by Country 2024 & 2032
- Figure 15: South America Mobile Mapping Systems Market Revenue (Million), by Country 2024 & 2032
- Figure 16: South America Mobile Mapping Systems Market Volume (K Unit), by Country 2024 & 2032
- Figure 17: South America Mobile Mapping Systems Market Revenue Share (%), by Country 2024 & 2032
- Figure 18: South America Mobile Mapping Systems Market Volume Share (%), by Country 2024 & 2032
- Figure 19: North America Mobile Mapping Systems Market Revenue (Million), by Country 2024 & 2032
- Figure 20: North America Mobile Mapping Systems Market Volume (K Unit), by Country 2024 & 2032
- Figure 21: North America Mobile Mapping Systems Market Revenue Share (%), by Country 2024 & 2032
- Figure 22: North America Mobile Mapping Systems Market Volume Share (%), by Country 2024 & 2032
- Figure 23: MEA Mobile Mapping Systems Market Revenue (Million), by Country 2024 & 2032
- Figure 24: MEA Mobile Mapping Systems Market Volume (K Unit), by Country 2024 & 2032
- Figure 25: MEA Mobile Mapping Systems Market Revenue Share (%), by Country 2024 & 2032
- Figure 26: MEA Mobile Mapping Systems Market Volume Share (%), by Country 2024 & 2032
- Figure 27: North America Mobile Mapping Systems Market Revenue (Million), by Application 2024 & 2032
- Figure 28: North America Mobile Mapping Systems Market Volume (K Unit), by Application 2024 & 2032
- Figure 29: North America Mobile Mapping Systems Market Revenue Share (%), by Application 2024 & 2032
- Figure 30: North America Mobile Mapping Systems Market Volume Share (%), by Application 2024 & 2032
- Figure 31: North America Mobile Mapping Systems Market Revenue (Million), by End-user Verticals 2024 & 2032
- Figure 32: North America Mobile Mapping Systems Market Volume (K Unit), by End-user Verticals 2024 & 2032
- Figure 33: North America Mobile Mapping Systems Market Revenue Share (%), by End-user Verticals 2024 & 2032
- Figure 34: North America Mobile Mapping Systems Market Volume Share (%), by End-user Verticals 2024 & 2032
- Figure 35: North America Mobile Mapping Systems Market Revenue (Million), by Country 2024 & 2032
- Figure 36: North America Mobile Mapping Systems Market Volume (K Unit), by Country 2024 & 2032
- Figure 37: North America Mobile Mapping Systems Market Revenue Share (%), by Country 2024 & 2032
- Figure 38: North America Mobile Mapping Systems Market Volume Share (%), by Country 2024 & 2032
- Figure 39: Europe Mobile Mapping Systems Market Revenue (Million), by Application 2024 & 2032
- Figure 40: Europe Mobile Mapping Systems Market Volume (K Unit), by Application 2024 & 2032
- Figure 41: Europe Mobile Mapping Systems Market Revenue Share (%), by Application 2024 & 2032
- Figure 42: Europe Mobile Mapping Systems Market Volume Share (%), by Application 2024 & 2032
- Figure 43: Europe Mobile Mapping Systems Market Revenue (Million), by End-user Verticals 2024 & 2032
- Figure 44: Europe Mobile Mapping Systems Market Volume (K Unit), by End-user Verticals 2024 & 2032
- Figure 45: Europe Mobile Mapping Systems Market Revenue Share (%), by End-user Verticals 2024 & 2032
- Figure 46: Europe Mobile Mapping Systems Market Volume Share (%), by End-user Verticals 2024 & 2032
- Figure 47: Europe Mobile Mapping Systems Market Revenue (Million), by Country 2024 & 2032
- Figure 48: Europe Mobile Mapping Systems Market Volume (K Unit), by Country 2024 & 2032
- Figure 49: Europe Mobile Mapping Systems Market Revenue Share (%), by Country 2024 & 2032
- Figure 50: Europe Mobile Mapping Systems Market Volume Share (%), by Country 2024 & 2032
- Figure 51: Asia Pacific Mobile Mapping Systems Market Revenue (Million), by Application 2024 & 2032
- Figure 52: Asia Pacific Mobile Mapping Systems Market Volume (K Unit), by Application 2024 & 2032
- Figure 53: Asia Pacific Mobile Mapping Systems Market Revenue Share (%), by Application 2024 & 2032
- Figure 54: Asia Pacific Mobile Mapping Systems Market Volume Share (%), by Application 2024 & 2032
- Figure 55: Asia Pacific Mobile Mapping Systems Market Revenue (Million), by End-user Verticals 2024 & 2032
- Figure 56: Asia Pacific Mobile Mapping Systems Market Volume (K Unit), by End-user Verticals 2024 & 2032
- Figure 57: Asia Pacific Mobile Mapping Systems Market Revenue Share (%), by End-user Verticals 2024 & 2032
- Figure 58: Asia Pacific Mobile Mapping Systems Market Volume Share (%), by End-user Verticals 2024 & 2032
- Figure 59: Asia Pacific Mobile Mapping Systems Market Revenue (Million), by Country 2024 & 2032
- Figure 60: Asia Pacific Mobile Mapping Systems Market Volume (K Unit), by Country 2024 & 2032
- Figure 61: Asia Pacific Mobile Mapping Systems Market Revenue Share (%), by Country 2024 & 2032
- Figure 62: Asia Pacific Mobile Mapping Systems Market Volume Share (%), by Country 2024 & 2032
- Figure 63: Latin America Mobile Mapping Systems Market Revenue (Million), by Application 2024 & 2032
- Figure 64: Latin America Mobile Mapping Systems Market Volume (K Unit), by Application 2024 & 2032
- Figure 65: Latin America Mobile Mapping Systems Market Revenue Share (%), by Application 2024 & 2032
- Figure 66: Latin America Mobile Mapping Systems Market Volume Share (%), by Application 2024 & 2032
- Figure 67: Latin America Mobile Mapping Systems Market Revenue (Million), by End-user Verticals 2024 & 2032
- Figure 68: Latin America Mobile Mapping Systems Market Volume (K Unit), by End-user Verticals 2024 & 2032
- Figure 69: Latin America Mobile Mapping Systems Market Revenue Share (%), by End-user Verticals 2024 & 2032
- Figure 70: Latin America Mobile Mapping Systems Market Volume Share (%), by End-user Verticals 2024 & 2032
- Figure 71: Latin America Mobile Mapping Systems Market Revenue (Million), by Country 2024 & 2032
- Figure 72: Latin America Mobile Mapping Systems Market Volume (K Unit), by Country 2024 & 2032
- Figure 73: Latin America Mobile Mapping Systems Market Revenue Share (%), by Country 2024 & 2032
- Figure 74: Latin America Mobile Mapping Systems Market Volume Share (%), by Country 2024 & 2032
- Figure 75: Middle East and Africa Mobile Mapping Systems Market Revenue (Million), by Application 2024 & 2032
- Figure 76: Middle East and Africa Mobile Mapping Systems Market Volume (K Unit), by Application 2024 & 2032
- Figure 77: Middle East and Africa Mobile Mapping Systems Market Revenue Share (%), by Application 2024 & 2032
- Figure 78: Middle East and Africa Mobile Mapping Systems Market Volume Share (%), by Application 2024 & 2032
- Figure 79: Middle East and Africa Mobile Mapping Systems Market Revenue (Million), by End-user Verticals 2024 & 2032
- Figure 80: Middle East and Africa Mobile Mapping Systems Market Volume (K Unit), by End-user Verticals 2024 & 2032
- Figure 81: Middle East and Africa Mobile Mapping Systems Market Revenue Share (%), by End-user Verticals 2024 & 2032
- Figure 82: Middle East and Africa Mobile Mapping Systems Market Volume Share (%), by End-user Verticals 2024 & 2032
- Figure 83: Middle East and Africa Mobile Mapping Systems Market Revenue (Million), by Country 2024 & 2032
- Figure 84: Middle East and Africa Mobile Mapping Systems Market Volume (K Unit), by Country 2024 & 2032
- Figure 85: Middle East and Africa Mobile Mapping Systems Market Revenue Share (%), by Country 2024 & 2032
- Figure 86: Middle East and Africa Mobile Mapping Systems Market Volume Share (%), by Country 2024 & 2032
List of Tables
- Table 1: Global Mobile Mapping Systems Market Revenue Million Forecast, by Region 2019 & 2032
- Table 2: Global Mobile Mapping Systems Market Volume K Unit Forecast, by Region 2019 & 2032
- Table 3: Global Mobile Mapping Systems Market Revenue Million Forecast, by Application 2019 & 2032
- Table 4: Global Mobile Mapping Systems Market Volume K Unit Forecast, by Application 2019 & 2032
- Table 5: Global Mobile Mapping Systems Market Revenue Million Forecast, by End-user Verticals 2019 & 2032
- Table 6: Global Mobile Mapping Systems Market Volume K Unit Forecast, by End-user Verticals 2019 & 2032
- Table 7: Global Mobile Mapping Systems Market Revenue Million Forecast, by Region 2019 & 2032
- Table 8: Global Mobile Mapping Systems Market Volume K Unit Forecast, by Region 2019 & 2032
- Table 9: Global Mobile Mapping Systems Market Revenue Million Forecast, by Country 2019 & 2032
- Table 10: Global Mobile Mapping Systems Market Volume K Unit Forecast, by Country 2019 & 2032
- Table 11: United States Mobile Mapping Systems Market Revenue (Million) Forecast, by Application 2019 & 2032
- Table 12: United States Mobile Mapping Systems Market Volume (K Unit) Forecast, by Application 2019 & 2032
- Table 13: Canada Mobile Mapping Systems Market Revenue (Million) Forecast, by Application 2019 & 2032
- Table 14: Canada Mobile Mapping Systems Market Volume (K Unit) Forecast, by Application 2019 & 2032
- Table 15: Mexico Mobile Mapping Systems Market Revenue (Million) Forecast, by Application 2019 & 2032
- Table 16: Mexico Mobile Mapping Systems Market Volume (K Unit) Forecast, by Application 2019 & 2032
- Table 17: Global Mobile Mapping Systems Market Revenue Million Forecast, by Country 2019 & 2032
- Table 18: Global Mobile Mapping Systems Market Volume K Unit Forecast, by Country 2019 & 2032
- Table 19: Germany Mobile Mapping Systems Market Revenue (Million) Forecast, by Application 2019 & 2032
- Table 20: Germany Mobile Mapping Systems Market Volume (K Unit) Forecast, by Application 2019 & 2032
- Table 21: United Kingdom Mobile Mapping Systems Market Revenue (Million) Forecast, by Application 2019 & 2032
- Table 22: United Kingdom Mobile Mapping Systems Market Volume (K Unit) Forecast, by Application 2019 & 2032
- Table 23: France Mobile Mapping Systems Market Revenue (Million) Forecast, by Application 2019 & 2032
- Table 24: France Mobile Mapping Systems Market Volume (K Unit) Forecast, by Application 2019 & 2032
- Table 25: Spain Mobile Mapping Systems Market Revenue (Million) Forecast, by Application 2019 & 2032
- Table 26: Spain Mobile Mapping Systems Market Volume (K Unit) Forecast, by Application 2019 & 2032
- Table 27: Italy Mobile Mapping Systems Market Revenue (Million) Forecast, by Application 2019 & 2032
- Table 28: Italy Mobile Mapping Systems Market Volume (K Unit) Forecast, by Application 2019 & 2032
- Table 29: Spain Mobile Mapping Systems Market Revenue (Million) Forecast, by Application 2019 & 2032
- Table 30: Spain Mobile Mapping Systems Market Volume (K Unit) Forecast, by Application 2019 & 2032
- Table 31: Belgium Mobile Mapping Systems Market Revenue (Million) Forecast, by Application 2019 & 2032
- Table 32: Belgium Mobile Mapping Systems Market Volume (K Unit) Forecast, by Application 2019 & 2032
- Table 33: Netherland Mobile Mapping Systems Market Revenue (Million) Forecast, by Application 2019 & 2032
- Table 34: Netherland Mobile Mapping Systems Market Volume (K Unit) Forecast, by Application 2019 & 2032
- Table 35: Nordics Mobile Mapping Systems Market Revenue (Million) Forecast, by Application 2019 & 2032
- Table 36: Nordics Mobile Mapping Systems Market Volume (K Unit) Forecast, by Application 2019 & 2032
- Table 37: Rest of Europe Mobile Mapping Systems Market Revenue (Million) Forecast, by Application 2019 & 2032
- Table 38: Rest of Europe Mobile Mapping Systems Market Volume (K Unit) Forecast, by Application 2019 & 2032
- Table 39: Global Mobile Mapping Systems Market Revenue Million Forecast, by Country 2019 & 2032
- Table 40: Global Mobile Mapping Systems Market Volume K Unit Forecast, by Country 2019 & 2032
- Table 41: China Mobile Mapping Systems Market Revenue (Million) Forecast, by Application 2019 & 2032
- Table 42: China Mobile Mapping Systems Market Volume (K Unit) Forecast, by Application 2019 & 2032
- Table 43: Japan Mobile Mapping Systems Market Revenue (Million) Forecast, by Application 2019 & 2032
- Table 44: Japan Mobile Mapping Systems Market Volume (K Unit) Forecast, by Application 2019 & 2032
- Table 45: India Mobile Mapping Systems Market Revenue (Million) Forecast, by Application 2019 & 2032
- Table 46: India Mobile Mapping Systems Market Volume (K Unit) Forecast, by Application 2019 & 2032
- Table 47: South Korea Mobile Mapping Systems Market Revenue (Million) Forecast, by Application 2019 & 2032
- Table 48: South Korea Mobile Mapping Systems Market Volume (K Unit) Forecast, by Application 2019 & 2032
- Table 49: Southeast Asia Mobile Mapping Systems Market Revenue (Million) Forecast, by Application 2019 & 2032
- Table 50: Southeast Asia Mobile Mapping Systems Market Volume (K Unit) Forecast, by Application 2019 & 2032
- Table 51: Australia Mobile Mapping Systems Market Revenue (Million) Forecast, by Application 2019 & 2032
- Table 52: Australia Mobile Mapping Systems Market Volume (K Unit) Forecast, by Application 2019 & 2032
- Table 53: Indonesia Mobile Mapping Systems Market Revenue (Million) Forecast, by Application 2019 & 2032
- Table 54: Indonesia Mobile Mapping Systems Market Volume (K Unit) Forecast, by Application 2019 & 2032
- Table 55: Phillipes Mobile Mapping Systems Market Revenue (Million) Forecast, by Application 2019 & 2032
- Table 56: Phillipes Mobile Mapping Systems Market Volume (K Unit) Forecast, by Application 2019 & 2032
- Table 57: Singapore Mobile Mapping Systems Market Revenue (Million) Forecast, by Application 2019 & 2032
- Table 58: Singapore Mobile Mapping Systems Market Volume (K Unit) Forecast, by Application 2019 & 2032
- Table 59: Thailandc Mobile Mapping Systems Market Revenue (Million) Forecast, by Application 2019 & 2032
- Table 60: Thailandc Mobile Mapping Systems Market Volume (K Unit) Forecast, by Application 2019 & 2032
- Table 61: Rest of Asia Pacific Mobile Mapping Systems Market Revenue (Million) Forecast, by Application 2019 & 2032
- Table 62: Rest of Asia Pacific Mobile Mapping Systems Market Volume (K Unit) Forecast, by Application 2019 & 2032
- Table 63: Global Mobile Mapping Systems Market Revenue Million Forecast, by Country 2019 & 2032
- Table 64: Global Mobile Mapping Systems Market Volume K Unit Forecast, by Country 2019 & 2032
- Table 65: Brazil Mobile Mapping Systems Market Revenue (Million) Forecast, by Application 2019 & 2032
- Table 66: Brazil Mobile Mapping Systems Market Volume (K Unit) Forecast, by Application 2019 & 2032
- Table 67: Argentina Mobile Mapping Systems Market Revenue (Million) Forecast, by Application 2019 & 2032
- Table 68: Argentina Mobile Mapping Systems Market Volume (K Unit) Forecast, by Application 2019 & 2032
- Table 69: Peru Mobile Mapping Systems Market Revenue (Million) Forecast, by Application 2019 & 2032
- Table 70: Peru Mobile Mapping Systems Market Volume (K Unit) Forecast, by Application 2019 & 2032
- Table 71: Chile Mobile Mapping Systems Market Revenue (Million) Forecast, by Application 2019 & 2032
- Table 72: Chile Mobile Mapping Systems Market Volume (K Unit) Forecast, by Application 2019 & 2032
- Table 73: Colombia Mobile Mapping Systems Market Revenue (Million) Forecast, by Application 2019 & 2032
- Table 74: Colombia Mobile Mapping Systems Market Volume (K Unit) Forecast, by Application 2019 & 2032
- Table 75: Ecuador Mobile Mapping Systems Market Revenue (Million) Forecast, by Application 2019 & 2032
- Table 76: Ecuador Mobile Mapping Systems Market Volume (K Unit) Forecast, by Application 2019 & 2032
- Table 77: Venezuela Mobile Mapping Systems Market Revenue (Million) Forecast, by Application 2019 & 2032
- Table 78: Venezuela Mobile Mapping Systems Market Volume (K Unit) Forecast, by Application 2019 & 2032
- Table 79: Rest of South America Mobile Mapping Systems Market Revenue (Million) Forecast, by Application 2019 & 2032
- Table 80: Rest of South America Mobile Mapping Systems Market Volume (K Unit) Forecast, by Application 2019 & 2032
- Table 81: Global Mobile Mapping Systems Market Revenue Million Forecast, by Country 2019 & 2032
- Table 82: Global Mobile Mapping Systems Market Volume K Unit Forecast, by Country 2019 & 2032
- Table 83: United States Mobile Mapping Systems Market Revenue (Million) Forecast, by Application 2019 & 2032
- Table 84: United States Mobile Mapping Systems Market Volume (K Unit) Forecast, by Application 2019 & 2032
- Table 85: Canada Mobile Mapping Systems Market Revenue (Million) Forecast, by Application 2019 & 2032
- Table 86: Canada Mobile Mapping Systems Market Volume (K Unit) Forecast, by Application 2019 & 2032
- Table 87: Mexico Mobile Mapping Systems Market Revenue (Million) Forecast, by Application 2019 & 2032
- Table 88: Mexico Mobile Mapping Systems Market Volume (K Unit) Forecast, by Application 2019 & 2032
- Table 89: Global Mobile Mapping Systems Market Revenue Million Forecast, by Country 2019 & 2032
- Table 90: Global Mobile Mapping Systems Market Volume K Unit Forecast, by Country 2019 & 2032
- Table 91: United Arab Emirates Mobile Mapping Systems Market Revenue (Million) Forecast, by Application 2019 & 2032
- Table 92: United Arab Emirates Mobile Mapping Systems Market Volume (K Unit) Forecast, by Application 2019 & 2032
- Table 93: Saudi Arabia Mobile Mapping Systems Market Revenue (Million) Forecast, by Application 2019 & 2032
- Table 94: Saudi Arabia Mobile Mapping Systems Market Volume (K Unit) Forecast, by Application 2019 & 2032
- Table 95: South Africa Mobile Mapping Systems Market Revenue (Million) Forecast, by Application 2019 & 2032
- Table 96: South Africa Mobile Mapping Systems Market Volume (K Unit) Forecast, by Application 2019 & 2032
- Table 97: Rest of Middle East and Africa Mobile Mapping Systems Market Revenue (Million) Forecast, by Application 2019 & 2032
- Table 98: Rest of Middle East and Africa Mobile Mapping Systems Market Volume (K Unit) Forecast, by Application 2019 & 2032
- Table 99: Global Mobile Mapping Systems Market Revenue Million Forecast, by Application 2019 & 2032
- Table 100: Global Mobile Mapping Systems Market Volume K Unit Forecast, by Application 2019 & 2032
- Table 101: Global Mobile Mapping Systems Market Revenue Million Forecast, by End-user Verticals 2019 & 2032
- Table 102: Global Mobile Mapping Systems Market Volume K Unit Forecast, by End-user Verticals 2019 & 2032
- Table 103: Global Mobile Mapping Systems Market Revenue Million Forecast, by Country 2019 & 2032
- Table 104: Global Mobile Mapping Systems Market Volume K Unit Forecast, by Country 2019 & 2032
- Table 105: Global Mobile Mapping Systems Market Revenue Million Forecast, by Application 2019 & 2032
- Table 106: Global Mobile Mapping Systems Market Volume K Unit Forecast, by Application 2019 & 2032
- Table 107: Global Mobile Mapping Systems Market Revenue Million Forecast, by End-user Verticals 2019 & 2032
- Table 108: Global Mobile Mapping Systems Market Volume K Unit Forecast, by End-user Verticals 2019 & 2032
- Table 109: Global Mobile Mapping Systems Market Revenue Million Forecast, by Country 2019 & 2032
- Table 110: Global Mobile Mapping Systems Market Volume K Unit Forecast, by Country 2019 & 2032
- Table 111: Global Mobile Mapping Systems Market Revenue Million Forecast, by Application 2019 & 2032
- Table 112: Global Mobile Mapping Systems Market Volume K Unit Forecast, by Application 2019 & 2032
- Table 113: Global Mobile Mapping Systems Market Revenue Million Forecast, by End-user Verticals 2019 & 2032
- Table 114: Global Mobile Mapping Systems Market Volume K Unit Forecast, by End-user Verticals 2019 & 2032
- Table 115: Global Mobile Mapping Systems Market Revenue Million Forecast, by Country 2019 & 2032
- Table 116: Global Mobile Mapping Systems Market Volume K Unit Forecast, by Country 2019 & 2032
- Table 117: Global Mobile Mapping Systems Market Revenue Million Forecast, by Application 2019 & 2032
- Table 118: Global Mobile Mapping Systems Market Volume K Unit Forecast, by Application 2019 & 2032
- Table 119: Global Mobile Mapping Systems Market Revenue Million Forecast, by End-user Verticals 2019 & 2032
- Table 120: Global Mobile Mapping Systems Market Volume K Unit Forecast, by End-user Verticals 2019 & 2032
- Table 121: Global Mobile Mapping Systems Market Revenue Million Forecast, by Country 2019 & 2032
- Table 122: Global Mobile Mapping Systems Market Volume K Unit Forecast, by Country 2019 & 2032
- Table 123: Global Mobile Mapping Systems Market Revenue Million Forecast, by Application 2019 & 2032
- Table 124: Global Mobile Mapping Systems Market Volume K Unit Forecast, by Application 2019 & 2032
- Table 125: Global Mobile Mapping Systems Market Revenue Million Forecast, by End-user Verticals 2019 & 2032
- Table 126: Global Mobile Mapping Systems Market Volume K Unit Forecast, by End-user Verticals 2019 & 2032
- Table 127: Global Mobile Mapping Systems Market Revenue Million Forecast, by Country 2019 & 2032
- Table 128: Global Mobile Mapping Systems Market Volume K Unit Forecast, by Country 2019 & 2032
Frequently Asked Questions
1. What is the projected Compound Annual Growth Rate (CAGR) of the Mobile Mapping Systems Market?
The projected CAGR is approximately 19.83%.
2. Which companies are prominent players in the Mobile Mapping Systems Market?
Key companies in the market include Mitsubishi Corporation, Leica Geosystems AG (Hexagon Geosystems), TomTom International BV, INRIX Inc, Javad GNSS Inc, Teledyne Optech, Cyclomedia Technology BV, Imajing SAS, Google LLC (Alphabet Inc ), NovAtel Inc, Trimble Inc, Topcon Corporation.
3. What are the main segments of the Mobile Mapping Systems Market?
The market segments include Application, End-user Verticals.
4. Can you provide details about the market size?
The market size is estimated to be USD 42.54 Million as of 2022.
5. What are some drivers contributing to market growth?
Integration with All Kinds of Vehicles.
6. What are the notable trends driving market growth?
Imaging Services Segment to Dominate the Market.
7. Are there any restraints impacting market growth?
High Cost of System Acquisition and Deployment.
8. Can you provide examples of recent developments in the market?
November 2022:Topcon invested in the future of construction with donations to TU Dublin. Ireland's first technological university will enhance students' experiences with education on the latest digital construction methods.
9. What pricing options are available for accessing the report?
Pricing options include single-user, multi-user, and enterprise licenses priced at USD 4750, USD 5250, and USD 8750 respectively.
10. Is the market size provided in terms of value or volume?
The market size is provided in terms of value, measured in Million and volume, measured in K Unit.
11. Are there any specific market keywords associated with the report?
Yes, the market keyword associated with the report is "Mobile Mapping Systems Market," which aids in identifying and referencing the specific market segment covered.
12. How do I determine which pricing option suits my needs best?
The pricing options vary based on user requirements and access needs. Individual users may opt for single-user licenses, while businesses requiring broader access may choose multi-user or enterprise licenses for cost-effective access to the report.
13. Are there any additional resources or data provided in the Mobile Mapping Systems Market report?
While the report offers comprehensive insights, it's advisable to review the specific contents or supplementary materials provided to ascertain if additional resources or data are available.
14. How can I stay updated on further developments or reports in the Mobile Mapping Systems Market?
To stay informed about further developments, trends, and reports in the Mobile Mapping Systems Market, consider subscribing to industry newsletters, following relevant companies and organizations, or regularly checking reputable industry news sources and publications.
Methodology
Step 1 - Identification of Relevant Samples Size from Population Database


Step 2 - Approaches for Defining Global Market Size (Value, Volume* & Price*)

Note*: In applicable scenarios
Step 3 - Data Sources
Primary Research
- Web Analytics
- Survey Reports
- Research Institute
- Latest Research Reports
- Opinion Leaders
Secondary Research
- Annual Reports
- White Paper
- Latest Press Release
- Industry Association
- Paid Database
- Investor Presentations

Step 4 - Data Triangulation
Involves using different sources of information in order to increase the validity of a study
These sources are likely to be stakeholders in a program - participants, other researchers, program staff, other community members, and so on.
Then we put all data in single framework & apply various statistical tools to find out the dynamic on the market.
During the analysis stage, feedback from the stakeholder groups would be compared to determine areas of agreement as well as areas of divergence


