
Key Insights
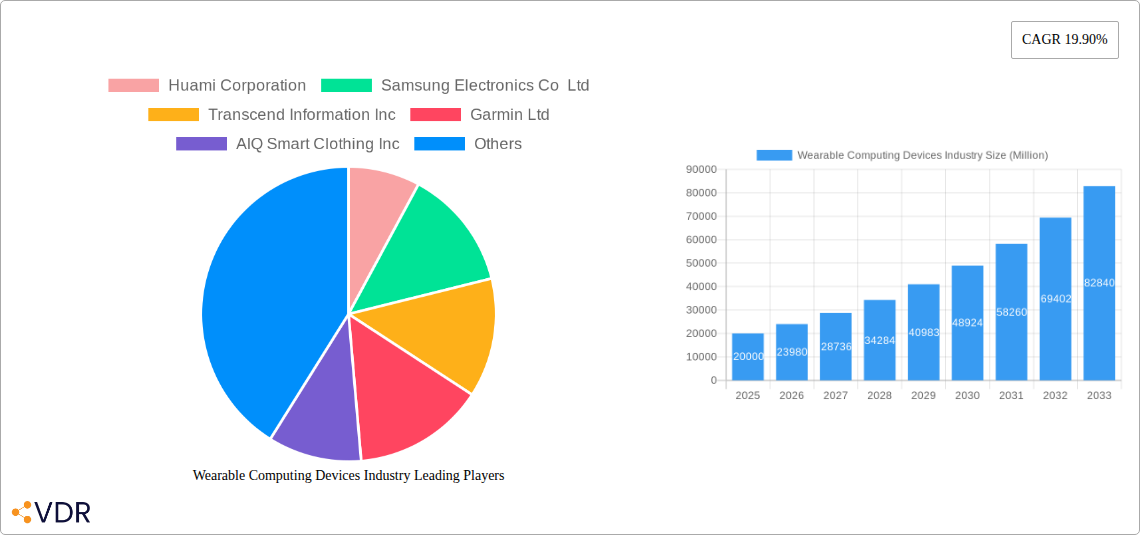
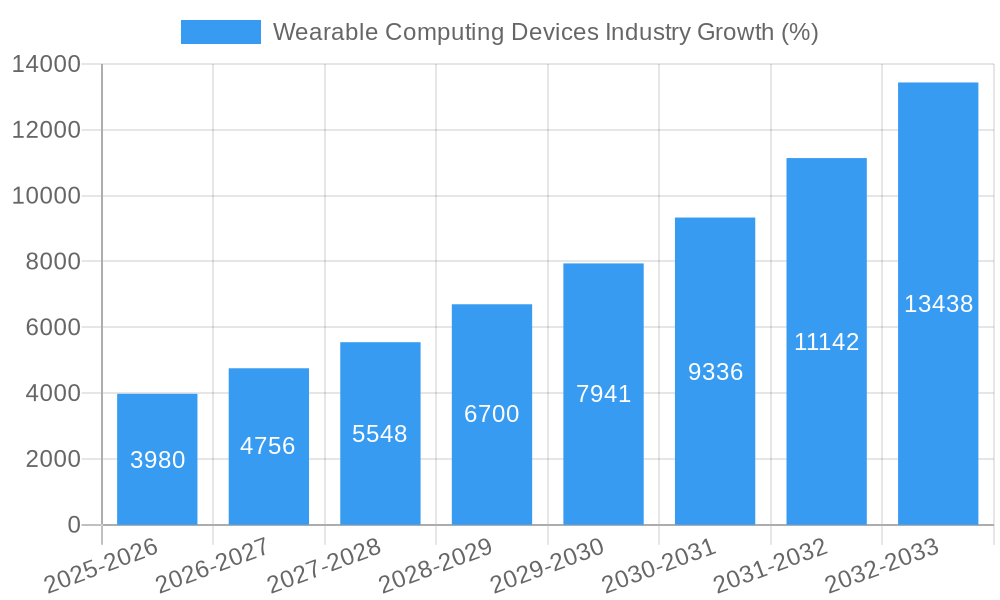
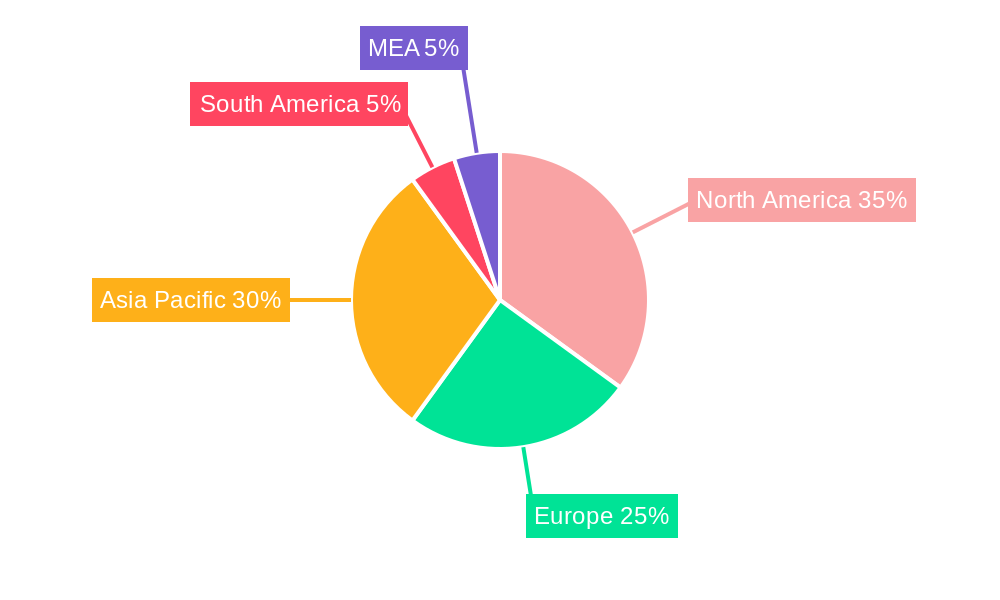
The wearable computing devices market is experiencing robust growth, projected to reach a substantial size by 2033. A compound annual growth rate (CAGR) of 19.90% from 2019 to 2024 indicates significant market expansion driven by several key factors. Technological advancements leading to smaller, more powerful, and energy-efficient devices are fueling adoption across diverse sectors. The increasing demand for health and fitness tracking, coupled with the integration of advanced sensors and AI capabilities in wearables, is a major driver. Furthermore, the rising integration of wearables in industrial applications, such as safety monitoring and remote assistance, significantly contributes to market expansion. The convergence of technology and healthcare is creating new opportunities, with medical-grade wearables for monitoring vital signs and managing chronic conditions gaining traction. Smartwatches, fitness trackers, and hearables (ear-worn devices) currently dominate the product segment, while the growing interest in smart clothing and augmented reality/virtual reality (AR/VR) head-mounted displays signals future growth areas. However, challenges such as concerns over data privacy, battery life limitations, and the high initial cost of certain devices, especially exoskeletons, pose some restraints to market penetration. The market's geographical distribution shows North America and Asia-Pacific as leading regions, driven by high technology adoption rates and strong consumer demand. This is expected to continue throughout the forecast period (2025-2033), although other regions are anticipated to experience considerable growth as affordability and awareness increase.
The competitive landscape is marked by both established tech giants like Apple, Samsung, and Google, alongside specialized companies focusing on specific wearable segments. This dynamic competitive environment fuels innovation and drives down prices, increasing accessibility for a wider consumer base. The ongoing integration of advanced functionalities, such as seamless connectivity, enhanced data analytics, and improved user interfaces, will further enhance user experience and broaden market adoption. Future growth hinges on addressing existing limitations, developing innovative applications, and ensuring user data security and privacy. The continued expansion into new sectors, particularly healthcare and industrial applications, will play a crucial role in shaping the trajectory of the wearable computing devices market in the coming years. The focus will increasingly be on developing personalized and user-centric wearables that cater to specific needs and preferences across various demographic groups.
Wearable Computing Devices Industry Market Report: 2019-2033
This comprehensive report provides a detailed analysis of the Wearable Computing Devices market, covering historical data (2019-2024), the base year (2025), and a forecast period (2025-2033). The report segments the market by product type (smartwatches, head-mounted displays, smart clothing, ear-worn devices, fitness trackers, body-worn cameras, exoskeletons, and other wearables) and end-user (fitness and wellness, medical and healthcare, infotainment, industrial and defense, and other end-users). Key players like Apple Inc, Samsung Electronics Co Ltd, and Fitbit Inc are analyzed, alongside emerging companies driving innovation. This report is an invaluable resource for industry professionals, investors, and anyone seeking a deep understanding of this rapidly evolving market. Expect insightful data presented in a clear, concise, and actionable manner.
Wearable Computing Devices Industry Market Dynamics & Structure
The wearable computing devices market is characterized by high competition, rapid technological advancements, and evolving regulatory landscapes. Market concentration is moderate, with a few major players holding significant market share, while numerous smaller companies focus on niche segments. The market is driven by technological innovation in areas like sensor technology, miniaturization, battery life, and connectivity. Regulatory frameworks vary across regions, impacting product approvals and data privacy. Competitive product substitutes, such as traditional fitness equipment and healthcare monitoring systems, influence market growth. End-user demographics are shifting toward younger generations and an aging population, impacting product demand. M&A activity has been consistent, with larger companies acquiring smaller players to expand their product portfolios and gain access to new technologies.
- Market Concentration: Moderate, with top 5 players holding approximately xx% market share in 2025.
- Technological Innovation: Significant advancements in sensor technology, AI, and connectivity are key drivers.
- Regulatory Frameworks: Vary across regions, impacting product approvals and data privacy compliance.
- Competitive Substitutes: Traditional fitness equipment and healthcare monitoring systems pose some competition.
- End-User Demographics: Shifting towards younger and older age groups, driving specific product demand.
- M&A Trends: Consistent activity, with xx major acquisitions recorded between 2019 and 2024.
Wearable Computing Devices Industry Growth Trends & Insights
The global wearable computing devices market experienced robust growth during the historical period (2019-2024), driven by increasing consumer adoption, technological advancements, and the rising popularity of fitness tracking and health monitoring. The market size reached approximately xx million units in 2024, and is projected to reach xx million units by 2025, exhibiting a CAGR of xx% during the forecast period (2025-2033). This growth is fueled by the increasing affordability of devices, improved functionality, and the growing awareness of personal health and wellness. Technological disruptions, such as the integration of AI and advanced sensor technology, have enhanced user experience and broadened applications. Consumer behavior is shifting toward seamless integration of wearables with smartphones and other smart devices, creating new opportunities for growth. The market penetration is expected to increase from xx% in 2025 to xx% by 2033. The increasing adoption of connected healthcare solutions further fuels this growth, specifically in segments like medical and healthcare end-users.
Dominant Regions, Countries, or Segments in Wearable Computing Devices Industry
North America and Asia Pacific are the dominant regions in the wearable computing devices market, driven by high consumer adoption rates, strong technological advancements, and significant investments in R&D. Within product types, smartwatches and fitness trackers represent the largest segments, contributing to approximately xx% and xx% of the overall market in 2025 respectively. The fitness and wellness end-user segment remains the largest, while the medical and healthcare segment is experiencing the fastest growth due to increasing demand for remote patient monitoring and personalized healthcare solutions.
- Dominant Regions: North America and Asia Pacific.
- Key Drivers (North America): High disposable income, advanced healthcare infrastructure, early adoption of new technologies.
- Key Drivers (Asia Pacific): Growing population, rising middle class, increasing smartphone penetration, focus on preventative healthcare.
- Dominant Product Type: Smartwatches and fitness trackers.
- Fastest-Growing Segment: Medical and healthcare end-user segment.
Wearable Computing Devices Industry Product Landscape
The wearable computing devices market showcases a diverse product landscape, encompassing smartwatches with advanced health monitoring capabilities, augmented reality head-mounted displays for gaming and industrial applications, smart clothing integrating sensors for fitness and health tracking, ear-worn devices for audio and health monitoring, fitness trackers with improved accuracy and features, body-worn cameras for personal and professional use, exoskeletons for rehabilitation and industrial applications, and other wearables, including medical-grade devices and smart glasses. These devices are characterized by improved battery life, enhanced sensor accuracy, and seamless integration with smartphones and cloud-based platforms. Unique selling propositions frequently include personalized fitness coaching, remote health monitoring, and augmented reality applications.
Key Drivers, Barriers & Challenges in Wearable Computing Devices Industry
Key Drivers: Technological advancements (miniaturization, improved battery life, enhanced sensor technology), rising consumer awareness of health and wellness, increasing smartphone penetration, and growing adoption of connected healthcare solutions.
Challenges: High initial costs of devices, concerns regarding data privacy and security, battery life limitations, interoperability issues, and intense competition. Supply chain disruptions have also impacted production and availability, leading to price fluctuations and potential delays. Regulatory hurdles, particularly in medical applications, pose significant challenges for market entry and expansion.
Emerging Opportunities in Wearable Computing Devices Industry
Emerging opportunities lie in the integration of AI and machine learning for advanced data analysis and personalized insights, the development of wearable sensors for early disease detection and prevention, the expansion of applications in the industrial and defense sectors, and the creation of more sustainable and environmentally friendly products. Untapped markets exist in developing economies with growing smartphone penetration and increasing health awareness. The increasing demand for personalized health solutions and remote patient monitoring offers significant growth potential.
Growth Accelerators in the Wearable Computing Devices Industry
Strategic partnerships between technology companies, healthcare providers, and insurance companies are accelerating market growth. Technological breakthroughs in areas like flexible displays, bio-integrated sensors, and energy harvesting technologies are expanding the possibilities of wearable devices. The expansion into new market segments, such as industrial applications and elderly care, is driving further growth.
Key Players Shaping the Wearable Computing Devices Industry Market
- Huami Corporation
- Samsung Electronics Co Ltd
- Transcend Information Inc
- Garmin Ltd
- AIQ Smart Clothing Inc
- GoPro Inc
- Microsoft Corporation
- Medtronic PLC
- Cyberdyne Inc
- Fitbit Inc
- Ekso Bionics Holdings Inc
- Withings
- Huawei Technologies Co Ltd
- Sensoria Inc
- Omron Healthcare Inc
- Fossil Group Inc
- Apple Inc
- Sony Corporation
- Nuheara Limited
Notable Milestones in Wearable Computing Devices Industry Sector
- October 2022: Microsoft rolled out the first batch of IVAS (Integrated Visual Augmentation System) to the US Army.
- October 2022: Emirates Global Aluminium (EGA) implemented Kenzen's wearable tech for worker heat stress monitoring.
- December 2022: Comfiknit launched a T-shirt designed for atopic dermatitis sufferers.
- December 2022: Acemoney introduced a smart ring for NFC-based digital payments.
In-Depth Wearable Computing Devices Industry Market Outlook
The future of the wearable computing devices market is bright, driven by continued technological innovation, expanding applications across various sectors, and increasing consumer adoption. Strategic partnerships and investments in R&D will further accelerate market growth, leading to the development of more sophisticated, user-friendly, and affordable devices. The market's potential lies in the convergence of wearable technology with artificial intelligence, big data analytics, and the Internet of Things (IoT), creating new opportunities for personalized healthcare, industrial automation, and enhanced human capabilities. The market is poised for significant expansion, with substantial growth opportunities in emerging markets and new applications yet to be fully explored.
Wearable Computing Devices Industry Segmentation
-
1. Product Type
- 1.1. Smartwatches
- 1.2. Head Mounted Displays
- 1.3. Smart Clothing
- 1.4. Ear Worn
- 1.5. Fitness Trackers
- 1.6. Body Worn Camera
- 1.7. Exoskeleton
- 1.8. Other We
-
2. End User
- 2.1. Fitness and Wellness
- 2.2. Medical and Healthcare
- 2.3. Infotainment
- 2.4. Industrial and Defense
- 2.5. Other End Users
Wearable Computing Devices Industry Segmentation By Geography
- 1. North America: United States Canada Mexico
- 2. Europe: Germany: France: Italy: United Kingdom Netherlands Rest of Europe
- 3. Asia Pacific: China, Japan, India, South Korea, Taiwan, Australia, Rest of Asia-Pacific
- 4. South America : Brazil, Argentina, Rest of South America
- 5. MEA: Middle East, Africa
Wearable Computing Devices Industry REPORT HIGHLIGHTS
| Aspects | Details |
|---|---|
| Study Period | 2019-2033 |
| Base Year | 2024 |
| Estimated Year | 2025 |
| Forecast Period | 2025-2033 |
| Historical Period | 2019-2024 |
| Growth Rate | CAGR of 19.90% from 2019-2033 |
| Segmentation |
|
Table of Contents
- 1. Introduction
- 1.1. Research Scope
- 1.2. Market Segmentation
- 1.3. Research Methodology
- 1.4. Definitions and Assumptions
- 2. Executive Summary
- 2.1. Introduction
- 3. Market Dynamics
- 3.1. Introduction
- 3.2. Market Drivers
- 3.2.1. Increasing Technological Advancements in the Wearables Market; Increase in Health Awareness Among Consumers
- 3.3. Market Restrains
- 3.3.1 Growing Complexity of Wearable Devices and Limited Use of Features
- 3.3.2 Augmented by Security Risks
- 3.4. Market Trends
- 3.4.1. Smart Clothing Expected to Witness Significant Growth
- 4. Market Factor Analysis
- 4.1. Porters Five Forces
- 4.2. Supply/Value Chain
- 4.3. PESTEL analysis
- 4.4. Market Entropy
- 4.5. Patent/Trademark Analysis
- 5. Global Wearable Computing Devices Industry Analysis, Insights and Forecast, 2019-2031
- 5.1. Market Analysis, Insights and Forecast - by Product Type
- 5.1.1. Smartwatches
- 5.1.2. Head Mounted Displays
- 5.1.3. Smart Clothing
- 5.1.4. Ear Worn
- 5.1.5. Fitness Trackers
- 5.1.6. Body Worn Camera
- 5.1.7. Exoskeleton
- 5.1.8. Other We
- 5.2. Market Analysis, Insights and Forecast - by End User
- 5.2.1. Fitness and Wellness
- 5.2.2. Medical and Healthcare
- 5.2.3. Infotainment
- 5.2.4. Industrial and Defense
- 5.2.5. Other End Users
- 5.3. Market Analysis, Insights and Forecast - by Region
- 5.3.1. North America: United States Canada Mexico
- 5.3.2. Europe: Germany: France: Italy: United Kingdom Netherlands Rest of Europe
- 5.3.3. Asia Pacific: China, Japan, India, South Korea, Taiwan, Australia, Rest of Asia-Pacific
- 5.3.4. South America : Brazil, Argentina, Rest of South America
- 5.3.5. MEA: Middle East, Africa
- 5.1. Market Analysis, Insights and Forecast - by Product Type
- 6. North America: United States Canada Mexico Wearable Computing Devices Industry Analysis, Insights and Forecast, 2019-2031
- 6.1. Market Analysis, Insights and Forecast - by Product Type
- 6.1.1. Smartwatches
- 6.1.2. Head Mounted Displays
- 6.1.3. Smart Clothing
- 6.1.4. Ear Worn
- 6.1.5. Fitness Trackers
- 6.1.6. Body Worn Camera
- 6.1.7. Exoskeleton
- 6.1.8. Other We
- 6.2. Market Analysis, Insights and Forecast - by End User
- 6.2.1. Fitness and Wellness
- 6.2.2. Medical and Healthcare
- 6.2.3. Infotainment
- 6.2.4. Industrial and Defense
- 6.2.5. Other End Users
- 6.1. Market Analysis, Insights and Forecast - by Product Type
- 7. Europe: Germany: France: Italy: United Kingdom Netherlands Rest of Europe Wearable Computing Devices Industry Analysis, Insights and Forecast, 2019-2031
- 7.1. Market Analysis, Insights and Forecast - by Product Type
- 7.1.1. Smartwatches
- 7.1.2. Head Mounted Displays
- 7.1.3. Smart Clothing
- 7.1.4. Ear Worn
- 7.1.5. Fitness Trackers
- 7.1.6. Body Worn Camera
- 7.1.7. Exoskeleton
- 7.1.8. Other We
- 7.2. Market Analysis, Insights and Forecast - by End User
- 7.2.1. Fitness and Wellness
- 7.2.2. Medical and Healthcare
- 7.2.3. Infotainment
- 7.2.4. Industrial and Defense
- 7.2.5. Other End Users
- 7.1. Market Analysis, Insights and Forecast - by Product Type
- 8. Asia Pacific: China, Japan, India, South Korea, Taiwan, Australia, Rest of Asia-Pacific Wearable Computing Devices Industry Analysis, Insights and Forecast, 2019-2031
- 8.1. Market Analysis, Insights and Forecast - by Product Type
- 8.1.1. Smartwatches
- 8.1.2. Head Mounted Displays
- 8.1.3. Smart Clothing
- 8.1.4. Ear Worn
- 8.1.5. Fitness Trackers
- 8.1.6. Body Worn Camera
- 8.1.7. Exoskeleton
- 8.1.8. Other We
- 8.2. Market Analysis, Insights and Forecast - by End User
- 8.2.1. Fitness and Wellness
- 8.2.2. Medical and Healthcare
- 8.2.3. Infotainment
- 8.2.4. Industrial and Defense
- 8.2.5. Other End Users
- 8.1. Market Analysis, Insights and Forecast - by Product Type
- 9. South America : Brazil, Argentina, Rest of South America Wearable Computing Devices Industry Analysis, Insights and Forecast, 2019-2031
- 9.1. Market Analysis, Insights and Forecast - by Product Type
- 9.1.1. Smartwatches
- 9.1.2. Head Mounted Displays
- 9.1.3. Smart Clothing
- 9.1.4. Ear Worn
- 9.1.5. Fitness Trackers
- 9.1.6. Body Worn Camera
- 9.1.7. Exoskeleton
- 9.1.8. Other We
- 9.2. Market Analysis, Insights and Forecast - by End User
- 9.2.1. Fitness and Wellness
- 9.2.2. Medical and Healthcare
- 9.2.3. Infotainment
- 9.2.4. Industrial and Defense
- 9.2.5. Other End Users
- 9.1. Market Analysis, Insights and Forecast - by Product Type
- 10. MEA: Middle East, Africa Wearable Computing Devices Industry Analysis, Insights and Forecast, 2019-2031
- 10.1. Market Analysis, Insights and Forecast - by Product Type
- 10.1.1. Smartwatches
- 10.1.2. Head Mounted Displays
- 10.1.3. Smart Clothing
- 10.1.4. Ear Worn
- 10.1.5. Fitness Trackers
- 10.1.6. Body Worn Camera
- 10.1.7. Exoskeleton
- 10.1.8. Other We
- 10.2. Market Analysis, Insights and Forecast - by End User
- 10.2.1. Fitness and Wellness
- 10.2.2. Medical and Healthcare
- 10.2.3. Infotainment
- 10.2.4. Industrial and Defense
- 10.2.5. Other End Users
- 10.1. Market Analysis, Insights and Forecast - by Product Type
- 11. North America Wearable Computing Devices Industry Analysis, Insights and Forecast, 2019-2031
- 11.1. Market Analysis, Insights and Forecast - By Country/Sub-region
- 11.1.1 United States
- 11.1.2 Canada
- 11.1.3 Mexico
- 12. Europe Wearable Computing Devices Industry Analysis, Insights and Forecast, 2019-2031
- 12.1. Market Analysis, Insights and Forecast - By Country/Sub-region
- 12.1.1 Germany
- 12.1.2 United Kingdom
- 12.1.3 France
- 12.1.4 Spain
- 12.1.5 Italy
- 12.1.6 Spain
- 12.1.7 Belgium
- 12.1.8 Netherland
- 12.1.9 Nordics
- 12.1.10 Rest of Europe
- 13. Asia Pacific Wearable Computing Devices Industry Analysis, Insights and Forecast, 2019-2031
- 13.1. Market Analysis, Insights and Forecast - By Country/Sub-region
- 13.1.1 China
- 13.1.2 Japan
- 13.1.3 India
- 13.1.4 South Korea
- 13.1.5 Southeast Asia
- 13.1.6 Australia
- 13.1.7 Indonesia
- 13.1.8 Phillipes
- 13.1.9 Singapore
- 13.1.10 Thailandc
- 13.1.11 Rest of Asia Pacific
- 14. South America Wearable Computing Devices Industry Analysis, Insights and Forecast, 2019-2031
- 14.1. Market Analysis, Insights and Forecast - By Country/Sub-region
- 14.1.1 Brazil
- 14.1.2 Argentina
- 14.1.3 Peru
- 14.1.4 Chile
- 14.1.5 Colombia
- 14.1.6 Ecuador
- 14.1.7 Venezuela
- 14.1.8 Rest of South America
- 15. North America Wearable Computing Devices Industry Analysis, Insights and Forecast, 2019-2031
- 15.1. Market Analysis, Insights and Forecast - By Country/Sub-region
- 15.1.1 United States
- 15.1.2 Canada
- 15.1.3 Mexico
- 16. MEA Wearable Computing Devices Industry Analysis, Insights and Forecast, 2019-2031
- 16.1. Market Analysis, Insights and Forecast - By Country/Sub-region
- 16.1.1 United Arab Emirates
- 16.1.2 Saudi Arabia
- 16.1.3 South Africa
- 16.1.4 Rest of Middle East and Africa
- 17. Competitive Analysis
- 17.1. Global Market Share Analysis 2024
- 17.2. Company Profiles
- 17.2.1 Huami Corporation
- 17.2.1.1. Overview
- 17.2.1.2. Products
- 17.2.1.3. SWOT Analysis
- 17.2.1.4. Recent Developments
- 17.2.1.5. Financials (Based on Availability)
- 17.2.2 Samsung Electronics Co Ltd
- 17.2.2.1. Overview
- 17.2.2.2. Products
- 17.2.2.3. SWOT Analysis
- 17.2.2.4. Recent Developments
- 17.2.2.5. Financials (Based on Availability)
- 17.2.3 Transcend Information Inc
- 17.2.3.1. Overview
- 17.2.3.2. Products
- 17.2.3.3. SWOT Analysis
- 17.2.3.4. Recent Developments
- 17.2.3.5. Financials (Based on Availability)
- 17.2.4 Garmin Ltd
- 17.2.4.1. Overview
- 17.2.4.2. Products
- 17.2.4.3. SWOT Analysis
- 17.2.4.4. Recent Developments
- 17.2.4.5. Financials (Based on Availability)
- 17.2.5 AIQ Smart Clothing Inc
- 17.2.5.1. Overview
- 17.2.5.2. Products
- 17.2.5.3. SWOT Analysis
- 17.2.5.4. Recent Developments
- 17.2.5.5. Financials (Based on Availability)
- 17.2.6 GoPro Inc
- 17.2.6.1. Overview
- 17.2.6.2. Products
- 17.2.6.3. SWOT Analysis
- 17.2.6.4. Recent Developments
- 17.2.6.5. Financials (Based on Availability)
- 17.2.7 Microsoft Corporation
- 17.2.7.1. Overview
- 17.2.7.2. Products
- 17.2.7.3. SWOT Analysis
- 17.2.7.4. Recent Developments
- 17.2.7.5. Financials (Based on Availability)
- 17.2.8 Medtronic PLC
- 17.2.8.1. Overview
- 17.2.8.2. Products
- 17.2.8.3. SWOT Analysis
- 17.2.8.4. Recent Developments
- 17.2.8.5. Financials (Based on Availability)
- 17.2.9 Cyberdyne Inc
- 17.2.9.1. Overview
- 17.2.9.2. Products
- 17.2.9.3. SWOT Analysis
- 17.2.9.4. Recent Developments
- 17.2.9.5. Financials (Based on Availability)
- 17.2.10 Fitbit Inc
- 17.2.10.1. Overview
- 17.2.10.2. Products
- 17.2.10.3. SWOT Analysis
- 17.2.10.4. Recent Developments
- 17.2.10.5. Financials (Based on Availability)
- 17.2.11 Ekso Bionics Holdings Inc
- 17.2.11.1. Overview
- 17.2.11.2. Products
- 17.2.11.3. SWOT Analysis
- 17.2.11.4. Recent Developments
- 17.2.11.5. Financials (Based on Availability)
- 17.2.12 Withings
- 17.2.12.1. Overview
- 17.2.12.2. Products
- 17.2.12.3. SWOT Analysis
- 17.2.12.4. Recent Developments
- 17.2.12.5. Financials (Based on Availability)
- 17.2.13 Huawei Technologies Co Ltd
- 17.2.13.1. Overview
- 17.2.13.2. Products
- 17.2.13.3. SWOT Analysis
- 17.2.13.4. Recent Developments
- 17.2.13.5. Financials (Based on Availability)
- 17.2.14 Sensoria Inc
- 17.2.14.1. Overview
- 17.2.14.2. Products
- 17.2.14.3. SWOT Analysis
- 17.2.14.4. Recent Developments
- 17.2.14.5. Financials (Based on Availability)
- 17.2.15 Omron Healthcare Inc
- 17.2.15.1. Overview
- 17.2.15.2. Products
- 17.2.15.3. SWOT Analysis
- 17.2.15.4. Recent Developments
- 17.2.15.5. Financials (Based on Availability)
- 17.2.16 Fossil Group Inc
- 17.2.16.1. Overview
- 17.2.16.2. Products
- 17.2.16.3. SWOT Analysis
- 17.2.16.4. Recent Developments
- 17.2.16.5. Financials (Based on Availability)
- 17.2.17 Apple Inc
- 17.2.17.1. Overview
- 17.2.17.2. Products
- 17.2.17.3. SWOT Analysis
- 17.2.17.4. Recent Developments
- 17.2.17.5. Financials (Based on Availability)
- 17.2.18 Sony Corporation
- 17.2.18.1. Overview
- 17.2.18.2. Products
- 17.2.18.3. SWOT Analysis
- 17.2.18.4. Recent Developments
- 17.2.18.5. Financials (Based on Availability)
- 17.2.19 Nuheara Limited
- 17.2.19.1. Overview
- 17.2.19.2. Products
- 17.2.19.3. SWOT Analysis
- 17.2.19.4. Recent Developments
- 17.2.19.5. Financials (Based on Availability)
- 17.2.1 Huami Corporation
List of Figures
- Figure 1: Global Wearable Computing Devices Industry Revenue Breakdown (Million, %) by Region 2024 & 2032
- Figure 2: Global Wearable Computing Devices Industry Volume Breakdown (K Unit, %) by Region 2024 & 2032
- Figure 3: North America Wearable Computing Devices Industry Revenue (Million), by Country 2024 & 2032
- Figure 4: North America Wearable Computing Devices Industry Volume (K Unit), by Country 2024 & 2032
- Figure 5: North America Wearable Computing Devices Industry Revenue Share (%), by Country 2024 & 2032
- Figure 6: North America Wearable Computing Devices Industry Volume Share (%), by Country 2024 & 2032
- Figure 7: Europe Wearable Computing Devices Industry Revenue (Million), by Country 2024 & 2032
- Figure 8: Europe Wearable Computing Devices Industry Volume (K Unit), by Country 2024 & 2032
- Figure 9: Europe Wearable Computing Devices Industry Revenue Share (%), by Country 2024 & 2032
- Figure 10: Europe Wearable Computing Devices Industry Volume Share (%), by Country 2024 & 2032
- Figure 11: Asia Pacific Wearable Computing Devices Industry Revenue (Million), by Country 2024 & 2032
- Figure 12: Asia Pacific Wearable Computing Devices Industry Volume (K Unit), by Country 2024 & 2032
- Figure 13: Asia Pacific Wearable Computing Devices Industry Revenue Share (%), by Country 2024 & 2032
- Figure 14: Asia Pacific Wearable Computing Devices Industry Volume Share (%), by Country 2024 & 2032
- Figure 15: South America Wearable Computing Devices Industry Revenue (Million), by Country 2024 & 2032
- Figure 16: South America Wearable Computing Devices Industry Volume (K Unit), by Country 2024 & 2032
- Figure 17: South America Wearable Computing Devices Industry Revenue Share (%), by Country 2024 & 2032
- Figure 18: South America Wearable Computing Devices Industry Volume Share (%), by Country 2024 & 2032
- Figure 19: North America Wearable Computing Devices Industry Revenue (Million), by Country 2024 & 2032
- Figure 20: North America Wearable Computing Devices Industry Volume (K Unit), by Country 2024 & 2032
- Figure 21: North America Wearable Computing Devices Industry Revenue Share (%), by Country 2024 & 2032
- Figure 22: North America Wearable Computing Devices Industry Volume Share (%), by Country 2024 & 2032
- Figure 23: MEA Wearable Computing Devices Industry Revenue (Million), by Country 2024 & 2032
- Figure 24: MEA Wearable Computing Devices Industry Volume (K Unit), by Country 2024 & 2032
- Figure 25: MEA Wearable Computing Devices Industry Revenue Share (%), by Country 2024 & 2032
- Figure 26: MEA Wearable Computing Devices Industry Volume Share (%), by Country 2024 & 2032
- Figure 27: North America: United States Canada Mexico Wearable Computing Devices Industry Revenue (Million), by Product Type 2024 & 2032
- Figure 28: North America: United States Canada Mexico Wearable Computing Devices Industry Volume (K Unit), by Product Type 2024 & 2032
- Figure 29: North America: United States Canada Mexico Wearable Computing Devices Industry Revenue Share (%), by Product Type 2024 & 2032
- Figure 30: North America: United States Canada Mexico Wearable Computing Devices Industry Volume Share (%), by Product Type 2024 & 2032
- Figure 31: North America: United States Canada Mexico Wearable Computing Devices Industry Revenue (Million), by End User 2024 & 2032
- Figure 32: North America: United States Canada Mexico Wearable Computing Devices Industry Volume (K Unit), by End User 2024 & 2032
- Figure 33: North America: United States Canada Mexico Wearable Computing Devices Industry Revenue Share (%), by End User 2024 & 2032
- Figure 34: North America: United States Canada Mexico Wearable Computing Devices Industry Volume Share (%), by End User 2024 & 2032
- Figure 35: North America: United States Canada Mexico Wearable Computing Devices Industry Revenue (Million), by Country 2024 & 2032
- Figure 36: North America: United States Canada Mexico Wearable Computing Devices Industry Volume (K Unit), by Country 2024 & 2032
- Figure 37: North America: United States Canada Mexico Wearable Computing Devices Industry Revenue Share (%), by Country 2024 & 2032
- Figure 38: North America: United States Canada Mexico Wearable Computing Devices Industry Volume Share (%), by Country 2024 & 2032
- Figure 39: Europe: Germany: France: Italy: United Kingdom Netherlands Rest of Europe Wearable Computing Devices Industry Revenue (Million), by Product Type 2024 & 2032
- Figure 40: Europe: Germany: France: Italy: United Kingdom Netherlands Rest of Europe Wearable Computing Devices Industry Volume (K Unit), by Product Type 2024 & 2032
- Figure 41: Europe: Germany: France: Italy: United Kingdom Netherlands Rest of Europe Wearable Computing Devices Industry Revenue Share (%), by Product Type 2024 & 2032
- Figure 42: Europe: Germany: France: Italy: United Kingdom Netherlands Rest of Europe Wearable Computing Devices Industry Volume Share (%), by Product Type 2024 & 2032
- Figure 43: Europe: Germany: France: Italy: United Kingdom Netherlands Rest of Europe Wearable Computing Devices Industry Revenue (Million), by End User 2024 & 2032
- Figure 44: Europe: Germany: France: Italy: United Kingdom Netherlands Rest of Europe Wearable Computing Devices Industry Volume (K Unit), by End User 2024 & 2032
- Figure 45: Europe: Germany: France: Italy: United Kingdom Netherlands Rest of Europe Wearable Computing Devices Industry Revenue Share (%), by End User 2024 & 2032
- Figure 46: Europe: Germany: France: Italy: United Kingdom Netherlands Rest of Europe Wearable Computing Devices Industry Volume Share (%), by End User 2024 & 2032
- Figure 47: Europe: Germany: France: Italy: United Kingdom Netherlands Rest of Europe Wearable Computing Devices Industry Revenue (Million), by Country 2024 & 2032
- Figure 48: Europe: Germany: France: Italy: United Kingdom Netherlands Rest of Europe Wearable Computing Devices Industry Volume (K Unit), by Country 2024 & 2032
- Figure 49: Europe: Germany: France: Italy: United Kingdom Netherlands Rest of Europe Wearable Computing Devices Industry Revenue Share (%), by Country 2024 & 2032
- Figure 50: Europe: Germany: France: Italy: United Kingdom Netherlands Rest of Europe Wearable Computing Devices Industry Volume Share (%), by Country 2024 & 2032
- Figure 51: Asia Pacific: China, Japan, India, South Korea, Taiwan, Australia, Rest of Asia-Pacific Wearable Computing Devices Industry Revenue (Million), by Product Type 2024 & 2032
- Figure 52: Asia Pacific: China, Japan, India, South Korea, Taiwan, Australia, Rest of Asia-Pacific Wearable Computing Devices Industry Volume (K Unit), by Product Type 2024 & 2032
- Figure 53: Asia Pacific: China, Japan, India, South Korea, Taiwan, Australia, Rest of Asia-Pacific Wearable Computing Devices Industry Revenue Share (%), by Product Type 2024 & 2032
- Figure 54: Asia Pacific: China, Japan, India, South Korea, Taiwan, Australia, Rest of Asia-Pacific Wearable Computing Devices Industry Volume Share (%), by Product Type 2024 & 2032
- Figure 55: Asia Pacific: China, Japan, India, South Korea, Taiwan, Australia, Rest of Asia-Pacific Wearable Computing Devices Industry Revenue (Million), by End User 2024 & 2032
- Figure 56: Asia Pacific: China, Japan, India, South Korea, Taiwan, Australia, Rest of Asia-Pacific Wearable Computing Devices Industry Volume (K Unit), by End User 2024 & 2032
- Figure 57: Asia Pacific: China, Japan, India, South Korea, Taiwan, Australia, Rest of Asia-Pacific Wearable Computing Devices Industry Revenue Share (%), by End User 2024 & 2032
- Figure 58: Asia Pacific: China, Japan, India, South Korea, Taiwan, Australia, Rest of Asia-Pacific Wearable Computing Devices Industry Volume Share (%), by End User 2024 & 2032
- Figure 59: Asia Pacific: China, Japan, India, South Korea, Taiwan, Australia, Rest of Asia-Pacific Wearable Computing Devices Industry Revenue (Million), by Country 2024 & 2032
- Figure 60: Asia Pacific: China, Japan, India, South Korea, Taiwan, Australia, Rest of Asia-Pacific Wearable Computing Devices Industry Volume (K Unit), by Country 2024 & 2032
- Figure 61: Asia Pacific: China, Japan, India, South Korea, Taiwan, Australia, Rest of Asia-Pacific Wearable Computing Devices Industry Revenue Share (%), by Country 2024 & 2032
- Figure 62: Asia Pacific: China, Japan, India, South Korea, Taiwan, Australia, Rest of Asia-Pacific Wearable Computing Devices Industry Volume Share (%), by Country 2024 & 2032
- Figure 63: South America : Brazil, Argentina, Rest of South America Wearable Computing Devices Industry Revenue (Million), by Product Type 2024 & 2032
- Figure 64: South America : Brazil, Argentina, Rest of South America Wearable Computing Devices Industry Volume (K Unit), by Product Type 2024 & 2032
- Figure 65: South America : Brazil, Argentina, Rest of South America Wearable Computing Devices Industry Revenue Share (%), by Product Type 2024 & 2032
- Figure 66: South America : Brazil, Argentina, Rest of South America Wearable Computing Devices Industry Volume Share (%), by Product Type 2024 & 2032
- Figure 67: South America : Brazil, Argentina, Rest of South America Wearable Computing Devices Industry Revenue (Million), by End User 2024 & 2032
- Figure 68: South America : Brazil, Argentina, Rest of South America Wearable Computing Devices Industry Volume (K Unit), by End User 2024 & 2032
- Figure 69: South America : Brazil, Argentina, Rest of South America Wearable Computing Devices Industry Revenue Share (%), by End User 2024 & 2032
- Figure 70: South America : Brazil, Argentina, Rest of South America Wearable Computing Devices Industry Volume Share (%), by End User 2024 & 2032
- Figure 71: South America : Brazil, Argentina, Rest of South America Wearable Computing Devices Industry Revenue (Million), by Country 2024 & 2032
- Figure 72: South America : Brazil, Argentina, Rest of South America Wearable Computing Devices Industry Volume (K Unit), by Country 2024 & 2032
- Figure 73: South America : Brazil, Argentina, Rest of South America Wearable Computing Devices Industry Revenue Share (%), by Country 2024 & 2032
- Figure 74: South America : Brazil, Argentina, Rest of South America Wearable Computing Devices Industry Volume Share (%), by Country 2024 & 2032
- Figure 75: MEA: Middle East, Africa Wearable Computing Devices Industry Revenue (Million), by Product Type 2024 & 2032
- Figure 76: MEA: Middle East, Africa Wearable Computing Devices Industry Volume (K Unit), by Product Type 2024 & 2032
- Figure 77: MEA: Middle East, Africa Wearable Computing Devices Industry Revenue Share (%), by Product Type 2024 & 2032
- Figure 78: MEA: Middle East, Africa Wearable Computing Devices Industry Volume Share (%), by Product Type 2024 & 2032
- Figure 79: MEA: Middle East, Africa Wearable Computing Devices Industry Revenue (Million), by End User 2024 & 2032
- Figure 80: MEA: Middle East, Africa Wearable Computing Devices Industry Volume (K Unit), by End User 2024 & 2032
- Figure 81: MEA: Middle East, Africa Wearable Computing Devices Industry Revenue Share (%), by End User 2024 & 2032
- Figure 82: MEA: Middle East, Africa Wearable Computing Devices Industry Volume Share (%), by End User 2024 & 2032
- Figure 83: MEA: Middle East, Africa Wearable Computing Devices Industry Revenue (Million), by Country 2024 & 2032
- Figure 84: MEA: Middle East, Africa Wearable Computing Devices Industry Volume (K Unit), by Country 2024 & 2032
- Figure 85: MEA: Middle East, Africa Wearable Computing Devices Industry Revenue Share (%), by Country 2024 & 2032
- Figure 86: MEA: Middle East, Africa Wearable Computing Devices Industry Volume Share (%), by Country 2024 & 2032
List of Tables
- Table 1: Global Wearable Computing Devices Industry Revenue Million Forecast, by Region 2019 & 2032
- Table 2: Global Wearable Computing Devices Industry Volume K Unit Forecast, by Region 2019 & 2032
- Table 3: Global Wearable Computing Devices Industry Revenue Million Forecast, by Product Type 2019 & 2032
- Table 4: Global Wearable Computing Devices Industry Volume K Unit Forecast, by Product Type 2019 & 2032
- Table 5: Global Wearable Computing Devices Industry Revenue Million Forecast, by End User 2019 & 2032
- Table 6: Global Wearable Computing Devices Industry Volume K Unit Forecast, by End User 2019 & 2032
- Table 7: Global Wearable Computing Devices Industry Revenue Million Forecast, by Region 2019 & 2032
- Table 8: Global Wearable Computing Devices Industry Volume K Unit Forecast, by Region 2019 & 2032
- Table 9: Global Wearable Computing Devices Industry Revenue Million Forecast, by Country 2019 & 2032
- Table 10: Global Wearable Computing Devices Industry Volume K Unit Forecast, by Country 2019 & 2032
- Table 11: United States Wearable Computing Devices Industry Revenue (Million) Forecast, by Application 2019 & 2032
- Table 12: United States Wearable Computing Devices Industry Volume (K Unit) Forecast, by Application 2019 & 2032
- Table 13: Canada Wearable Computing Devices Industry Revenue (Million) Forecast, by Application 2019 & 2032
- Table 14: Canada Wearable Computing Devices Industry Volume (K Unit) Forecast, by Application 2019 & 2032
- Table 15: Mexico Wearable Computing Devices Industry Revenue (Million) Forecast, by Application 2019 & 2032
- Table 16: Mexico Wearable Computing Devices Industry Volume (K Unit) Forecast, by Application 2019 & 2032
- Table 17: Global Wearable Computing Devices Industry Revenue Million Forecast, by Country 2019 & 2032
- Table 18: Global Wearable Computing Devices Industry Volume K Unit Forecast, by Country 2019 & 2032
- Table 19: Germany Wearable Computing Devices Industry Revenue (Million) Forecast, by Application 2019 & 2032
- Table 20: Germany Wearable Computing Devices Industry Volume (K Unit) Forecast, by Application 2019 & 2032
- Table 21: United Kingdom Wearable Computing Devices Industry Revenue (Million) Forecast, by Application 2019 & 2032
- Table 22: United Kingdom Wearable Computing Devices Industry Volume (K Unit) Forecast, by Application 2019 & 2032
- Table 23: France Wearable Computing Devices Industry Revenue (Million) Forecast, by Application 2019 & 2032
- Table 24: France Wearable Computing Devices Industry Volume (K Unit) Forecast, by Application 2019 & 2032
- Table 25: Spain Wearable Computing Devices Industry Revenue (Million) Forecast, by Application 2019 & 2032
- Table 26: Spain Wearable Computing Devices Industry Volume (K Unit) Forecast, by Application 2019 & 2032
- Table 27: Italy Wearable Computing Devices Industry Revenue (Million) Forecast, by Application 2019 & 2032
- Table 28: Italy Wearable Computing Devices Industry Volume (K Unit) Forecast, by Application 2019 & 2032
- Table 29: Spain Wearable Computing Devices Industry Revenue (Million) Forecast, by Application 2019 & 2032
- Table 30: Spain Wearable Computing Devices Industry Volume (K Unit) Forecast, by Application 2019 & 2032
- Table 31: Belgium Wearable Computing Devices Industry Revenue (Million) Forecast, by Application 2019 & 2032
- Table 32: Belgium Wearable Computing Devices Industry Volume (K Unit) Forecast, by Application 2019 & 2032
- Table 33: Netherland Wearable Computing Devices Industry Revenue (Million) Forecast, by Application 2019 & 2032
- Table 34: Netherland Wearable Computing Devices Industry Volume (K Unit) Forecast, by Application 2019 & 2032
- Table 35: Nordics Wearable Computing Devices Industry Revenue (Million) Forecast, by Application 2019 & 2032
- Table 36: Nordics Wearable Computing Devices Industry Volume (K Unit) Forecast, by Application 2019 & 2032
- Table 37: Rest of Europe Wearable Computing Devices Industry Revenue (Million) Forecast, by Application 2019 & 2032
- Table 38: Rest of Europe Wearable Computing Devices Industry Volume (K Unit) Forecast, by Application 2019 & 2032
- Table 39: Global Wearable Computing Devices Industry Revenue Million Forecast, by Country 2019 & 2032
- Table 40: Global Wearable Computing Devices Industry Volume K Unit Forecast, by Country 2019 & 2032
- Table 41: China Wearable Computing Devices Industry Revenue (Million) Forecast, by Application 2019 & 2032
- Table 42: China Wearable Computing Devices Industry Volume (K Unit) Forecast, by Application 2019 & 2032
- Table 43: Japan Wearable Computing Devices Industry Revenue (Million) Forecast, by Application 2019 & 2032
- Table 44: Japan Wearable Computing Devices Industry Volume (K Unit) Forecast, by Application 2019 & 2032
- Table 45: India Wearable Computing Devices Industry Revenue (Million) Forecast, by Application 2019 & 2032
- Table 46: India Wearable Computing Devices Industry Volume (K Unit) Forecast, by Application 2019 & 2032
- Table 47: South Korea Wearable Computing Devices Industry Revenue (Million) Forecast, by Application 2019 & 2032
- Table 48: South Korea Wearable Computing Devices Industry Volume (K Unit) Forecast, by Application 2019 & 2032
- Table 49: Southeast Asia Wearable Computing Devices Industry Revenue (Million) Forecast, by Application 2019 & 2032
- Table 50: Southeast Asia Wearable Computing Devices Industry Volume (K Unit) Forecast, by Application 2019 & 2032
- Table 51: Australia Wearable Computing Devices Industry Revenue (Million) Forecast, by Application 2019 & 2032
- Table 52: Australia Wearable Computing Devices Industry Volume (K Unit) Forecast, by Application 2019 & 2032
- Table 53: Indonesia Wearable Computing Devices Industry Revenue (Million) Forecast, by Application 2019 & 2032
- Table 54: Indonesia Wearable Computing Devices Industry Volume (K Unit) Forecast, by Application 2019 & 2032
- Table 55: Phillipes Wearable Computing Devices Industry Revenue (Million) Forecast, by Application 2019 & 2032
- Table 56: Phillipes Wearable Computing Devices Industry Volume (K Unit) Forecast, by Application 2019 & 2032
- Table 57: Singapore Wearable Computing Devices Industry Revenue (Million) Forecast, by Application 2019 & 2032
- Table 58: Singapore Wearable Computing Devices Industry Volume (K Unit) Forecast, by Application 2019 & 2032
- Table 59: Thailandc Wearable Computing Devices Industry Revenue (Million) Forecast, by Application 2019 & 2032
- Table 60: Thailandc Wearable Computing Devices Industry Volume (K Unit) Forecast, by Application 2019 & 2032
- Table 61: Rest of Asia Pacific Wearable Computing Devices Industry Revenue (Million) Forecast, by Application 2019 & 2032
- Table 62: Rest of Asia Pacific Wearable Computing Devices Industry Volume (K Unit) Forecast, by Application 2019 & 2032
- Table 63: Global Wearable Computing Devices Industry Revenue Million Forecast, by Country 2019 & 2032
- Table 64: Global Wearable Computing Devices Industry Volume K Unit Forecast, by Country 2019 & 2032
- Table 65: Brazil Wearable Computing Devices Industry Revenue (Million) Forecast, by Application 2019 & 2032
- Table 66: Brazil Wearable Computing Devices Industry Volume (K Unit) Forecast, by Application 2019 & 2032
- Table 67: Argentina Wearable Computing Devices Industry Revenue (Million) Forecast, by Application 2019 & 2032
- Table 68: Argentina Wearable Computing Devices Industry Volume (K Unit) Forecast, by Application 2019 & 2032
- Table 69: Peru Wearable Computing Devices Industry Revenue (Million) Forecast, by Application 2019 & 2032
- Table 70: Peru Wearable Computing Devices Industry Volume (K Unit) Forecast, by Application 2019 & 2032
- Table 71: Chile Wearable Computing Devices Industry Revenue (Million) Forecast, by Application 2019 & 2032
- Table 72: Chile Wearable Computing Devices Industry Volume (K Unit) Forecast, by Application 2019 & 2032
- Table 73: Colombia Wearable Computing Devices Industry Revenue (Million) Forecast, by Application 2019 & 2032
- Table 74: Colombia Wearable Computing Devices Industry Volume (K Unit) Forecast, by Application 2019 & 2032
- Table 75: Ecuador Wearable Computing Devices Industry Revenue (Million) Forecast, by Application 2019 & 2032
- Table 76: Ecuador Wearable Computing Devices Industry Volume (K Unit) Forecast, by Application 2019 & 2032
- Table 77: Venezuela Wearable Computing Devices Industry Revenue (Million) Forecast, by Application 2019 & 2032
- Table 78: Venezuela Wearable Computing Devices Industry Volume (K Unit) Forecast, by Application 2019 & 2032
- Table 79: Rest of South America Wearable Computing Devices Industry Revenue (Million) Forecast, by Application 2019 & 2032
- Table 80: Rest of South America Wearable Computing Devices Industry Volume (K Unit) Forecast, by Application 2019 & 2032
- Table 81: Global Wearable Computing Devices Industry Revenue Million Forecast, by Country 2019 & 2032
- Table 82: Global Wearable Computing Devices Industry Volume K Unit Forecast, by Country 2019 & 2032
- Table 83: United States Wearable Computing Devices Industry Revenue (Million) Forecast, by Application 2019 & 2032
- Table 84: United States Wearable Computing Devices Industry Volume (K Unit) Forecast, by Application 2019 & 2032
- Table 85: Canada Wearable Computing Devices Industry Revenue (Million) Forecast, by Application 2019 & 2032
- Table 86: Canada Wearable Computing Devices Industry Volume (K Unit) Forecast, by Application 2019 & 2032
- Table 87: Mexico Wearable Computing Devices Industry Revenue (Million) Forecast, by Application 2019 & 2032
- Table 88: Mexico Wearable Computing Devices Industry Volume (K Unit) Forecast, by Application 2019 & 2032
- Table 89: Global Wearable Computing Devices Industry Revenue Million Forecast, by Country 2019 & 2032
- Table 90: Global Wearable Computing Devices Industry Volume K Unit Forecast, by Country 2019 & 2032
- Table 91: United Arab Emirates Wearable Computing Devices Industry Revenue (Million) Forecast, by Application 2019 & 2032
- Table 92: United Arab Emirates Wearable Computing Devices Industry Volume (K Unit) Forecast, by Application 2019 & 2032
- Table 93: Saudi Arabia Wearable Computing Devices Industry Revenue (Million) Forecast, by Application 2019 & 2032
- Table 94: Saudi Arabia Wearable Computing Devices Industry Volume (K Unit) Forecast, by Application 2019 & 2032
- Table 95: South Africa Wearable Computing Devices Industry Revenue (Million) Forecast, by Application 2019 & 2032
- Table 96: South Africa Wearable Computing Devices Industry Volume (K Unit) Forecast, by Application 2019 & 2032
- Table 97: Rest of Middle East and Africa Wearable Computing Devices Industry Revenue (Million) Forecast, by Application 2019 & 2032
- Table 98: Rest of Middle East and Africa Wearable Computing Devices Industry Volume (K Unit) Forecast, by Application 2019 & 2032
- Table 99: Global Wearable Computing Devices Industry Revenue Million Forecast, by Product Type 2019 & 2032
- Table 100: Global Wearable Computing Devices Industry Volume K Unit Forecast, by Product Type 2019 & 2032
- Table 101: Global Wearable Computing Devices Industry Revenue Million Forecast, by End User 2019 & 2032
- Table 102: Global Wearable Computing Devices Industry Volume K Unit Forecast, by End User 2019 & 2032
- Table 103: Global Wearable Computing Devices Industry Revenue Million Forecast, by Country 2019 & 2032
- Table 104: Global Wearable Computing Devices Industry Volume K Unit Forecast, by Country 2019 & 2032
- Table 105: Global Wearable Computing Devices Industry Revenue Million Forecast, by Product Type 2019 & 2032
- Table 106: Global Wearable Computing Devices Industry Volume K Unit Forecast, by Product Type 2019 & 2032
- Table 107: Global Wearable Computing Devices Industry Revenue Million Forecast, by End User 2019 & 2032
- Table 108: Global Wearable Computing Devices Industry Volume K Unit Forecast, by End User 2019 & 2032
- Table 109: Global Wearable Computing Devices Industry Revenue Million Forecast, by Country 2019 & 2032
- Table 110: Global Wearable Computing Devices Industry Volume K Unit Forecast, by Country 2019 & 2032
- Table 111: Global Wearable Computing Devices Industry Revenue Million Forecast, by Product Type 2019 & 2032
- Table 112: Global Wearable Computing Devices Industry Volume K Unit Forecast, by Product Type 2019 & 2032
- Table 113: Global Wearable Computing Devices Industry Revenue Million Forecast, by End User 2019 & 2032
- Table 114: Global Wearable Computing Devices Industry Volume K Unit Forecast, by End User 2019 & 2032
- Table 115: Global Wearable Computing Devices Industry Revenue Million Forecast, by Country 2019 & 2032
- Table 116: Global Wearable Computing Devices Industry Volume K Unit Forecast, by Country 2019 & 2032
- Table 117: Global Wearable Computing Devices Industry Revenue Million Forecast, by Product Type 2019 & 2032
- Table 118: Global Wearable Computing Devices Industry Volume K Unit Forecast, by Product Type 2019 & 2032
- Table 119: Global Wearable Computing Devices Industry Revenue Million Forecast, by End User 2019 & 2032
- Table 120: Global Wearable Computing Devices Industry Volume K Unit Forecast, by End User 2019 & 2032
- Table 121: Global Wearable Computing Devices Industry Revenue Million Forecast, by Country 2019 & 2032
- Table 122: Global Wearable Computing Devices Industry Volume K Unit Forecast, by Country 2019 & 2032
- Table 123: Global Wearable Computing Devices Industry Revenue Million Forecast, by Product Type 2019 & 2032
- Table 124: Global Wearable Computing Devices Industry Volume K Unit Forecast, by Product Type 2019 & 2032
- Table 125: Global Wearable Computing Devices Industry Revenue Million Forecast, by End User 2019 & 2032
- Table 126: Global Wearable Computing Devices Industry Volume K Unit Forecast, by End User 2019 & 2032
- Table 127: Global Wearable Computing Devices Industry Revenue Million Forecast, by Country 2019 & 2032
- Table 128: Global Wearable Computing Devices Industry Volume K Unit Forecast, by Country 2019 & 2032
Frequently Asked Questions
1. What is the projected Compound Annual Growth Rate (CAGR) of the Wearable Computing Devices Industry?
The projected CAGR is approximately 19.90%.
2. Which companies are prominent players in the Wearable Computing Devices Industry?
Key companies in the market include Huami Corporation, Samsung Electronics Co Ltd, Transcend Information Inc, Garmin Ltd, AIQ Smart Clothing Inc, GoPro Inc, Microsoft Corporation, Medtronic PLC, Cyberdyne Inc, Fitbit Inc, Ekso Bionics Holdings Inc, Withings, Huawei Technologies Co Ltd, Sensoria Inc, Omron Healthcare Inc, Fossil Group Inc, Apple Inc, Sony Corporation, Nuheara Limited.
3. What are the main segments of the Wearable Computing Devices Industry?
The market segments include Product Type, End User.
4. Can you provide details about the market size?
The market size is estimated to be USD XX Million as of 2022.
5. What are some drivers contributing to market growth?
Increasing Technological Advancements in the Wearables Market; Increase in Health Awareness Among Consumers.
6. What are the notable trends driving market growth?
Smart Clothing Expected to Witness Significant Growth.
7. Are there any restraints impacting market growth?
Growing Complexity of Wearable Devices and Limited Use of Features. Augmented by Security Risks.
8. Can you provide examples of recent developments in the market?
October 2022- Microsoft rolled out the first batch of IVAS (Integrated Visual Augmentation System) to US Army. The headsets are designed with advanced features like night and thermal vision, tactical edge computing, situational awareness, passive targeting, and Microsoft Azure cloud computing.
9. What pricing options are available for accessing the report?
Pricing options include single-user, multi-user, and enterprise licenses priced at USD 4750, USD 5250, and USD 8750 respectively.
10. Is the market size provided in terms of value or volume?
The market size is provided in terms of value, measured in Million and volume, measured in K Unit.
11. Are there any specific market keywords associated with the report?
Yes, the market keyword associated with the report is "Wearable Computing Devices Industry," which aids in identifying and referencing the specific market segment covered.
12. How do I determine which pricing option suits my needs best?
The pricing options vary based on user requirements and access needs. Individual users may opt for single-user licenses, while businesses requiring broader access may choose multi-user or enterprise licenses for cost-effective access to the report.
13. Are there any additional resources or data provided in the Wearable Computing Devices Industry report?
While the report offers comprehensive insights, it's advisable to review the specific contents or supplementary materials provided to ascertain if additional resources or data are available.
14. How can I stay updated on further developments or reports in the Wearable Computing Devices Industry?
To stay informed about further developments, trends, and reports in the Wearable Computing Devices Industry, consider subscribing to industry newsletters, following relevant companies and organizations, or regularly checking reputable industry news sources and publications.
Methodology
Step 1 - Identification of Relevant Samples Size from Population Database


Step 2 - Approaches for Defining Global Market Size (Value, Volume* & Price*)

Note*: In applicable scenarios
Step 3 - Data Sources
Primary Research
- Web Analytics
- Survey Reports
- Research Institute
- Latest Research Reports
- Opinion Leaders
Secondary Research
- Annual Reports
- White Paper
- Latest Press Release
- Industry Association
- Paid Database
- Investor Presentations

Step 4 - Data Triangulation
Involves using different sources of information in order to increase the validity of a study
These sources are likely to be stakeholders in a program - participants, other researchers, program staff, other community members, and so on.
Then we put all data in single framework & apply various statistical tools to find out the dynamic on the market.
During the analysis stage, feedback from the stakeholder groups would be compared to determine areas of agreement as well as areas of divergence


