
Key Insights
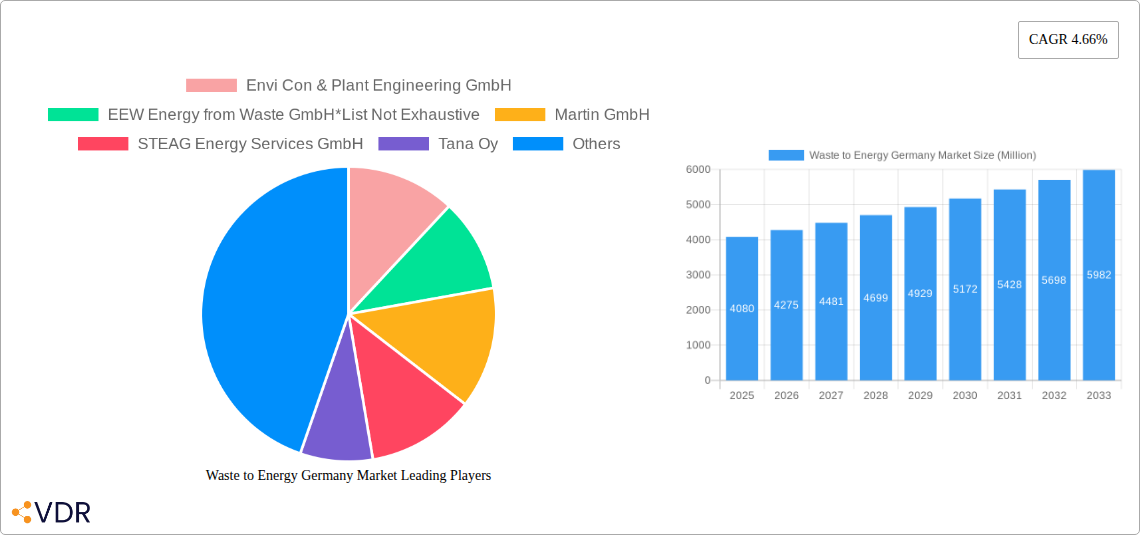
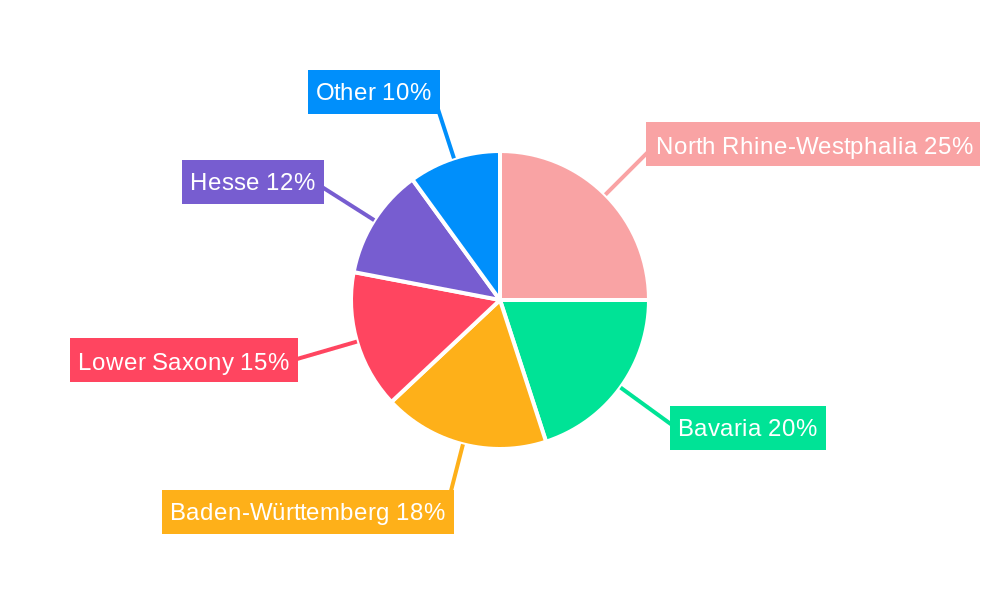
The German Waste-to-Energy (WtE) market, valued at €4.08 billion in 2025, is projected to experience robust growth, driven by stringent environmental regulations aimed at reducing landfill waste and increasing renewable energy generation. The compound annual growth rate (CAGR) of 4.66% from 2025 to 2033 indicates a significant expansion of this sector. Key drivers include increasing volumes of municipal solid waste, government incentives promoting renewable energy sources, and technological advancements in WtE technologies, particularly in thermal and biological processes. The market is segmented by technology (physical, thermal, biological) and product type (incinerators, gasifiers, anaerobic digesters). Thermal technologies, including incineration, currently dominate the market due to their established infrastructure and energy efficiency. However, biological technologies like anaerobic digestion are expected to witness significant growth fueled by increasing interest in biogas production and the circular economy. Leading players like Envi Con & Plant Engineering GmbH, EEW Energy from Waste GmbH, and Martin GmbH are leveraging technological innovations and strategic partnerships to consolidate their market share. The geographical distribution is concentrated in populous states like North Rhine-Westphalia, Bavaria, Baden-Württemberg, Lower Saxony, and Hesse, reflecting the high waste generation in these regions. The market faces some restraints, primarily the high capital investment required for WtE plants and potential public resistance related to environmental concerns and siting of facilities.
The forecast period (2025-2033) presents significant opportunities for market expansion, particularly in leveraging advanced technologies like gasification to increase energy recovery efficiency and minimize environmental impact. The increasing focus on sustainable waste management practices, combined with governmental support for renewable energy targets, will further propel market growth. However, addressing public perception challenges and ensuring the efficient integration of diverse WtE technologies will be crucial for sustained and responsible market development. The market's growth trajectory will depend on the effective implementation of environmental policies, continuous technological improvements, and strategic investments in the WtE infrastructure across Germany.
Waste to Energy Germany Market Report: 2019-2033
This comprehensive report provides a detailed analysis of the Waste to Energy (WtE) market in Germany, covering the period from 2019 to 2033. It offers invaluable insights for industry professionals, investors, and stakeholders seeking to understand the market dynamics, growth trends, and future opportunities within this crucial sector. The report segments the market by technology (Physical, Thermal, Biological) and product type (Incinerators, Gasifiers, Anaerobic Digesters), providing a granular view of the landscape. The parent market is the broader German renewable energy sector, while the child market is the specific WtE segment within Germany. Market size is presented in million units.
Waste to Energy Germany Market Dynamics & Structure
This section analyzes the competitive landscape, technological advancements, regulatory environment, and market forces shaping the German WtE market. We examine market concentration, highlighting the roles of key players such as Envi Con & Plant Engineering GmbH, EEW Energy from Waste GmbH, Martin GmbH, STEAG Energy Services GmbH, and Tana Oy (list not exhaustive). The analysis incorporates quantitative data on market share and M&A activity (xx deals in the historical period, with a projected xx in the forecast period), alongside qualitative assessments of innovation barriers and regulatory impacts.
- Market Concentration: The German WtE market exhibits a [Describe level of concentration: e.g., moderately concentrated] structure, with [Percentage]% market share held by the top [Number] players in 2024.
- Technological Innovation: Key drivers include advancements in [Specific technologies e.g., gasification, plasma technology] leading to increased efficiency and reduced emissions. Barriers include [e.g., high initial investment costs, complex permitting processes].
- Regulatory Framework: Stringent environmental regulations and supportive government policies [e.g., Renewable Energy Act] are key drivers of market growth. However, evolving regulations [Explain specific regulations and their impact] present both opportunities and challenges.
- Competitive Substitutes: Competition exists from other renewable energy sources [e.g., solar, wind], landfill disposal, and waste recycling. The competitive landscape is [Describe the competitive intensity: e.g., moderately competitive] due to [Reasons].
- End-User Demographics: The primary end-users are [e.g., municipalities, industrial facilities], with a growing demand for WtE solutions driven by [Reasons e.g., increasing waste generation, stringent landfill regulations].
- M&A Trends: The market has witnessed [Number] mergers and acquisitions between [Years] driven by [Reasons e.g., consolidation, expansion into new technologies].
Waste to Energy Germany Market Growth Trends & Insights
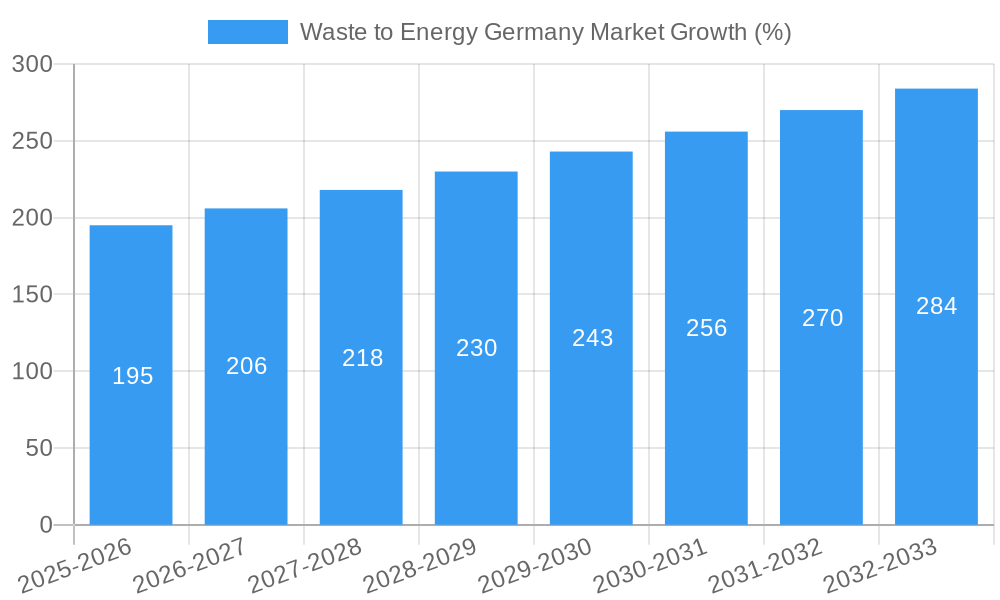
This section details the historical and projected growth of the German WtE market from 2019 to 2033. Utilizing comprehensive data analysis (XXX), we illustrate market size evolution, adoption rates across different segments, technological disruptions, and shifts in consumer behavior. Specific metrics such as Compound Annual Growth Rate (CAGR) and market penetration rates are provided for each segment. The analysis considers factors like increasing waste generation, tightening environmental regulations, and government incentives promoting renewable energy. The report projects a CAGR of xx% from 2025 to 2033, reaching a market size of xx million units by 2033.
Dominant Regions, Countries, or Segments in Waste to Energy Germany Market
This section identifies the leading regions, countries, or market segments driving growth within the German WtE market. We analyze the dominance factors, including market share, growth potential, and key drivers such as economic policies, infrastructure development, and regional waste generation patterns. The analysis focuses on the performance of Physical, Thermal, and Biological technologies, along with the market share of Incinerators, Gasifiers, and Anaerobic Digesters.
- Leading Region/Segment: [e.g., Bavaria] is the leading region due to [Reasons: e.g., supportive government policies, high waste generation].
- Key Drivers:
- Favorable government policies and incentives.
- Increasing waste generation and landfill capacity constraints.
- Growing demand for district heating and renewable energy.
- Technological advancements leading to improved efficiency and reduced emissions.
Waste to Energy Germany Market Product Landscape
This section details the innovations, applications, and performance metrics of various WtE technologies and product types. We examine the unique selling propositions (USPs) of different products, highlighting technological advancements like [e.g., improved combustion efficiency, advanced gas cleaning systems]. The market is characterized by a diverse product portfolio, with a range of technologies catering to specific waste types and energy needs. [Describe specific advancements in each product type].
Key Drivers, Barriers & Challenges in Waste to Energy Germany Market
This section outlines the key factors driving market growth and the challenges hindering its expansion.
Key Drivers:
- Growing environmental awareness and stringent waste management regulations.
- Increasing energy demand and the need for renewable energy sources.
- Government incentives and subsidies for renewable energy projects.
- Technological advancements leading to improved efficiency and reduced emissions.
Key Challenges:
- High capital investment costs associated with WtE plant construction.
- Complex permitting and regulatory processes.
- Public perception and concerns regarding potential environmental impacts.
- Competition from other renewable energy sources and waste management technologies. (xx% market share lost due to competition in 2024).
Emerging Opportunities in Waste to Energy Germany Market
This section identifies emerging trends and untapped market opportunities. These include the integration of WtE plants with other energy systems (e.g., district heating networks), the utilization of advanced technologies for waste preprocessing and resource recovery, and the exploration of new feedstocks for WtE processes.
Growth Accelerators in the Waste to Energy Germany Market Industry
Long-term growth will be driven by technological innovation focused on improving efficiency and reducing emissions, strategic partnerships between WtE operators and other stakeholders (e.g., energy providers), and expansion into new geographical markets with high waste generation potential. The development of integrated waste management solutions that combine WtE with recycling and resource recovery will also play a crucial role.
Key Players Shaping the Waste to Energy Germany Market Market
- Envi Con & Plant Engineering GmbH
- EEW Energy from Waste GmbH
- Martin GmbH
- STEAG Energy Services GmbH
- Tana Oy
Notable Milestones in Waste to Energy Germany Market Sector
- May 2023: Gemeinsames Unternehmen für Abfallwirtschaft (GfA) announced the construction of a waste-to-energy plant in Geiselbullach, Bavaria, utilizing geothermal resources.
- January 2022: Doosan Heavy Industries & Construction Co. received a USD 134 million order to construct a WtE plant in Wiesbaden.
In-Depth Waste to Energy Germany Market Market Outlook
The future of the German WtE market is promising, driven by sustained growth in waste generation, stringent environmental regulations, and a strong push towards renewable energy. Strategic opportunities lie in technological innovation, optimized waste management solutions, and expanding into underserved regions. The market is poised for significant expansion, with considerable potential for growth across various segments.
Waste to Energy Germany Market Segmentation
-
1. Technology
- 1.1. Physical
- 1.2. Thermal
- 1.3. Biological
Waste to Energy Germany Market Segmentation By Geography
-
1. North America
- 1.1. United States
- 1.2. Canada
- 1.3. Mexico
-
2. South America
- 2.1. Brazil
- 2.2. Argentina
- 2.3. Rest of South America
-
3. Europe
- 3.1. United Kingdom
- 3.2. Germany
- 3.3. France
- 3.4. Italy
- 3.5. Spain
- 3.6. Russia
- 3.7. Benelux
- 3.8. Nordics
- 3.9. Rest of Europe
-
4. Middle East & Africa
- 4.1. Turkey
- 4.2. Israel
- 4.3. GCC
- 4.4. North Africa
- 4.5. South Africa
- 4.6. Rest of Middle East & Africa
-
5. Asia Pacific
- 5.1. China
- 5.2. India
- 5.3. Japan
- 5.4. South Korea
- 5.5. ASEAN
- 5.6. Oceania
- 5.7. Rest of Asia Pacific
Waste to Energy Germany Market REPORT HIGHLIGHTS
| Aspects | Details |
|---|---|
| Study Period | 2019-2033 |
| Base Year | 2024 |
| Estimated Year | 2025 |
| Forecast Period | 2025-2033 |
| Historical Period | 2019-2024 |
| Growth Rate | CAGR of 4.66% from 2019-2033 |
| Segmentation |
|
Table of Contents
- 1. Introduction
- 1.1. Research Scope
- 1.2. Market Segmentation
- 1.3. Research Methodology
- 1.4. Definitions and Assumptions
- 2. Executive Summary
- 2.1. Introduction
- 3. Market Dynamics
- 3.1. Introduction
- 3.2. Market Drivers
- 3.2.1. 4.; The High Amount of Waste Generation in the Country4.; The growing Focus on Non-Fossil Fuel Sources
- 3.3. Market Restrains
- 3.3.1. 4.; The Recycling Rate of Waste in Germany
- 3.4. Market Trends
- 3.4.1. Thermal Based Waste-to-Energy Conversion is Dominating the Market
- 4. Market Factor Analysis
- 4.1. Porters Five Forces
- 4.2. Supply/Value Chain
- 4.3. PESTEL analysis
- 4.4. Market Entropy
- 4.5. Patent/Trademark Analysis
- 5. Global Waste to Energy Germany Market Analysis, Insights and Forecast, 2019-2031
- 5.1. Market Analysis, Insights and Forecast - by Technology
- 5.1.1. Physical
- 5.1.2. Thermal
- 5.1.3. Biological
- 5.2. Market Analysis, Insights and Forecast - by Region
- 5.2.1. North America
- 5.2.2. South America
- 5.2.3. Europe
- 5.2.4. Middle East & Africa
- 5.2.5. Asia Pacific
- 5.1. Market Analysis, Insights and Forecast - by Technology
- 6. North America Waste to Energy Germany Market Analysis, Insights and Forecast, 2019-2031
- 6.1. Market Analysis, Insights and Forecast - by Technology
- 6.1.1. Physical
- 6.1.2. Thermal
- 6.1.3. Biological
- 6.1. Market Analysis, Insights and Forecast - by Technology
- 7. South America Waste to Energy Germany Market Analysis, Insights and Forecast, 2019-2031
- 7.1. Market Analysis, Insights and Forecast - by Technology
- 7.1.1. Physical
- 7.1.2. Thermal
- 7.1.3. Biological
- 7.1. Market Analysis, Insights and Forecast - by Technology
- 8. Europe Waste to Energy Germany Market Analysis, Insights and Forecast, 2019-2031
- 8.1. Market Analysis, Insights and Forecast - by Technology
- 8.1.1. Physical
- 8.1.2. Thermal
- 8.1.3. Biological
- 8.1. Market Analysis, Insights and Forecast - by Technology
- 9. Middle East & Africa Waste to Energy Germany Market Analysis, Insights and Forecast, 2019-2031
- 9.1. Market Analysis, Insights and Forecast - by Technology
- 9.1.1. Physical
- 9.1.2. Thermal
- 9.1.3. Biological
- 9.1. Market Analysis, Insights and Forecast - by Technology
- 10. Asia Pacific Waste to Energy Germany Market Analysis, Insights and Forecast, 2019-2031
- 10.1. Market Analysis, Insights and Forecast - by Technology
- 10.1.1. Physical
- 10.1.2. Thermal
- 10.1.3. Biological
- 10.1. Market Analysis, Insights and Forecast - by Technology
- 11. North Rhine-Westphalia Waste to Energy Germany Market Analysis, Insights and Forecast, 2019-2031
- 12. Bavaria Waste to Energy Germany Market Analysis, Insights and Forecast, 2019-2031
- 13. Baden-Württemberg Waste to Energy Germany Market Analysis, Insights and Forecast, 2019-2031
- 14. Lower Saxony Waste to Energy Germany Market Analysis, Insights and Forecast, 2019-2031
- 15. Hesse Waste to Energy Germany Market Analysis, Insights and Forecast, 2019-2031
- 16. Competitive Analysis
- 16.1. Global Market Share Analysis 2024
- 16.2. Company Profiles
- 16.2.1 Envi Con & Plant Engineering GmbH
- 16.2.1.1. Overview
- 16.2.1.2. Products
- 16.2.1.3. SWOT Analysis
- 16.2.1.4. Recent Developments
- 16.2.1.5. Financials (Based on Availability)
- 16.2.2 EEW Energy from Waste GmbH*List Not Exhaustive
- 16.2.2.1. Overview
- 16.2.2.2. Products
- 16.2.2.3. SWOT Analysis
- 16.2.2.4. Recent Developments
- 16.2.2.5. Financials (Based on Availability)
- 16.2.3 Martin GmbH
- 16.2.3.1. Overview
- 16.2.3.2. Products
- 16.2.3.3. SWOT Analysis
- 16.2.3.4. Recent Developments
- 16.2.3.5. Financials (Based on Availability)
- 16.2.4 STEAG Energy Services GmbH
- 16.2.4.1. Overview
- 16.2.4.2. Products
- 16.2.4.3. SWOT Analysis
- 16.2.4.4. Recent Developments
- 16.2.4.5. Financials (Based on Availability)
- 16.2.5 Tana Oy
- 16.2.5.1. Overview
- 16.2.5.2. Products
- 16.2.5.3. SWOT Analysis
- 16.2.5.4. Recent Developments
- 16.2.5.5. Financials (Based on Availability)
- 16.2.1 Envi Con & Plant Engineering GmbH
List of Figures
- Figure 1: Global Waste to Energy Germany Market Revenue Breakdown (Million, %) by Region 2024 & 2032
- Figure 2: Germany Waste to Energy Germany Market Revenue (Million), by Country 2024 & 2032
- Figure 3: Germany Waste to Energy Germany Market Revenue Share (%), by Country 2024 & 2032
- Figure 4: North America Waste to Energy Germany Market Revenue (Million), by Technology 2024 & 2032
- Figure 5: North America Waste to Energy Germany Market Revenue Share (%), by Technology 2024 & 2032
- Figure 6: North America Waste to Energy Germany Market Revenue (Million), by Country 2024 & 2032
- Figure 7: North America Waste to Energy Germany Market Revenue Share (%), by Country 2024 & 2032
- Figure 8: South America Waste to Energy Germany Market Revenue (Million), by Technology 2024 & 2032
- Figure 9: South America Waste to Energy Germany Market Revenue Share (%), by Technology 2024 & 2032
- Figure 10: South America Waste to Energy Germany Market Revenue (Million), by Country 2024 & 2032
- Figure 11: South America Waste to Energy Germany Market Revenue Share (%), by Country 2024 & 2032
- Figure 12: Europe Waste to Energy Germany Market Revenue (Million), by Technology 2024 & 2032
- Figure 13: Europe Waste to Energy Germany Market Revenue Share (%), by Technology 2024 & 2032
- Figure 14: Europe Waste to Energy Germany Market Revenue (Million), by Country 2024 & 2032
- Figure 15: Europe Waste to Energy Germany Market Revenue Share (%), by Country 2024 & 2032
- Figure 16: Middle East & Africa Waste to Energy Germany Market Revenue (Million), by Technology 2024 & 2032
- Figure 17: Middle East & Africa Waste to Energy Germany Market Revenue Share (%), by Technology 2024 & 2032
- Figure 18: Middle East & Africa Waste to Energy Germany Market Revenue (Million), by Country 2024 & 2032
- Figure 19: Middle East & Africa Waste to Energy Germany Market Revenue Share (%), by Country 2024 & 2032
- Figure 20: Asia Pacific Waste to Energy Germany Market Revenue (Million), by Technology 2024 & 2032
- Figure 21: Asia Pacific Waste to Energy Germany Market Revenue Share (%), by Technology 2024 & 2032
- Figure 22: Asia Pacific Waste to Energy Germany Market Revenue (Million), by Country 2024 & 2032
- Figure 23: Asia Pacific Waste to Energy Germany Market Revenue Share (%), by Country 2024 & 2032
List of Tables
- Table 1: Global Waste to Energy Germany Market Revenue Million Forecast, by Region 2019 & 2032
- Table 2: Global Waste to Energy Germany Market Revenue Million Forecast, by Technology 2019 & 2032
- Table 3: Global Waste to Energy Germany Market Revenue Million Forecast, by Region 2019 & 2032
- Table 4: Global Waste to Energy Germany Market Revenue Million Forecast, by Country 2019 & 2032
- Table 5: North Rhine-Westphalia Waste to Energy Germany Market Revenue (Million) Forecast, by Application 2019 & 2032
- Table 6: Bavaria Waste to Energy Germany Market Revenue (Million) Forecast, by Application 2019 & 2032
- Table 7: Baden-Württemberg Waste to Energy Germany Market Revenue (Million) Forecast, by Application 2019 & 2032
- Table 8: Lower Saxony Waste to Energy Germany Market Revenue (Million) Forecast, by Application 2019 & 2032
- Table 9: Hesse Waste to Energy Germany Market Revenue (Million) Forecast, by Application 2019 & 2032
- Table 10: Global Waste to Energy Germany Market Revenue Million Forecast, by Technology 2019 & 2032
- Table 11: Global Waste to Energy Germany Market Revenue Million Forecast, by Country 2019 & 2032
- Table 12: United States Waste to Energy Germany Market Revenue (Million) Forecast, by Application 2019 & 2032
- Table 13: Canada Waste to Energy Germany Market Revenue (Million) Forecast, by Application 2019 & 2032
- Table 14: Mexico Waste to Energy Germany Market Revenue (Million) Forecast, by Application 2019 & 2032
- Table 15: Global Waste to Energy Germany Market Revenue Million Forecast, by Technology 2019 & 2032
- Table 16: Global Waste to Energy Germany Market Revenue Million Forecast, by Country 2019 & 2032
- Table 17: Brazil Waste to Energy Germany Market Revenue (Million) Forecast, by Application 2019 & 2032
- Table 18: Argentina Waste to Energy Germany Market Revenue (Million) Forecast, by Application 2019 & 2032
- Table 19: Rest of South America Waste to Energy Germany Market Revenue (Million) Forecast, by Application 2019 & 2032
- Table 20: Global Waste to Energy Germany Market Revenue Million Forecast, by Technology 2019 & 2032
- Table 21: Global Waste to Energy Germany Market Revenue Million Forecast, by Country 2019 & 2032
- Table 22: United Kingdom Waste to Energy Germany Market Revenue (Million) Forecast, by Application 2019 & 2032
- Table 23: Germany Waste to Energy Germany Market Revenue (Million) Forecast, by Application 2019 & 2032
- Table 24: France Waste to Energy Germany Market Revenue (Million) Forecast, by Application 2019 & 2032
- Table 25: Italy Waste to Energy Germany Market Revenue (Million) Forecast, by Application 2019 & 2032
- Table 26: Spain Waste to Energy Germany Market Revenue (Million) Forecast, by Application 2019 & 2032
- Table 27: Russia Waste to Energy Germany Market Revenue (Million) Forecast, by Application 2019 & 2032
- Table 28: Benelux Waste to Energy Germany Market Revenue (Million) Forecast, by Application 2019 & 2032
- Table 29: Nordics Waste to Energy Germany Market Revenue (Million) Forecast, by Application 2019 & 2032
- Table 30: Rest of Europe Waste to Energy Germany Market Revenue (Million) Forecast, by Application 2019 & 2032
- Table 31: Global Waste to Energy Germany Market Revenue Million Forecast, by Technology 2019 & 2032
- Table 32: Global Waste to Energy Germany Market Revenue Million Forecast, by Country 2019 & 2032
- Table 33: Turkey Waste to Energy Germany Market Revenue (Million) Forecast, by Application 2019 & 2032
- Table 34: Israel Waste to Energy Germany Market Revenue (Million) Forecast, by Application 2019 & 2032
- Table 35: GCC Waste to Energy Germany Market Revenue (Million) Forecast, by Application 2019 & 2032
- Table 36: North Africa Waste to Energy Germany Market Revenue (Million) Forecast, by Application 2019 & 2032
- Table 37: South Africa Waste to Energy Germany Market Revenue (Million) Forecast, by Application 2019 & 2032
- Table 38: Rest of Middle East & Africa Waste to Energy Germany Market Revenue (Million) Forecast, by Application 2019 & 2032
- Table 39: Global Waste to Energy Germany Market Revenue Million Forecast, by Technology 2019 & 2032
- Table 40: Global Waste to Energy Germany Market Revenue Million Forecast, by Country 2019 & 2032
- Table 41: China Waste to Energy Germany Market Revenue (Million) Forecast, by Application 2019 & 2032
- Table 42: India Waste to Energy Germany Market Revenue (Million) Forecast, by Application 2019 & 2032
- Table 43: Japan Waste to Energy Germany Market Revenue (Million) Forecast, by Application 2019 & 2032
- Table 44: South Korea Waste to Energy Germany Market Revenue (Million) Forecast, by Application 2019 & 2032
- Table 45: ASEAN Waste to Energy Germany Market Revenue (Million) Forecast, by Application 2019 & 2032
- Table 46: Oceania Waste to Energy Germany Market Revenue (Million) Forecast, by Application 2019 & 2032
- Table 47: Rest of Asia Pacific Waste to Energy Germany Market Revenue (Million) Forecast, by Application 2019 & 2032
Frequently Asked Questions
1. What is the projected Compound Annual Growth Rate (CAGR) of the Waste to Energy Germany Market?
The projected CAGR is approximately 4.66%.
2. Which companies are prominent players in the Waste to Energy Germany Market?
Key companies in the market include Envi Con & Plant Engineering GmbH, EEW Energy from Waste GmbH*List Not Exhaustive, Martin GmbH, STEAG Energy Services GmbH, Tana Oy.
3. What are the main segments of the Waste to Energy Germany Market?
The market segments include Technology.
4. Can you provide details about the market size?
The market size is estimated to be USD 4.08 Million as of 2022.
5. What are some drivers contributing to market growth?
4.; The High Amount of Waste Generation in the Country4.; The growing Focus on Non-Fossil Fuel Sources.
6. What are the notable trends driving market growth?
Thermal Based Waste-to-Energy Conversion is Dominating the Market.
7. Are there any restraints impacting market growth?
4.; The Recycling Rate of Waste in Germany.
8. Can you provide examples of recent developments in the market?
In May 2023, the municipal waste management company Gemeinsames Unternehmen für Abfallwirtschaft (GfA) announced the start of the construction of the waste-to-energy plant in Geiselbullach, located in the state of Bavaria, Germany. The plant aims to tap into geothermal resources to provide an alternative source for the existing district heating network
9. What pricing options are available for accessing the report?
Pricing options include single-user, multi-user, and enterprise licenses priced at USD 3800, USD 4500, and USD 5800 respectively.
10. Is the market size provided in terms of value or volume?
The market size is provided in terms of value, measured in Million.
11. Are there any specific market keywords associated with the report?
Yes, the market keyword associated with the report is "Waste to Energy Germany Market," which aids in identifying and referencing the specific market segment covered.
12. How do I determine which pricing option suits my needs best?
The pricing options vary based on user requirements and access needs. Individual users may opt for single-user licenses, while businesses requiring broader access may choose multi-user or enterprise licenses for cost-effective access to the report.
13. Are there any additional resources or data provided in the Waste to Energy Germany Market report?
While the report offers comprehensive insights, it's advisable to review the specific contents or supplementary materials provided to ascertain if additional resources or data are available.
14. How can I stay updated on further developments or reports in the Waste to Energy Germany Market?
To stay informed about further developments, trends, and reports in the Waste to Energy Germany Market, consider subscribing to industry newsletters, following relevant companies and organizations, or regularly checking reputable industry news sources and publications.
Methodology
Step 1 - Identification of Relevant Samples Size from Population Database


Step 2 - Approaches for Defining Global Market Size (Value, Volume* & Price*)

Note*: In applicable scenarios
Step 3 - Data Sources
Primary Research
- Web Analytics
- Survey Reports
- Research Institute
- Latest Research Reports
- Opinion Leaders
Secondary Research
- Annual Reports
- White Paper
- Latest Press Release
- Industry Association
- Paid Database
- Investor Presentations

Step 4 - Data Triangulation
Involves using different sources of information in order to increase the validity of a study
These sources are likely to be stakeholders in a program - participants, other researchers, program staff, other community members, and so on.
Then we put all data in single framework & apply various statistical tools to find out the dynamic on the market.
During the analysis stage, feedback from the stakeholder groups would be compared to determine areas of agreement as well as areas of divergence


