

Key Insights
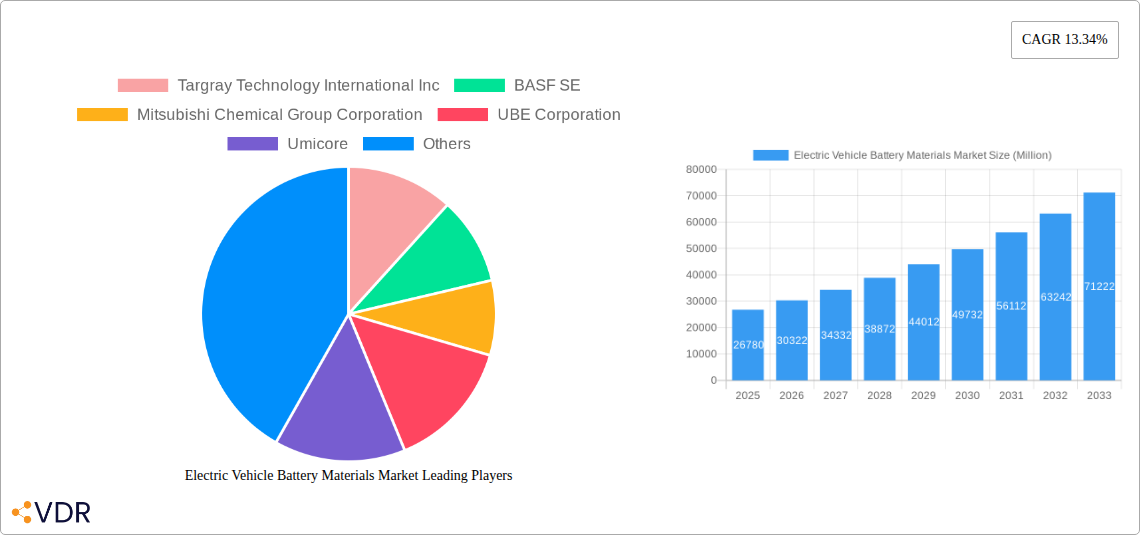
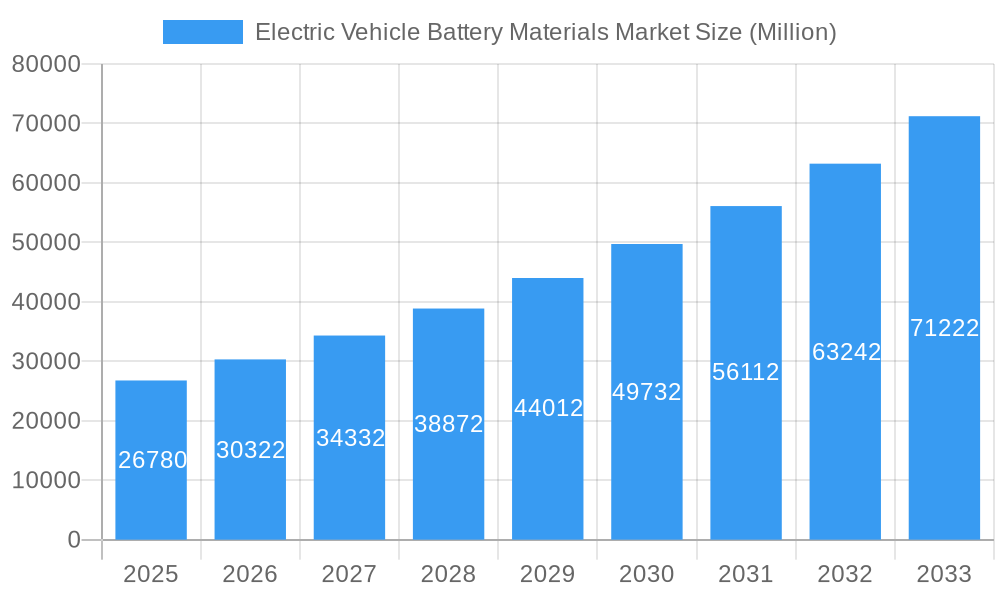
The Electric Vehicle (EV) Battery Materials market is experiencing robust growth, projected to reach \$26.78 billion in 2025 and exhibiting a Compound Annual Growth Rate (CAGR) of 13.34% from 2025 to 2033. This expansion is fueled by the accelerating global adoption of electric vehicles driven by environmental concerns, stringent emission regulations, and government incentives promoting sustainable transportation. Key drivers include increasing demand for high-energy-density batteries, advancements in battery technologies (like solid-state batteries), and the rising investments in EV infrastructure globally. Furthermore, the continuous improvement in battery performance, lifespan, and cost-effectiveness is significantly contributing to market growth. Leading companies like Targray Technology International Inc, BASF SE, and others are strategically investing in research and development, expanding their production capacities, and forging partnerships to capitalize on this burgeoning market. The market segmentation likely includes materials like lithium, cobalt, nickel, manganese, graphite, and others, each with its own growth trajectory influenced by factors such as resource availability, price volatility, and technological advancements in battery chemistry.
Electric Vehicle Battery Materials Market Market Size (In Billion)
The market's growth, however, is not without challenges. Supply chain disruptions, particularly concerning raw material sourcing and geopolitical factors influencing the availability of critical minerals, pose significant restraints. Price fluctuations in these raw materials can impact profitability and overall market stability. Furthermore, concerns regarding the environmental impact of battery production and disposal are prompting the industry to focus on sustainable sourcing and recycling practices. Despite these restraints, the long-term outlook for the EV Battery Materials market remains exceptionally positive, driven by the unstoppable trend towards electric mobility and the ongoing innovation within the battery technology sector. The market's future trajectory will significantly depend on advancements in battery chemistry, efficient recycling processes, and the establishment of robust and secure supply chains for crucial raw materials.
Electric Vehicle Battery Materials Market Company Market Share
Electric Vehicle Battery Materials Market: A Comprehensive Report (2019-2033)
This comprehensive report provides a deep dive into the dynamic Electric Vehicle (EV) Battery Materials market, analyzing its current state, future trajectory, and key players. Spanning the period 2019-2033, with a focus on 2025, this report is an essential resource for industry professionals, investors, and strategic decision-makers seeking to navigate this rapidly evolving landscape. The report delves into both the parent market (Battery Materials) and the child market (EV Battery Materials), offering a nuanced understanding of market segmentation and growth drivers. The market size is projected to reach xx Million units by 2033.
Electric Vehicle Battery Materials Market Dynamics & Structure
This section analyzes the intricate interplay of factors shaping the EV battery materials market. We examine market concentration, revealing the dominance of key players and exploring potential shifts in market share. Technological innovation, including advancements in battery chemistry and manufacturing processes, is critically assessed. The report also incorporates an in-depth analysis of the regulatory landscape, encompassing government policies, environmental regulations, and safety standards impacting market growth. The influence of competitive product substitutes, such as alternative energy storage technologies, is carefully considered. Further, we examine the evolving end-user demographics, focusing on the adoption rates among different consumer segments. Finally, a detailed examination of mergers and acquisitions (M&A) trends, including deal volumes and their impact on market consolidation, is provided.
- Market Concentration: xx% of the market is controlled by the top 5 players in 2025.
- M&A Activity: xx deals were recorded between 2019 and 2024, with an average deal value of xx Million units.
- Innovation Barriers: High R&D costs and lengthy development cycles pose significant hurdles to innovation.
- Regulatory Landscape: Stringent environmental regulations are driving the demand for sustainable battery materials.
Electric Vehicle Battery Materials Market Growth Trends & Insights
This section provides a comprehensive overview of the EV battery materials market's growth trajectory. Leveraging extensive data analysis, we present a detailed picture of market size evolution throughout the historical period (2019-2024) and forecast period (2025-2033). Key metrics like Compound Annual Growth Rate (CAGR) and market penetration are meticulously analyzed to provide a granular understanding of market dynamics. Furthermore, we explore the impact of technological disruptions, such as the emergence of solid-state batteries and advancements in battery management systems, on market growth. Finally, we delve into the shifting consumer behavior, examining factors such as increasing environmental awareness and the growing preference for electric vehicles. The CAGR for the forecast period is estimated to be xx%. Market penetration is projected to reach xx% by 2033.
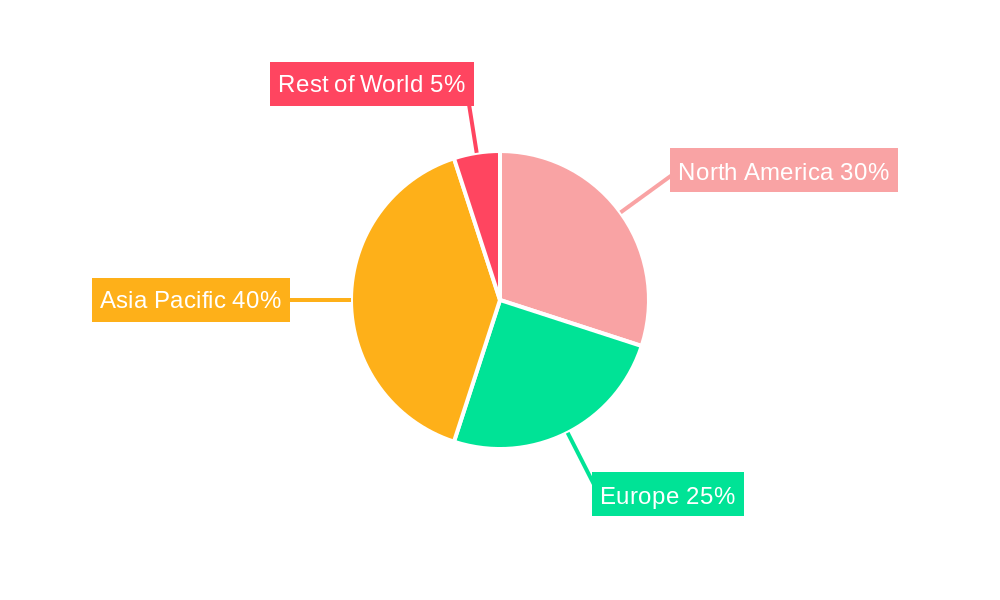
Dominant Regions, Countries, or Segments in Electric Vehicle Battery Materials Market
This section identifies the leading regions, countries, and segments driving the growth of the EV battery materials market. A detailed analysis of market share and growth potential for each prominent region is provided. Key drivers, such as supportive government policies, robust infrastructure development, and flourishing EV adoption rates, are meticulously highlighted through bullet points. The analysis explores dominance factors, including favorable economic conditions, technological advancements, and strategic investments.
- Leading Region: Asia-Pacific (xx% market share in 2025).
- Key Drivers in Asia-Pacific: Government incentives for EV adoption, strong manufacturing base, and growing demand from China and India.
- Growth Potential: Significant growth is anticipated in North America and Europe due to rising EV sales and investments in battery manufacturing facilities.
Electric Vehicle Battery Materials Market Product Landscape
This section offers a concise overview of product innovations, applications, and performance metrics in the EV battery materials market. It highlights the unique selling propositions of various battery materials and emphasizes recent technological advancements, such as improvements in energy density, lifespan, and safety. The current focus is on improving the performance and reducing the cost of lithium-ion batteries.
Key Drivers, Barriers & Challenges in Electric Vehicle Battery Materials Market
This section details the primary drivers propelling market growth. These include technological advancements, supportive government policies and incentives, and increasing consumer demand for electric vehicles. Specific examples such as the development of high energy density cathodes and anodes are discussed. The section also identifies key challenges, such as supply chain disruptions, raw material price volatility, and the need to address environmental concerns associated with battery production and disposal. These challenges are analyzed with quantifiable impacts.
- Key Drivers: Technological advancements in battery chemistry, supportive government policies, rising demand for electric vehicles.
- Key Challenges: Supply chain bottlenecks, price volatility of raw materials, environmental concerns related to battery lifecycle.
Emerging Opportunities in Electric Vehicle Battery Materials Market
This section highlights emerging trends and opportunities within the EV battery materials market. Focus is given to untapped market segments, the development of innovative battery technologies such as solid-state batteries, and the growing consumer preference for sustainable and eco-friendly battery solutions.
Growth Accelerators in the Electric Vehicle Battery Materials Market Industry
This section discusses long-term growth catalysts, emphasizing technological breakthroughs such as improved battery chemistries and manufacturing processes, strategic partnerships between battery material manufacturers and EV makers, and market expansion strategies targeting emerging economies. The focus is on factors that will sustain the market's upward trajectory.
Key Players Shaping the Electric Vehicle Battery Materials Market Market
- Targray Technology International Inc
- BASF SE (BASF SE)
- Mitsubishi Chemical Group Corporation (Mitsubishi Chemical Group Corporation)
- UBE Corporation (UBE Corporation)
- Umicore (Umicore)
- Sumitomo Chemical Co Ltd (Sumitomo Chemical Co Ltd)
- Nichia Corporation (Nichia Corporation)
- ENTEK International LLC
- Arkema SA (Arkema SA)
- Kureha Corporation (Kureha Corporation)
- List Not Exhaustive
Notable Milestones in Electric Vehicle Battery Materials Market Sector
- January 2024: 24M introduced the 24M ImpervioTM battery separator, significantly enhancing battery safety for both lithium-ion and lithium-metal batteries.
- January 2024: MIT researchers developed a novel lithium-ion battery with an organic material-based cathode, potentially reducing reliance on cobalt and nickel.
In-Depth Electric Vehicle Battery Materials Market Outlook
The future of the EV battery materials market looks promising, driven by the continued growth of the electric vehicle sector and ongoing technological advancements in battery technology. Strategic partnerships and investments in R&D are expected to accelerate innovation, leading to higher energy density, longer lifespan, and improved safety of EV batteries. This will further drive market expansion and create significant opportunities for players across the value chain.
Electric Vehicle Battery Materials Market Segmentation
-
1. Battery Type
- 1.1. Lithium-ion
- 1.2. Lead-acid
- 1.3. Other Battery Types
-
2. Material
- 2.1. Anode
- 2.2. Cathode
- 2.3. Separator
- 2.4. Electrolyte
- 2.5. Other Materials
Electric Vehicle Battery Materials Market Segmentation By Geography
-
1. North America
- 1.1. United States
- 1.2. Canada
- 1.3. Rest of North America
-
2. Europe
- 2.1. Germany
- 2.2. France
- 2.3. United Kingdom
- 2.4. Italy
- 2.5. Spain
- 2.6. NORDIC
- 2.7. Russia
- 2.8. Turkey
- 2.9. Rest of Europe
-
3. Asia Pacific
- 3.1. China
- 3.2. India
- 3.3. Australia
- 3.4. Japan
- 3.5. South Korea
- 3.6. Malaysia
- 3.7. Thailand
- 3.8. Indonesia
- 3.9. Vietnam
- 3.10. Rest of Asia Pacific
-
4. Middle East and Africa
- 4.1. Saudi Arabia
- 4.2. United Arab Emirates
- 4.3. Nigeria
- 4.4. Egypt
- 4.5. Qatar
- 4.6. South Africa
- 4.7. Rest of Middle East and Africa
-
5. South America
- 5.1. Brazil
- 5.2. Argentina
- 5.3. Colombia
- 5.4. Rest of South America
Electric Vehicle Battery Materials Market Regional Market Share
Geographic Coverage of Electric Vehicle Battery Materials Market
Electric Vehicle Battery Materials Market REPORT HIGHLIGHTS
| Aspects | Details |
|---|---|
| Study Period | 2020-2034 |
| Base Year | 2025 |
| Estimated Year | 2026 |
| Forecast Period | 2026-2034 |
| Historical Period | 2020-2025 |
| Growth Rate | CAGR of 13.34% from 2020-2034 |
| Segmentation |
|
Table of Contents
- 1. Introduction
- 1.1. Research Scope
- 1.2. Market Segmentation
- 1.3. Research Objective
- 1.4. Definitions and Assumptions
- 2. Executive Summary
- 2.1. Market Snapshot
- 3. Market Dynamics
- 3.1. Market Drivers
- 3.2. Market Restrains
- 3.3. Market Trends
- 3.4. Market Opportunities
- 4. Market Factor Analysis
- 4.1. Porters Five Forces
- 4.1.1. Bargaining Power of Suppliers
- 4.1.2. Bargaining Power of Buyers
- 4.1.3. Threat of New Entrants
- 4.1.4. Threat of Substitutes
- 4.1.5. Competitive Rivalry
- 4.2. PESTEL analysis
- 4.3. BCG Analysis
- 4.3.1. Stars (High Growth, High Market Share)
- 4.3.2. Cash Cows (Low Growth, High Market Share)
- 4.3.3. Question Mark (High Growth, Low Market Share)
- 4.3.4. Dogs (Low Growth, Low Market Share)
- 4.4. Ansoff Matrix Analysis
- 4.5. Supply Chain Analysis
- 4.6. Regulatory Landscape
- 4.7. Current Market Potential and Opportunity Assessment (TAM–SAM–SOM Framework)
- 4.8. VDR Analyst Note
- 4.1. Porters Five Forces
- 5. Market Analysis, Insights and Forecast 2021-2033
- 5.1. Market Analysis, Insights and Forecast - by Battery Type
- 5.1.1. Lithium-ion
- 5.1.2. Lead-acid
- 5.1.3. Other Battery Types
- 5.2. Market Analysis, Insights and Forecast - by Material
- 5.2.1. Anode
- 5.2.2. Cathode
- 5.2.3. Separator
- 5.2.4. Electrolyte
- 5.2.5. Other Materials
- 5.3. Market Analysis, Insights and Forecast - by Region
- 5.3.1. North America
- 5.3.2. Europe
- 5.3.3. Asia Pacific
- 5.3.4. Middle East and Africa
- 5.3.5. South America
- 5.1. Market Analysis, Insights and Forecast - by Battery Type
- 6. Global Electric Vehicle Battery Materials Market Analysis, Insights and Forecast, 2021-2033
- 6.1. Market Analysis, Insights and Forecast - by Battery Type
- 6.1.1. Lithium-ion
- 6.1.2. Lead-acid
- 6.1.3. Other Battery Types
- 6.2. Market Analysis, Insights and Forecast - by Material
- 6.2.1. Anode
- 6.2.2. Cathode
- 6.2.3. Separator
- 6.2.4. Electrolyte
- 6.2.5. Other Materials
- 6.1. Market Analysis, Insights and Forecast - by Battery Type
- 7. North America Electric Vehicle Battery Materials Market Analysis, Insights and Forecast, 2021-2033
- 7.1. Market Analysis, Insights and Forecast - by Battery Type
- 7.1.1. Lithium-ion
- 7.1.2. Lead-acid
- 7.1.3. Other Battery Types
- 7.2. Market Analysis, Insights and Forecast - by Material
- 7.2.1. Anode
- 7.2.2. Cathode
- 7.2.3. Separator
- 7.2.4. Electrolyte
- 7.2.5. Other Materials
- 7.1. Market Analysis, Insights and Forecast - by Battery Type
- 8. Europe Electric Vehicle Battery Materials Market Analysis, Insights and Forecast, 2021-2033
- 8.1. Market Analysis, Insights and Forecast - by Battery Type
- 8.1.1. Lithium-ion
- 8.1.2. Lead-acid
- 8.1.3. Other Battery Types
- 8.2. Market Analysis, Insights and Forecast - by Material
- 8.2.1. Anode
- 8.2.2. Cathode
- 8.2.3. Separator
- 8.2.4. Electrolyte
- 8.2.5. Other Materials
- 8.1. Market Analysis, Insights and Forecast - by Battery Type
- 9. Asia Pacific Electric Vehicle Battery Materials Market Analysis, Insights and Forecast, 2021-2033
- 9.1. Market Analysis, Insights and Forecast - by Battery Type
- 9.1.1. Lithium-ion
- 9.1.2. Lead-acid
- 9.1.3. Other Battery Types
- 9.2. Market Analysis, Insights and Forecast - by Material
- 9.2.1. Anode
- 9.2.2. Cathode
- 9.2.3. Separator
- 9.2.4. Electrolyte
- 9.2.5. Other Materials
- 9.1. Market Analysis, Insights and Forecast - by Battery Type
- 10. Middle East and Africa Electric Vehicle Battery Materials Market Analysis, Insights and Forecast, 2021-2033
- 10.1. Market Analysis, Insights and Forecast - by Battery Type
- 10.1.1. Lithium-ion
- 10.1.2. Lead-acid
- 10.1.3. Other Battery Types
- 10.2. Market Analysis, Insights and Forecast - by Material
- 10.2.1. Anode
- 10.2.2. Cathode
- 10.2.3. Separator
- 10.2.4. Electrolyte
- 10.2.5. Other Materials
- 10.1. Market Analysis, Insights and Forecast - by Battery Type
- 11. South America Electric Vehicle Battery Materials Market Analysis, Insights and Forecast, 2021-2033
- 11.1. Market Analysis, Insights and Forecast - by Battery Type
- 11.1.1. Lithium-ion
- 11.1.2. Lead-acid
- 11.1.3. Other Battery Types
- 11.2. Market Analysis, Insights and Forecast - by Material
- 11.2.1. Anode
- 11.2.2. Cathode
- 11.2.3. Separator
- 11.2.4. Electrolyte
- 11.2.5. Other Materials
- 11.1. Market Analysis, Insights and Forecast - by Battery Type
- 12. Competitive Analysis
- 12.1. Company Profiles
- 12.1.1 Targray Technology International Inc
- 12.1.1.1. Company Overview
- 12.1.1.2. Products
- 12.1.1.3. Company Financials
- 12.1.1.4. SWOT Analysis
- 12.1.2 BASF SE
- 12.1.2.1. Company Overview
- 12.1.2.2. Products
- 12.1.2.3. Company Financials
- 12.1.2.4. SWOT Analysis
- 12.1.3 Mitsubishi Chemical Group Corporation
- 12.1.3.1. Company Overview
- 12.1.3.2. Products
- 12.1.3.3. Company Financials
- 12.1.3.4. SWOT Analysis
- 12.1.4 UBE Corporation
- 12.1.4.1. Company Overview
- 12.1.4.2. Products
- 12.1.4.3. Company Financials
- 12.1.4.4. SWOT Analysis
- 12.1.5 Umicore
- 12.1.5.1. Company Overview
- 12.1.5.2. Products
- 12.1.5.3. Company Financials
- 12.1.5.4. SWOT Analysis
- 12.1.6 Sumitomo Chemical Co Ltd
- 12.1.6.1. Company Overview
- 12.1.6.2. Products
- 12.1.6.3. Company Financials
- 12.1.6.4. SWOT Analysis
- 12.1.7 Nichia Corporation
- 12.1.7.1. Company Overview
- 12.1.7.2. Products
- 12.1.7.3. Company Financials
- 12.1.7.4. SWOT Analysis
- 12.1.8 ENTEK International LLC
- 12.1.8.1. Company Overview
- 12.1.8.2. Products
- 12.1.8.3. Company Financials
- 12.1.8.4. SWOT Analysis
- 12.1.9 Arkema SA
- 12.1.9.1. Company Overview
- 12.1.9.2. Products
- 12.1.9.3. Company Financials
- 12.1.9.4. SWOT Analysis
- 12.1.10 Kureha Corporation*List Not Exhaustive 6 4 List of Other Prominent Companies6 5 Market Ranking Analysi
- 12.1.10.1. Company Overview
- 12.1.10.2. Products
- 12.1.10.3. Company Financials
- 12.1.10.4. SWOT Analysis
- 12.1.1 Targray Technology International Inc
- 12.2. Market Entropy
- 12.2.1 Company's Key Areas Served
- 12.2.2 Recent Developments
- 12.3. Company Market Share Analysis 2025
- 12.3.1 Top 5 Companies Market Share Analysis
- 12.3.2 Top 3 Companies Market Share Analysis
- 12.4. List of Potential Customers
- 13. Research Methodology
List of Figures
- Figure 1: Global Electric Vehicle Battery Materials Market Revenue Breakdown (Million, %) by Region 2025 & 2033
- Figure 2: Global Electric Vehicle Battery Materials Market Volume Breakdown (Billion, %) by Region 2025 & 2033
- Figure 3: North America Electric Vehicle Battery Materials Market Revenue (Million), by Battery Type 2025 & 2033
- Figure 4: North America Electric Vehicle Battery Materials Market Volume (Billion), by Battery Type 2025 & 2033
- Figure 5: North America Electric Vehicle Battery Materials Market Revenue Share (%), by Battery Type 2025 & 2033
- Figure 6: North America Electric Vehicle Battery Materials Market Volume Share (%), by Battery Type 2025 & 2033
- Figure 7: North America Electric Vehicle Battery Materials Market Revenue (Million), by Material 2025 & 2033
- Figure 8: North America Electric Vehicle Battery Materials Market Volume (Billion), by Material 2025 & 2033
- Figure 9: North America Electric Vehicle Battery Materials Market Revenue Share (%), by Material 2025 & 2033
- Figure 10: North America Electric Vehicle Battery Materials Market Volume Share (%), by Material 2025 & 2033
- Figure 11: North America Electric Vehicle Battery Materials Market Revenue (Million), by Country 2025 & 2033
- Figure 12: North America Electric Vehicle Battery Materials Market Volume (Billion), by Country 2025 & 2033
- Figure 13: North America Electric Vehicle Battery Materials Market Revenue Share (%), by Country 2025 & 2033
- Figure 14: North America Electric Vehicle Battery Materials Market Volume Share (%), by Country 2025 & 2033
- Figure 15: Europe Electric Vehicle Battery Materials Market Revenue (Million), by Battery Type 2025 & 2033
- Figure 16: Europe Electric Vehicle Battery Materials Market Volume (Billion), by Battery Type 2025 & 2033
- Figure 17: Europe Electric Vehicle Battery Materials Market Revenue Share (%), by Battery Type 2025 & 2033
- Figure 18: Europe Electric Vehicle Battery Materials Market Volume Share (%), by Battery Type 2025 & 2033
- Figure 19: Europe Electric Vehicle Battery Materials Market Revenue (Million), by Material 2025 & 2033
- Figure 20: Europe Electric Vehicle Battery Materials Market Volume (Billion), by Material 2025 & 2033
- Figure 21: Europe Electric Vehicle Battery Materials Market Revenue Share (%), by Material 2025 & 2033
- Figure 22: Europe Electric Vehicle Battery Materials Market Volume Share (%), by Material 2025 & 2033
- Figure 23: Europe Electric Vehicle Battery Materials Market Revenue (Million), by Country 2025 & 2033
- Figure 24: Europe Electric Vehicle Battery Materials Market Volume (Billion), by Country 2025 & 2033
- Figure 25: Europe Electric Vehicle Battery Materials Market Revenue Share (%), by Country 2025 & 2033
- Figure 26: Europe Electric Vehicle Battery Materials Market Volume Share (%), by Country 2025 & 2033
- Figure 27: Asia Pacific Electric Vehicle Battery Materials Market Revenue (Million), by Battery Type 2025 & 2033
- Figure 28: Asia Pacific Electric Vehicle Battery Materials Market Volume (Billion), by Battery Type 2025 & 2033
- Figure 29: Asia Pacific Electric Vehicle Battery Materials Market Revenue Share (%), by Battery Type 2025 & 2033
- Figure 30: Asia Pacific Electric Vehicle Battery Materials Market Volume Share (%), by Battery Type 2025 & 2033
- Figure 31: Asia Pacific Electric Vehicle Battery Materials Market Revenue (Million), by Material 2025 & 2033
- Figure 32: Asia Pacific Electric Vehicle Battery Materials Market Volume (Billion), by Material 2025 & 2033
- Figure 33: Asia Pacific Electric Vehicle Battery Materials Market Revenue Share (%), by Material 2025 & 2033
- Figure 34: Asia Pacific Electric Vehicle Battery Materials Market Volume Share (%), by Material 2025 & 2033
- Figure 35: Asia Pacific Electric Vehicle Battery Materials Market Revenue (Million), by Country 2025 & 2033
- Figure 36: Asia Pacific Electric Vehicle Battery Materials Market Volume (Billion), by Country 2025 & 2033
- Figure 37: Asia Pacific Electric Vehicle Battery Materials Market Revenue Share (%), by Country 2025 & 2033
- Figure 38: Asia Pacific Electric Vehicle Battery Materials Market Volume Share (%), by Country 2025 & 2033
- Figure 39: Middle East and Africa Electric Vehicle Battery Materials Market Revenue (Million), by Battery Type 2025 & 2033
- Figure 40: Middle East and Africa Electric Vehicle Battery Materials Market Volume (Billion), by Battery Type 2025 & 2033
- Figure 41: Middle East and Africa Electric Vehicle Battery Materials Market Revenue Share (%), by Battery Type 2025 & 2033
- Figure 42: Middle East and Africa Electric Vehicle Battery Materials Market Volume Share (%), by Battery Type 2025 & 2033
- Figure 43: Middle East and Africa Electric Vehicle Battery Materials Market Revenue (Million), by Material 2025 & 2033
- Figure 44: Middle East and Africa Electric Vehicle Battery Materials Market Volume (Billion), by Material 2025 & 2033
- Figure 45: Middle East and Africa Electric Vehicle Battery Materials Market Revenue Share (%), by Material 2025 & 2033
- Figure 46: Middle East and Africa Electric Vehicle Battery Materials Market Volume Share (%), by Material 2025 & 2033
- Figure 47: Middle East and Africa Electric Vehicle Battery Materials Market Revenue (Million), by Country 2025 & 2033
- Figure 48: Middle East and Africa Electric Vehicle Battery Materials Market Volume (Billion), by Country 2025 & 2033
- Figure 49: Middle East and Africa Electric Vehicle Battery Materials Market Revenue Share (%), by Country 2025 & 2033
- Figure 50: Middle East and Africa Electric Vehicle Battery Materials Market Volume Share (%), by Country 2025 & 2033
- Figure 51: South America Electric Vehicle Battery Materials Market Revenue (Million), by Battery Type 2025 & 2033
- Figure 52: South America Electric Vehicle Battery Materials Market Volume (Billion), by Battery Type 2025 & 2033
- Figure 53: South America Electric Vehicle Battery Materials Market Revenue Share (%), by Battery Type 2025 & 2033
- Figure 54: South America Electric Vehicle Battery Materials Market Volume Share (%), by Battery Type 2025 & 2033
- Figure 55: South America Electric Vehicle Battery Materials Market Revenue (Million), by Material 2025 & 2033
- Figure 56: South America Electric Vehicle Battery Materials Market Volume (Billion), by Material 2025 & 2033
- Figure 57: South America Electric Vehicle Battery Materials Market Revenue Share (%), by Material 2025 & 2033
- Figure 58: South America Electric Vehicle Battery Materials Market Volume Share (%), by Material 2025 & 2033
- Figure 59: South America Electric Vehicle Battery Materials Market Revenue (Million), by Country 2025 & 2033
- Figure 60: South America Electric Vehicle Battery Materials Market Volume (Billion), by Country 2025 & 2033
- Figure 61: South America Electric Vehicle Battery Materials Market Revenue Share (%), by Country 2025 & 2033
- Figure 62: South America Electric Vehicle Battery Materials Market Volume Share (%), by Country 2025 & 2033
List of Tables
- Table 1: Global Electric Vehicle Battery Materials Market Revenue Million Forecast, by Battery Type 2020 & 2033
- Table 2: Global Electric Vehicle Battery Materials Market Volume Billion Forecast, by Battery Type 2020 & 2033
- Table 3: Global Electric Vehicle Battery Materials Market Revenue Million Forecast, by Material 2020 & 2033
- Table 4: Global Electric Vehicle Battery Materials Market Volume Billion Forecast, by Material 2020 & 2033
- Table 5: Global Electric Vehicle Battery Materials Market Revenue Million Forecast, by Region 2020 & 2033
- Table 6: Global Electric Vehicle Battery Materials Market Volume Billion Forecast, by Region 2020 & 2033
- Table 7: Global Electric Vehicle Battery Materials Market Revenue Million Forecast, by Battery Type 2020 & 2033
- Table 8: Global Electric Vehicle Battery Materials Market Volume Billion Forecast, by Battery Type 2020 & 2033
- Table 9: Global Electric Vehicle Battery Materials Market Revenue Million Forecast, by Material 2020 & 2033
- Table 10: Global Electric Vehicle Battery Materials Market Volume Billion Forecast, by Material 2020 & 2033
- Table 11: Global Electric Vehicle Battery Materials Market Revenue Million Forecast, by Country 2020 & 2033
- Table 12: Global Electric Vehicle Battery Materials Market Volume Billion Forecast, by Country 2020 & 2033
- Table 13: United States Electric Vehicle Battery Materials Market Revenue (Million) Forecast, by Application 2020 & 2033
- Table 14: United States Electric Vehicle Battery Materials Market Volume (Billion) Forecast, by Application 2020 & 2033
- Table 15: Canada Electric Vehicle Battery Materials Market Revenue (Million) Forecast, by Application 2020 & 2033
- Table 16: Canada Electric Vehicle Battery Materials Market Volume (Billion) Forecast, by Application 2020 & 2033
- Table 17: Rest of North America Electric Vehicle Battery Materials Market Revenue (Million) Forecast, by Application 2020 & 2033
- Table 18: Rest of North America Electric Vehicle Battery Materials Market Volume (Billion) Forecast, by Application 2020 & 2033
- Table 19: Global Electric Vehicle Battery Materials Market Revenue Million Forecast, by Battery Type 2020 & 2033
- Table 20: Global Electric Vehicle Battery Materials Market Volume Billion Forecast, by Battery Type 2020 & 2033
- Table 21: Global Electric Vehicle Battery Materials Market Revenue Million Forecast, by Material 2020 & 2033
- Table 22: Global Electric Vehicle Battery Materials Market Volume Billion Forecast, by Material 2020 & 2033
- Table 23: Global Electric Vehicle Battery Materials Market Revenue Million Forecast, by Country 2020 & 2033
- Table 24: Global Electric Vehicle Battery Materials Market Volume Billion Forecast, by Country 2020 & 2033
- Table 25: Germany Electric Vehicle Battery Materials Market Revenue (Million) Forecast, by Application 2020 & 2033
- Table 26: Germany Electric Vehicle Battery Materials Market Volume (Billion) Forecast, by Application 2020 & 2033
- Table 27: France Electric Vehicle Battery Materials Market Revenue (Million) Forecast, by Application 2020 & 2033
- Table 28: France Electric Vehicle Battery Materials Market Volume (Billion) Forecast, by Application 2020 & 2033
- Table 29: United Kingdom Electric Vehicle Battery Materials Market Revenue (Million) Forecast, by Application 2020 & 2033
- Table 30: United Kingdom Electric Vehicle Battery Materials Market Volume (Billion) Forecast, by Application 2020 & 2033
- Table 31: Italy Electric Vehicle Battery Materials Market Revenue (Million) Forecast, by Application 2020 & 2033
- Table 32: Italy Electric Vehicle Battery Materials Market Volume (Billion) Forecast, by Application 2020 & 2033
- Table 33: Spain Electric Vehicle Battery Materials Market Revenue (Million) Forecast, by Application 2020 & 2033
- Table 34: Spain Electric Vehicle Battery Materials Market Volume (Billion) Forecast, by Application 2020 & 2033
- Table 35: NORDIC Electric Vehicle Battery Materials Market Revenue (Million) Forecast, by Application 2020 & 2033
- Table 36: NORDIC Electric Vehicle Battery Materials Market Volume (Billion) Forecast, by Application 2020 & 2033
- Table 37: Russia Electric Vehicle Battery Materials Market Revenue (Million) Forecast, by Application 2020 & 2033
- Table 38: Russia Electric Vehicle Battery Materials Market Volume (Billion) Forecast, by Application 2020 & 2033
- Table 39: Turkey Electric Vehicle Battery Materials Market Revenue (Million) Forecast, by Application 2020 & 2033
- Table 40: Turkey Electric Vehicle Battery Materials Market Volume (Billion) Forecast, by Application 2020 & 2033
- Table 41: Rest of Europe Electric Vehicle Battery Materials Market Revenue (Million) Forecast, by Application 2020 & 2033
- Table 42: Rest of Europe Electric Vehicle Battery Materials Market Volume (Billion) Forecast, by Application 2020 & 2033
- Table 43: Global Electric Vehicle Battery Materials Market Revenue Million Forecast, by Battery Type 2020 & 2033
- Table 44: Global Electric Vehicle Battery Materials Market Volume Billion Forecast, by Battery Type 2020 & 2033
- Table 45: Global Electric Vehicle Battery Materials Market Revenue Million Forecast, by Material 2020 & 2033
- Table 46: Global Electric Vehicle Battery Materials Market Volume Billion Forecast, by Material 2020 & 2033
- Table 47: Global Electric Vehicle Battery Materials Market Revenue Million Forecast, by Country 2020 & 2033
- Table 48: Global Electric Vehicle Battery Materials Market Volume Billion Forecast, by Country 2020 & 2033
- Table 49: China Electric Vehicle Battery Materials Market Revenue (Million) Forecast, by Application 2020 & 2033
- Table 50: China Electric Vehicle Battery Materials Market Volume (Billion) Forecast, by Application 2020 & 2033
- Table 51: India Electric Vehicle Battery Materials Market Revenue (Million) Forecast, by Application 2020 & 2033
- Table 52: India Electric Vehicle Battery Materials Market Volume (Billion) Forecast, by Application 2020 & 2033
- Table 53: Australia Electric Vehicle Battery Materials Market Revenue (Million) Forecast, by Application 2020 & 2033
- Table 54: Australia Electric Vehicle Battery Materials Market Volume (Billion) Forecast, by Application 2020 & 2033
- Table 55: Japan Electric Vehicle Battery Materials Market Revenue (Million) Forecast, by Application 2020 & 2033
- Table 56: Japan Electric Vehicle Battery Materials Market Volume (Billion) Forecast, by Application 2020 & 2033
- Table 57: South Korea Electric Vehicle Battery Materials Market Revenue (Million) Forecast, by Application 2020 & 2033
- Table 58: South Korea Electric Vehicle Battery Materials Market Volume (Billion) Forecast, by Application 2020 & 2033
- Table 59: Malaysia Electric Vehicle Battery Materials Market Revenue (Million) Forecast, by Application 2020 & 2033
- Table 60: Malaysia Electric Vehicle Battery Materials Market Volume (Billion) Forecast, by Application 2020 & 2033
- Table 61: Thailand Electric Vehicle Battery Materials Market Revenue (Million) Forecast, by Application 2020 & 2033
- Table 62: Thailand Electric Vehicle Battery Materials Market Volume (Billion) Forecast, by Application 2020 & 2033
- Table 63: Indonesia Electric Vehicle Battery Materials Market Revenue (Million) Forecast, by Application 2020 & 2033
- Table 64: Indonesia Electric Vehicle Battery Materials Market Volume (Billion) Forecast, by Application 2020 & 2033
- Table 65: Vietnam Electric Vehicle Battery Materials Market Revenue (Million) Forecast, by Application 2020 & 2033
- Table 66: Vietnam Electric Vehicle Battery Materials Market Volume (Billion) Forecast, by Application 2020 & 2033
- Table 67: Rest of Asia Pacific Electric Vehicle Battery Materials Market Revenue (Million) Forecast, by Application 2020 & 2033
- Table 68: Rest of Asia Pacific Electric Vehicle Battery Materials Market Volume (Billion) Forecast, by Application 2020 & 2033
- Table 69: Global Electric Vehicle Battery Materials Market Revenue Million Forecast, by Battery Type 2020 & 2033
- Table 70: Global Electric Vehicle Battery Materials Market Volume Billion Forecast, by Battery Type 2020 & 2033
- Table 71: Global Electric Vehicle Battery Materials Market Revenue Million Forecast, by Material 2020 & 2033
- Table 72: Global Electric Vehicle Battery Materials Market Volume Billion Forecast, by Material 2020 & 2033
- Table 73: Global Electric Vehicle Battery Materials Market Revenue Million Forecast, by Country 2020 & 2033
- Table 74: Global Electric Vehicle Battery Materials Market Volume Billion Forecast, by Country 2020 & 2033
- Table 75: Saudi Arabia Electric Vehicle Battery Materials Market Revenue (Million) Forecast, by Application 2020 & 2033
- Table 76: Saudi Arabia Electric Vehicle Battery Materials Market Volume (Billion) Forecast, by Application 2020 & 2033
- Table 77: United Arab Emirates Electric Vehicle Battery Materials Market Revenue (Million) Forecast, by Application 2020 & 2033
- Table 78: United Arab Emirates Electric Vehicle Battery Materials Market Volume (Billion) Forecast, by Application 2020 & 2033
- Table 79: Nigeria Electric Vehicle Battery Materials Market Revenue (Million) Forecast, by Application 2020 & 2033
- Table 80: Nigeria Electric Vehicle Battery Materials Market Volume (Billion) Forecast, by Application 2020 & 2033
- Table 81: Egypt Electric Vehicle Battery Materials Market Revenue (Million) Forecast, by Application 2020 & 2033
- Table 82: Egypt Electric Vehicle Battery Materials Market Volume (Billion) Forecast, by Application 2020 & 2033
- Table 83: Qatar Electric Vehicle Battery Materials Market Revenue (Million) Forecast, by Application 2020 & 2033
- Table 84: Qatar Electric Vehicle Battery Materials Market Volume (Billion) Forecast, by Application 2020 & 2033
- Table 85: South Africa Electric Vehicle Battery Materials Market Revenue (Million) Forecast, by Application 2020 & 2033
- Table 86: South Africa Electric Vehicle Battery Materials Market Volume (Billion) Forecast, by Application 2020 & 2033
- Table 87: Rest of Middle East and Africa Electric Vehicle Battery Materials Market Revenue (Million) Forecast, by Application 2020 & 2033
- Table 88: Rest of Middle East and Africa Electric Vehicle Battery Materials Market Volume (Billion) Forecast, by Application 2020 & 2033
- Table 89: Global Electric Vehicle Battery Materials Market Revenue Million Forecast, by Battery Type 2020 & 2033
- Table 90: Global Electric Vehicle Battery Materials Market Volume Billion Forecast, by Battery Type 2020 & 2033
- Table 91: Global Electric Vehicle Battery Materials Market Revenue Million Forecast, by Material 2020 & 2033
- Table 92: Global Electric Vehicle Battery Materials Market Volume Billion Forecast, by Material 2020 & 2033
- Table 93: Global Electric Vehicle Battery Materials Market Revenue Million Forecast, by Country 2020 & 2033
- Table 94: Global Electric Vehicle Battery Materials Market Volume Billion Forecast, by Country 2020 & 2033
- Table 95: Brazil Electric Vehicle Battery Materials Market Revenue (Million) Forecast, by Application 2020 & 2033
- Table 96: Brazil Electric Vehicle Battery Materials Market Volume (Billion) Forecast, by Application 2020 & 2033
- Table 97: Argentina Electric Vehicle Battery Materials Market Revenue (Million) Forecast, by Application 2020 & 2033
- Table 98: Argentina Electric Vehicle Battery Materials Market Volume (Billion) Forecast, by Application 2020 & 2033
- Table 99: Colombia Electric Vehicle Battery Materials Market Revenue (Million) Forecast, by Application 2020 & 2033
- Table 100: Colombia Electric Vehicle Battery Materials Market Volume (Billion) Forecast, by Application 2020 & 2033
- Table 101: Rest of South America Electric Vehicle Battery Materials Market Revenue (Million) Forecast, by Application 2020 & 2033
- Table 102: Rest of South America Electric Vehicle Battery Materials Market Volume (Billion) Forecast, by Application 2020 & 2033
Frequently Asked Questions
1. What is the projected Compound Annual Growth Rate (CAGR) of the Electric Vehicle Battery Materials Market?
The projected CAGR is approximately 13.34%.
2. Which companies are prominent players in the Electric Vehicle Battery Materials Market?
Key companies in the market include Targray Technology International Inc, BASF SE, Mitsubishi Chemical Group Corporation, UBE Corporation, Umicore, Sumitomo Chemical Co Ltd, Nichia Corporation, ENTEK International LLC, Arkema SA, Kureha Corporation*List Not Exhaustive 6 4 List of Other Prominent Companies6 5 Market Ranking Analysi.
3. What are the main segments of the Electric Vehicle Battery Materials Market?
The market segments include Battery Type, Material.
4. Can you provide details about the market size?
The market size is estimated to be USD 26.78 Million as of 2022.
5. What are some drivers contributing to market growth?
4.; The Growing Adoption of Electric Vehicles4.; Decreasing Price of Lithium-ion Batteries.
6. What are the notable trends driving market growth?
Lithium-ion Battery is Expected to Have a Major Share.
7. Are there any restraints impacting market growth?
4.; The Growing Adoption of Electric Vehicles4.; Decreasing Price of Lithium-ion Batteries.
8. Can you provide examples of recent developments in the market?
January 2024: 24M introduced a battery separator, the 24M ImpervioTM, to revolutionize battery safety in electric vehicles. This innovative technology marks a significant leap in safety for both lithium-ion and lithium-metal batteries.January 2024: Researchers at MIT developed a novel battery material poised to revolutionize electric vehicle power sources. This lithium-ion battery features an innovative organic material-based cathode, a departure from the conventional use of cobalt or nickel.
9. What pricing options are available for accessing the report?
Pricing options include single-user, multi-user, and enterprise licenses priced at USD 4750, USD 5250, and USD 8750 respectively.
10. Is the market size provided in terms of value or volume?
The market size is provided in terms of value, measured in Million and volume, measured in Billion.
11. Are there any specific market keywords associated with the report?
Yes, the market keyword associated with the report is "Electric Vehicle Battery Materials Market," which aids in identifying and referencing the specific market segment covered.
12. How do I determine which pricing option suits my needs best?
The pricing options vary based on user requirements and access needs. Individual users may opt for single-user licenses, while businesses requiring broader access may choose multi-user or enterprise licenses for cost-effective access to the report.
13. Are there any additional resources or data provided in the Electric Vehicle Battery Materials Market report?
While the report offers comprehensive insights, it's advisable to review the specific contents or supplementary materials provided to ascertain if additional resources or data are available.
14. How can I stay updated on further developments or reports in the Electric Vehicle Battery Materials Market?
To stay informed about further developments, trends, and reports in the Electric Vehicle Battery Materials Market, consider subscribing to industry newsletters, following relevant companies and organizations, or regularly checking reputable industry news sources and publications.
Methodology
Step 1 - Identification of Relevant Samples Size from Population Database


Step 2 - Approaches for Defining Global Market Size (Value, Volume* & Price*)

Note*: In applicable scenarios
Step 3 - Data Sources
Primary Research
- Web Analytics
- Survey Reports
- Research Institute
- Latest Research Reports
- Opinion Leaders
Secondary Research
- Annual Reports
- White Paper
- Latest Press Release
- Industry Association
- Paid Database
- Investor Presentations

Step 4 - Data Triangulation
Involves using different sources of information in order to increase the validity of a study
These sources are likely to be stakeholders in a program - participants, other researchers, program staff, other community members, and so on.
Then we put all data in single framework & apply various statistical tools to find out the dynamic on the market.
During the analysis stage, feedback from the stakeholder groups would be compared to determine areas of agreement as well as areas of divergence