

Key Insights
The global Excitation Systems market, valued at approximately 3.38 billion in 2025, is poised for substantial expansion with a projected Compound Annual Growth Rate (CAGR) of 4.3% from 2025 to 2033. This growth is propelled by the escalating demand for dependable and efficient power generation solutions across diverse sectors, including renewable energy and industrial operations. The increasing integration of synchronous generators and motors in power infrastructure and industrial processes necessitates advanced excitation systems for stable grid operation and optimized performance. Technological advancements, particularly in brushless and static excitation systems, are enhancing efficiency, reducing maintenance needs, and improving system reliability, thereby stimulating market expansion. The market is segmented by application (synchronous generators, synchronous motors) and type (static, brushless). While static systems currently dominate due to their proven technology and cost-effectiveness, brushless systems are gaining momentum owing to their superior performance and durability. Significant growth opportunities are identified in the Asia-Pacific and North America regions, driven by robust investments in infrastructure and renewable energy projects.
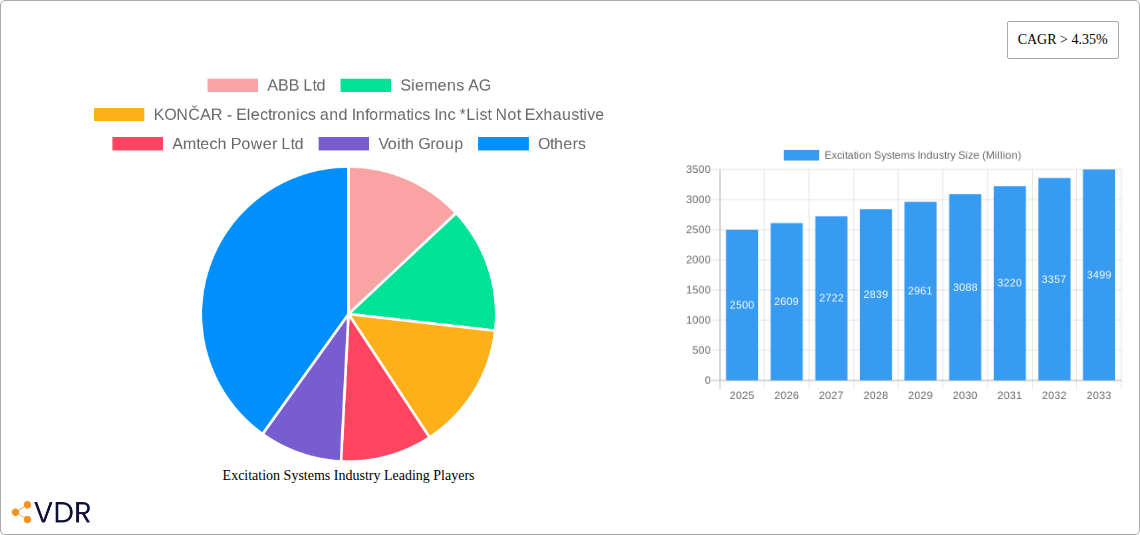
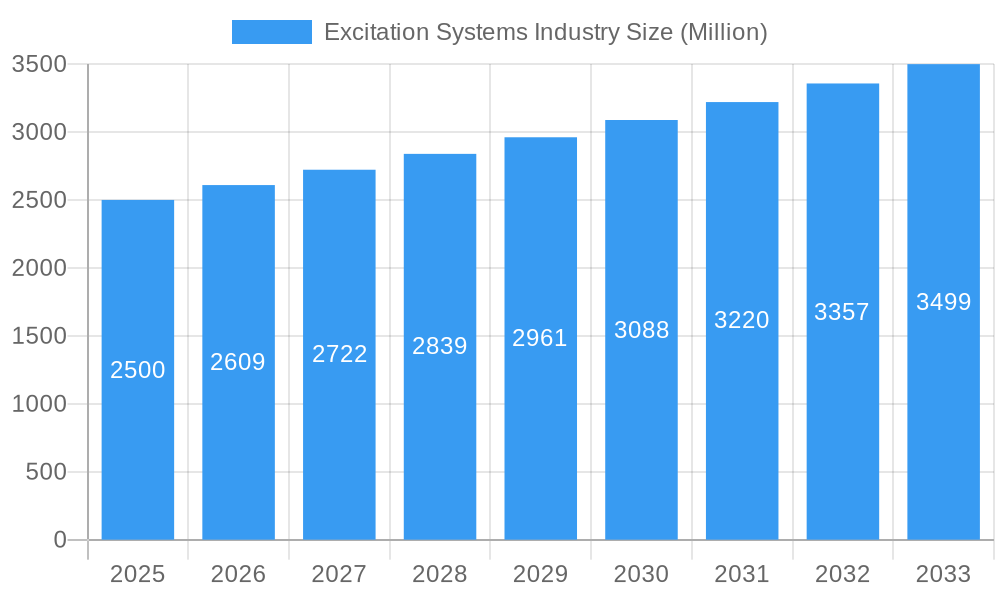
Excitation Systems Industry Market Size (In Billion)
Despite a favorable outlook, the market encounters challenges. The substantial initial investment required for sophisticated excitation systems can be a barrier for smaller entities, especially in emerging economies. Furthermore, the inherent complexity of these systems and the demand for specialized installation and maintenance expertise present hurdles to widespread adoption. However, continuous technological innovation and growing government support for renewable energy infrastructure are expected to counterbalance these restraints, fostering long-term market growth. Key industry leaders such as ABB Ltd, Siemens AG, and General Electric Company are spearheading innovation through product development and strategic alliances, shaping market competitiveness. The ongoing efforts in grid modernization and the integration of renewable energy sources will sustain the demand for reliable and efficient excitation systems throughout the forecast period.
Excitation Systems Industry Company Market Share
This report offers a comprehensive analysis of the global Excitation Systems market, detailing market dynamics, growth trajectories, regional segmentation, product offerings, key players, and future projections. The analysis covers the period from 2019 to 2033, with 2025 designated as the base and estimated year. This study is essential for industry professionals, investors, and strategic decision-makers seeking insights into this critical sector within the power generation and industrial automation industries.
Excitation Systems Industry Market Dynamics & Structure
The excitation systems market, a critical component of power generation and industrial motor control, is characterized by moderate concentration with key players like ABB Ltd, Siemens AG, and KONČAR - Electronics and Informatics Inc holding significant market share. However, several smaller players, including Amtech Power Ltd, Voith Group, VEO Oy, Basler Electric Co, General Electric Company, TENEL SRO, and Andritz AG, contribute significantly to the overall market volume. Technological innovation, particularly in digitalization and predictive maintenance, is a key driver. Stringent regulatory frameworks concerning energy efficiency and grid stability influence market dynamics. The market faces competition from alternative technologies for power control, although their penetration remains relatively low. M&A activity has been moderate, with a predicted xx number of deals in the past five years, driven primarily by strategic expansion and technological integration.
- Market Concentration: Moderately concentrated, with top 3 players holding an estimated xx% market share in 2025.
- Technological Innovation: Focus on digitalization, smart grids, and predictive maintenance technologies.
- Regulatory Framework: Stringent emission and efficiency standards driving adoption of advanced systems.
- Competitive Substitutes: Limited direct substitutes; indirect competition from alternative control technologies.
- End-User Demographics: Predominantly power generation (hydropower, thermal, wind), industrial automation, and transportation sectors.
- M&A Trends: Moderate activity, driven by strategic expansion and technology acquisition; xx deals predicted for 2019-2024.
Excitation Systems Industry Growth Trends & Insights
The global excitation systems market is experiencing steady growth, driven by increasing demand for reliable and efficient power generation and industrial automation solutions. The market size is estimated at xx Million units in 2025, with a projected Compound Annual Growth Rate (CAGR) of xx% during the forecast period (2025-2033). This growth is fueled by the expansion of renewable energy sources, particularly hydropower and wind power, which heavily rely on sophisticated excitation systems. Furthermore, the increasing adoption of smart grid technologies and the need for enhanced grid stability are creating significant opportunities for market expansion. Technological advancements in digitalization and predictive maintenance are driving higher adoption rates and improving overall system efficiency. Consumer behavior is shifting towards more energy-efficient and digitally enabled solutions, further bolstering market demand.
Dominant Regions, Countries, or Segments in Excitation Systems Industry
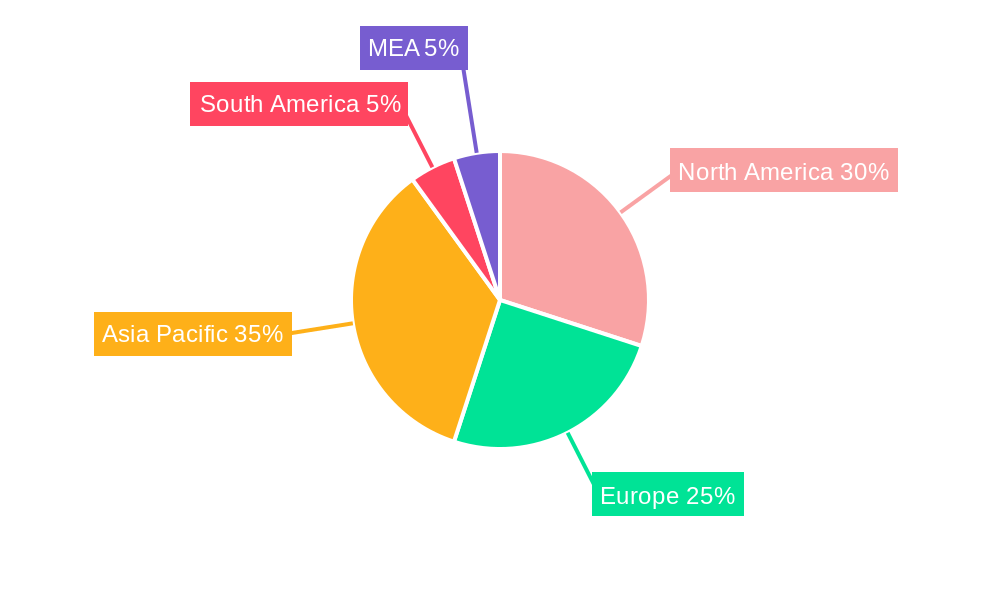
The North American and European regions currently dominate the excitation systems market, driven by robust infrastructure development, stringent environmental regulations, and substantial investments in renewable energy projects. However, Asia-Pacific is exhibiting the highest growth potential, fueled by rapid industrialization and significant investments in power generation capacity. Within the application segments, synchronous generators represent the largest market share, accounting for approximately xx% of total market revenue in 2025. The static type of excitation system holds the largest market segment due to its reliability and ease of maintenance.
- Key Drivers: Robust infrastructure development, stringent environmental regulations, and investments in renewable energy (especially hydropower).
- Dominance Factors: Established power grids, strong industrial base, and regulatory support in North America and Europe.
- Growth Potential: Asia-Pacific exhibits highest growth potential due to rapid industrialization and increasing energy demand.
- Market Share: Synchronous Generators (xx%), Static Type (xx%) in 2025.
Excitation Systems Industry Product Landscape
The excitation systems market offers a range of products, including static and brushless excitation systems, designed for synchronous generators and motors. Recent innovations focus on enhancing efficiency, reliability, and digital capabilities. Products are increasingly integrated with smart grid technologies, enabling predictive maintenance and optimized performance. Key selling propositions include reduced maintenance needs, improved grid stability, and enhanced operational visibility through advanced data analytics. Technological advancements are focused on improving power quality, minimizing energy losses, and incorporating advanced control algorithms.
Key Drivers, Barriers & Challenges in Excitation Systems Industry
Key Drivers:
- Increasing demand for renewable energy sources (hydropower, wind).
- Growing adoption of smart grid technologies.
- Stringent regulations promoting energy efficiency and grid stability.
- Advancements in digitalization and predictive maintenance.
Challenges:
- High initial investment costs for advanced systems.
- Complex integration with existing power generation infrastructure.
- Competition from alternative control technologies.
- Supply chain disruptions impacting component availability. Estimated impact: xx% on production in 2024.
Emerging Opportunities in Excitation Systems Industry
- Growing demand for energy storage systems.
- Expanding applications in microgrids and distributed generation.
- Increasing focus on cybersecurity in power grids.
- Development of advanced control algorithms for optimized power management.
Growth Accelerators in the Excitation Systems Industry
Technological breakthroughs in power electronics and digital control systems are major catalysts for long-term growth. Strategic partnerships between excitation system manufacturers and power generation companies are crucial in accelerating market adoption. Market expansion into emerging economies with rapidly growing energy demands is expected to significantly drive growth in the forecast period.
Key Players Shaping the Excitation Systems Industry Market
- ABB Ltd
- Siemens AG
- KONČAR - Electronics and Informatics Inc
- Amtech Power Ltd
- Voith Group
- VEO Oy
- Basler Electric Co
- General Electric Company
- TENEL SRO
- Andritz AG
Notable Milestones in Excitation Systems Industry Sector
- November 2020: ABB wins contract for excitation systems at Governador José Richa hydropower plant, showcasing predictive diagnostics capabilities.
- May 2020: ANDRITZ modernizes and digitalizes Sobradinho hydropower plant, integrating excitation systems and advanced controls.
In-Depth Excitation Systems Industry Market Outlook
The excitation systems market is poised for continued growth, driven by the ongoing energy transition and the increasing demand for reliable, efficient, and digitally enabled power solutions. Strategic investments in research and development, coupled with strategic partnerships and expansion into emerging markets, will create significant growth opportunities in the coming years. The market's future hinges on the successful integration of advanced technologies such as AI and machine learning for predictive maintenance and optimized grid management.
Excitation Systems Industry Segmentation
-
1. Type
- 1.1. Static
- 1.2. Brushless
-
2. Application
- 2.1. Synchronous Generators
- 2.2. Synchronous Motors
Excitation Systems Industry Segmentation By Geography
- 1. North America
- 2. Asia Pacific
- 3. Europe
- 4. South America
- 5. Middle East and Africa
Excitation Systems Industry Regional Market Share
Geographic Coverage of Excitation Systems Industry
Excitation Systems Industry REPORT HIGHLIGHTS
| Aspects | Details |
|---|---|
| Study Period | 2020-2034 |
| Base Year | 2025 |
| Estimated Year | 2026 |
| Forecast Period | 2026-2034 |
| Historical Period | 2020-2025 |
| Growth Rate | CAGR of 4.3% from 2020-2034 |
| Segmentation |
|
Table of Contents
- 1. Introduction
- 1.1. Research Scope
- 1.2. Market Segmentation
- 1.3. Research Objective
- 1.4. Definitions and Assumptions
- 2. Executive Summary
- 2.1. Market Snapshot
- 3. Market Dynamics
- 3.1. Market Drivers
- 3.2. Market Restrains
- 3.3. Market Trends
- 3.4. Market Opportunities
- 4. Market Factor Analysis
- 4.1. Porters Five Forces
- 4.1.1. Bargaining Power of Suppliers
- 4.1.2. Bargaining Power of Buyers
- 4.1.3. Threat of New Entrants
- 4.1.4. Threat of Substitutes
- 4.1.5. Competitive Rivalry
- 4.2. PESTEL analysis
- 4.3. BCG Analysis
- 4.3.1. Stars (High Growth, High Market Share)
- 4.3.2. Cash Cows (Low Growth, High Market Share)
- 4.3.3. Question Mark (High Growth, Low Market Share)
- 4.3.4. Dogs (Low Growth, Low Market Share)
- 4.4. Ansoff Matrix Analysis
- 4.5. Supply Chain Analysis
- 4.6. Regulatory Landscape
- 4.7. Current Market Potential and Opportunity Assessment (TAM–SAM–SOM Framework)
- 4.8. VDR Analyst Note
- 4.1. Porters Five Forces
- 5. Market Analysis, Insights and Forecast 2021-2033
- 5.1. Market Analysis, Insights and Forecast - by Type
- 5.1.1. Static
- 5.1.2. Brushless
- 5.2. Market Analysis, Insights and Forecast - by Application
- 5.2.1. Synchronous Generators
- 5.2.2. Synchronous Motors
- 5.3. Market Analysis, Insights and Forecast - by Region
- 5.3.1. North America
- 5.3.2. Asia Pacific
- 5.3.3. Europe
- 5.3.4. South America
- 5.3.5. Middle East and Africa
- 5.1. Market Analysis, Insights and Forecast - by Type
- 6. Global Excitation Systems Industry Analysis, Insights and Forecast, 2021-2033
- 6.1. Market Analysis, Insights and Forecast - by Type
- 6.1.1. Static
- 6.1.2. Brushless
- 6.2. Market Analysis, Insights and Forecast - by Application
- 6.2.1. Synchronous Generators
- 6.2.2. Synchronous Motors
- 6.1. Market Analysis, Insights and Forecast - by Type
- 7. North America Excitation Systems Industry Analysis, Insights and Forecast, 2021-2033
- 7.1. Market Analysis, Insights and Forecast - by Type
- 7.1.1. Static
- 7.1.2. Brushless
- 7.2. Market Analysis, Insights and Forecast - by Application
- 7.2.1. Synchronous Generators
- 7.2.2. Synchronous Motors
- 7.1. Market Analysis, Insights and Forecast - by Type
- 8. Asia Pacific Excitation Systems Industry Analysis, Insights and Forecast, 2021-2033
- 8.1. Market Analysis, Insights and Forecast - by Type
- 8.1.1. Static
- 8.1.2. Brushless
- 8.2. Market Analysis, Insights and Forecast - by Application
- 8.2.1. Synchronous Generators
- 8.2.2. Synchronous Motors
- 8.1. Market Analysis, Insights and Forecast - by Type
- 9. Europe Excitation Systems Industry Analysis, Insights and Forecast, 2021-2033
- 9.1. Market Analysis, Insights and Forecast - by Type
- 9.1.1. Static
- 9.1.2. Brushless
- 9.2. Market Analysis, Insights and Forecast - by Application
- 9.2.1. Synchronous Generators
- 9.2.2. Synchronous Motors
- 9.1. Market Analysis, Insights and Forecast - by Type
- 10. South America Excitation Systems Industry Analysis, Insights and Forecast, 2021-2033
- 10.1. Market Analysis, Insights and Forecast - by Type
- 10.1.1. Static
- 10.1.2. Brushless
- 10.2. Market Analysis, Insights and Forecast - by Application
- 10.2.1. Synchronous Generators
- 10.2.2. Synchronous Motors
- 10.1. Market Analysis, Insights and Forecast - by Type
- 11. Middle East and Africa Excitation Systems Industry Analysis, Insights and Forecast, 2021-2033
- 11.1. Market Analysis, Insights and Forecast - by Type
- 11.1.1. Static
- 11.1.2. Brushless
- 11.2. Market Analysis, Insights and Forecast - by Application
- 11.2.1. Synchronous Generators
- 11.2.2. Synchronous Motors
- 11.1. Market Analysis, Insights and Forecast - by Type
- 12. Competitive Analysis
- 12.1. Company Profiles
- 12.1.1 ABB Ltd
- 12.1.1.1. Company Overview
- 12.1.1.2. Products
- 12.1.1.3. Company Financials
- 12.1.1.4. SWOT Analysis
- 12.1.2 Siemens AG
- 12.1.2.1. Company Overview
- 12.1.2.2. Products
- 12.1.2.3. Company Financials
- 12.1.2.4. SWOT Analysis
- 12.1.3 KONČAR - Electronics and Informatics Inc *List Not Exhaustive
- 12.1.3.1. Company Overview
- 12.1.3.2. Products
- 12.1.3.3. Company Financials
- 12.1.3.4. SWOT Analysis
- 12.1.4 Amtech Power Ltd
- 12.1.4.1. Company Overview
- 12.1.4.2. Products
- 12.1.4.3. Company Financials
- 12.1.4.4. SWOT Analysis
- 12.1.5 Voith Group
- 12.1.5.1. Company Overview
- 12.1.5.2. Products
- 12.1.5.3. Company Financials
- 12.1.5.4. SWOT Analysis
- 12.1.6 VEO Oy
- 12.1.6.1. Company Overview
- 12.1.6.2. Products
- 12.1.6.3. Company Financials
- 12.1.6.4. SWOT Analysis
- 12.1.7 Basler Electric Co
- 12.1.7.1. Company Overview
- 12.1.7.2. Products
- 12.1.7.3. Company Financials
- 12.1.7.4. SWOT Analysis
- 12.1.8 General Electric Company
- 12.1.8.1. Company Overview
- 12.1.8.2. Products
- 12.1.8.3. Company Financials
- 12.1.8.4. SWOT Analysis
- 12.1.9 TENEL SRO
- 12.1.9.1. Company Overview
- 12.1.9.2. Products
- 12.1.9.3. Company Financials
- 12.1.9.4. SWOT Analysis
- 12.1.10 Andritz AG
- 12.1.10.1. Company Overview
- 12.1.10.2. Products
- 12.1.10.3. Company Financials
- 12.1.10.4. SWOT Analysis
- 12.1.1 ABB Ltd
- 12.2. Market Entropy
- 12.2.1 Company's Key Areas Served
- 12.2.2 Recent Developments
- 12.3. Company Market Share Analysis 2025
- 12.3.1 Top 5 Companies Market Share Analysis
- 12.3.2 Top 3 Companies Market Share Analysis
- 12.4. List of Potential Customers
- 13. Research Methodology
List of Figures
- Figure 1: Global Excitation Systems Industry Revenue Breakdown (billion, %) by Region 2025 & 2033
- Figure 2: North America Excitation Systems Industry Revenue (billion), by Type 2025 & 2033
- Figure 3: North America Excitation Systems Industry Revenue Share (%), by Type 2025 & 2033
- Figure 4: North America Excitation Systems Industry Revenue (billion), by Application 2025 & 2033
- Figure 5: North America Excitation Systems Industry Revenue Share (%), by Application 2025 & 2033
- Figure 6: North America Excitation Systems Industry Revenue (billion), by Country 2025 & 2033
- Figure 7: North America Excitation Systems Industry Revenue Share (%), by Country 2025 & 2033
- Figure 8: Asia Pacific Excitation Systems Industry Revenue (billion), by Type 2025 & 2033
- Figure 9: Asia Pacific Excitation Systems Industry Revenue Share (%), by Type 2025 & 2033
- Figure 10: Asia Pacific Excitation Systems Industry Revenue (billion), by Application 2025 & 2033
- Figure 11: Asia Pacific Excitation Systems Industry Revenue Share (%), by Application 2025 & 2033
- Figure 12: Asia Pacific Excitation Systems Industry Revenue (billion), by Country 2025 & 2033
- Figure 13: Asia Pacific Excitation Systems Industry Revenue Share (%), by Country 2025 & 2033
- Figure 14: Europe Excitation Systems Industry Revenue (billion), by Type 2025 & 2033
- Figure 15: Europe Excitation Systems Industry Revenue Share (%), by Type 2025 & 2033
- Figure 16: Europe Excitation Systems Industry Revenue (billion), by Application 2025 & 2033
- Figure 17: Europe Excitation Systems Industry Revenue Share (%), by Application 2025 & 2033
- Figure 18: Europe Excitation Systems Industry Revenue (billion), by Country 2025 & 2033
- Figure 19: Europe Excitation Systems Industry Revenue Share (%), by Country 2025 & 2033
- Figure 20: South America Excitation Systems Industry Revenue (billion), by Type 2025 & 2033
- Figure 21: South America Excitation Systems Industry Revenue Share (%), by Type 2025 & 2033
- Figure 22: South America Excitation Systems Industry Revenue (billion), by Application 2025 & 2033
- Figure 23: South America Excitation Systems Industry Revenue Share (%), by Application 2025 & 2033
- Figure 24: South America Excitation Systems Industry Revenue (billion), by Country 2025 & 2033
- Figure 25: South America Excitation Systems Industry Revenue Share (%), by Country 2025 & 2033
- Figure 26: Middle East and Africa Excitation Systems Industry Revenue (billion), by Type 2025 & 2033
- Figure 27: Middle East and Africa Excitation Systems Industry Revenue Share (%), by Type 2025 & 2033
- Figure 28: Middle East and Africa Excitation Systems Industry Revenue (billion), by Application 2025 & 2033
- Figure 29: Middle East and Africa Excitation Systems Industry Revenue Share (%), by Application 2025 & 2033
- Figure 30: Middle East and Africa Excitation Systems Industry Revenue (billion), by Country 2025 & 2033
- Figure 31: Middle East and Africa Excitation Systems Industry Revenue Share (%), by Country 2025 & 2033
List of Tables
- Table 1: Global Excitation Systems Industry Revenue billion Forecast, by Type 2020 & 2033
- Table 2: Global Excitation Systems Industry Revenue billion Forecast, by Application 2020 & 2033
- Table 3: Global Excitation Systems Industry Revenue billion Forecast, by Region 2020 & 2033
- Table 4: Global Excitation Systems Industry Revenue billion Forecast, by Type 2020 & 2033
- Table 5: Global Excitation Systems Industry Revenue billion Forecast, by Application 2020 & 2033
- Table 6: Global Excitation Systems Industry Revenue billion Forecast, by Country 2020 & 2033
- Table 7: Global Excitation Systems Industry Revenue billion Forecast, by Type 2020 & 2033
- Table 8: Global Excitation Systems Industry Revenue billion Forecast, by Application 2020 & 2033
- Table 9: Global Excitation Systems Industry Revenue billion Forecast, by Country 2020 & 2033
- Table 10: Global Excitation Systems Industry Revenue billion Forecast, by Type 2020 & 2033
- Table 11: Global Excitation Systems Industry Revenue billion Forecast, by Application 2020 & 2033
- Table 12: Global Excitation Systems Industry Revenue billion Forecast, by Country 2020 & 2033
- Table 13: Global Excitation Systems Industry Revenue billion Forecast, by Type 2020 & 2033
- Table 14: Global Excitation Systems Industry Revenue billion Forecast, by Application 2020 & 2033
- Table 15: Global Excitation Systems Industry Revenue billion Forecast, by Country 2020 & 2033
- Table 16: Global Excitation Systems Industry Revenue billion Forecast, by Type 2020 & 2033
- Table 17: Global Excitation Systems Industry Revenue billion Forecast, by Application 2020 & 2033
- Table 18: Global Excitation Systems Industry Revenue billion Forecast, by Country 2020 & 2033
Frequently Asked Questions
1. What is the projected Compound Annual Growth Rate (CAGR) of the Excitation Systems Industry?
The projected CAGR is approximately 4.3%.
2. Which companies are prominent players in the Excitation Systems Industry?
Key companies in the market include ABB Ltd, Siemens AG, KONČAR - Electronics and Informatics Inc *List Not Exhaustive, Amtech Power Ltd, Voith Group, VEO Oy, Basler Electric Co, General Electric Company, TENEL SRO, Andritz AG.
3. What are the main segments of the Excitation Systems Industry?
The market segments include Type, Application.
4. Can you provide details about the market size?
The market size is estimated to be USD 3.38 billion as of 2022.
5. What are some drivers contributing to market growth?
4.; Growth of Utility-Scale Renewable Energy Plants4.; Rural Electrification Plans Worlwide.
6. What are the notable trends driving market growth?
The Brushless Type Segment is Expected to Record a Faster Growth Rate.
7. Are there any restraints impacting market growth?
4.; Increasing Share of Distributed and Off-Grid Power Generation.
8. Can you provide examples of recent developments in the market?
In November 2020, ABB won a contract to provide excitation systems and speed regulation for four generator units at the Governador José Richa hydropower plant on the Iguazu River. The solution helped Copel (Companhia Paranaense de Energia) enhance the visibility of its operational data using predictive diagnostics.
9. What pricing options are available for accessing the report?
Pricing options include single-user, multi-user, and enterprise licenses priced at USD 4750, USD 5250, and USD 8750 respectively.
10. Is the market size provided in terms of value or volume?
The market size is provided in terms of value, measured in billion.
11. Are there any specific market keywords associated with the report?
Yes, the market keyword associated with the report is "Excitation Systems Industry," which aids in identifying and referencing the specific market segment covered.
12. How do I determine which pricing option suits my needs best?
The pricing options vary based on user requirements and access needs. Individual users may opt for single-user licenses, while businesses requiring broader access may choose multi-user or enterprise licenses for cost-effective access to the report.
13. Are there any additional resources or data provided in the Excitation Systems Industry report?
While the report offers comprehensive insights, it's advisable to review the specific contents or supplementary materials provided to ascertain if additional resources or data are available.
14. How can I stay updated on further developments or reports in the Excitation Systems Industry?
To stay informed about further developments, trends, and reports in the Excitation Systems Industry, consider subscribing to industry newsletters, following relevant companies and organizations, or regularly checking reputable industry news sources and publications.
Methodology
Step 1 - Identification of Relevant Samples Size from Population Database


Step 2 - Approaches for Defining Global Market Size (Value, Volume* & Price*)

Note*: In applicable scenarios
Step 3 - Data Sources
Primary Research
- Web Analytics
- Survey Reports
- Research Institute
- Latest Research Reports
- Opinion Leaders
Secondary Research
- Annual Reports
- White Paper
- Latest Press Release
- Industry Association
- Paid Database
- Investor Presentations

Step 4 - Data Triangulation
Involves using different sources of information in order to increase the validity of a study
These sources are likely to be stakeholders in a program - participants, other researchers, program staff, other community members, and so on.
Then we put all data in single framework & apply various statistical tools to find out the dynamic on the market.
During the analysis stage, feedback from the stakeholder groups would be compared to determine areas of agreement as well as areas of divergence