

Key Insights
The global gas generator market is projected to reach $28.5 billion by 2025, with a compound annual growth rate (CAGR) of 4.1%. This growth is propelled by increasing industrialization in emerging economies, particularly in Asia-Pacific and the Middle East & Africa, driving demand for dependable power backup. Commercial and residential sectors also contribute significantly due to concerns over grid instability. A focus on energy efficiency and cleaner energy is leading to the development of more environmentally friendly models. The 75-375 kVA power rating segment shows strong demand, primarily for commercial and industrial uses. Restraints include fluctuating natural gas prices, stringent emission regulations, and competition from renewable energy. However, technological advancements in fuel efficiency, emission reduction, and performance are expected to sustain market growth.
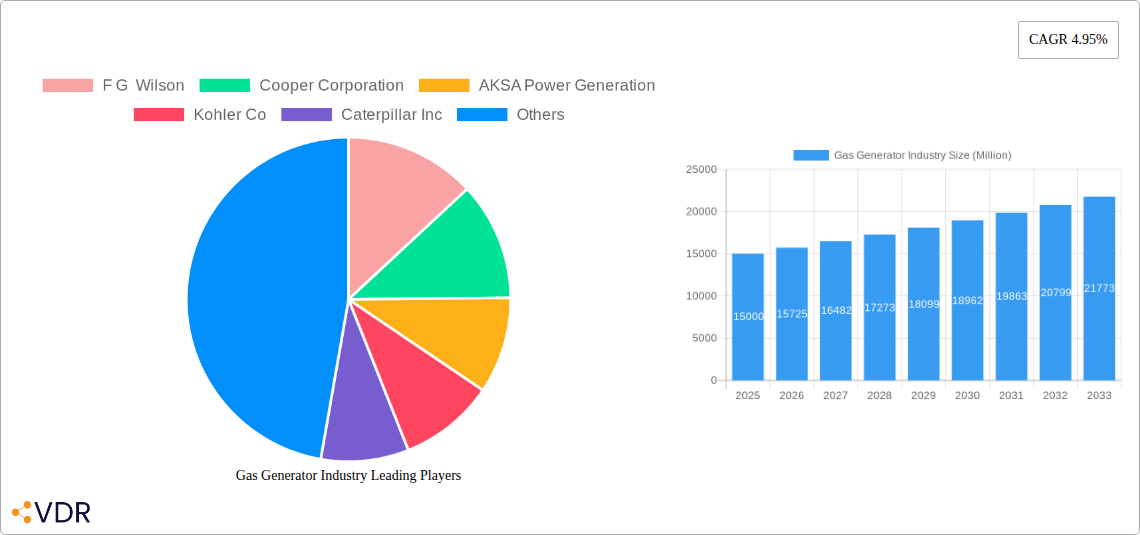
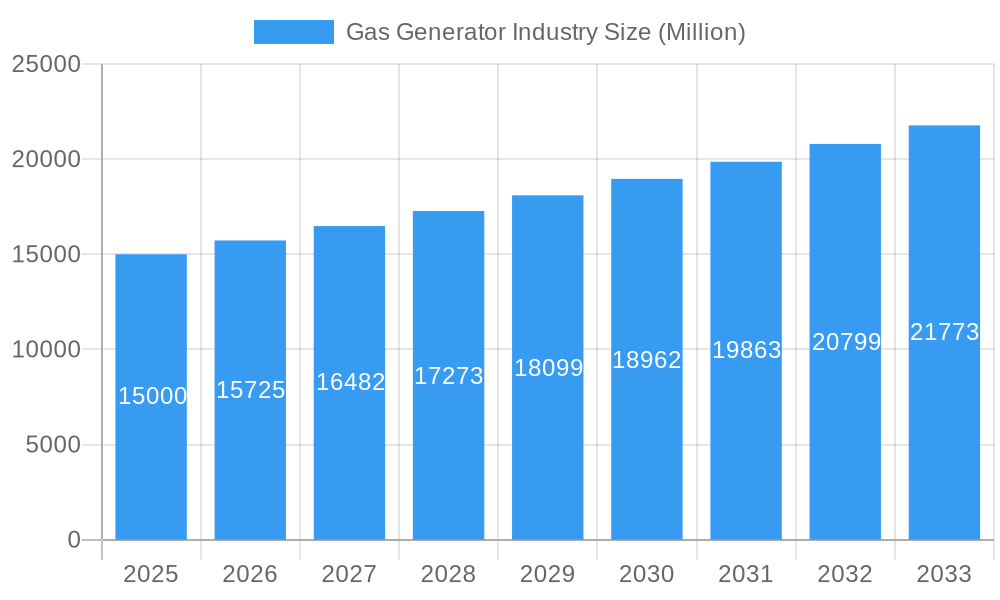
Gas Generator Industry Market Size (In Billion)
Key market players such as F G Wilson, Kohler Co, Caterpillar Inc, Cummins Inc, and Generac Holdings Inc are influencing the competitive landscape through strategic initiatives, innovation, and expansion. North America is anticipated to retain a substantial market share due to strong industrial activity and infrastructure. Conversely, rapid economic development and infrastructure projects in Asia-Pacific, especially in China and India, are fostering considerable growth, presenting lucrative opportunities. The market's future performance will depend on economic trends, energy policies, and technological progress in both gas generation and renewable energy alternatives. The increasing adoption of distributed generation and microgrids is also expected to positively impact market expansion.
Gas Generator Industry Company Market Share
Gas Generator Industry Market Report: 2019-2033
This comprehensive report provides an in-depth analysis of the Gas Generator Industry, encompassing market dynamics, growth trends, regional landscapes, and key players. Covering the period 2019-2033, with a focus on 2025, this report is essential for industry professionals, investors, and strategic decision-makers seeking to navigate this dynamic sector. The report segments the market by end-user (Industrial, Commercial, Residential) and power rating (Less than 75 kVA, 75-375 kVA, Above 375 kVA), offering granular insights into various market segments.
Gas Generator Industry Market Dynamics & Structure
The gas generator market is characterized by a moderately concentrated structure, with several major players competing alongside numerous smaller regional players. Technological innovation, primarily focused on improving efficiency, reducing emissions, and enhancing reliability, is a key driver. Stringent environmental regulations globally are shaping product development, pushing manufacturers towards cleaner energy solutions. The market also witnesses competitive pressures from alternative power sources, such as solar and wind energy. M&A activity has been moderate, with strategic alliances becoming more prevalent than large-scale acquisitions.
- Market Concentration: Moderately concentrated, with top 5 players holding approximately xx% market share in 2024.
- Technological Innovation: Focus on fuel efficiency, emission reduction (e.g., natural gas adoption), and digital connectivity.
- Regulatory Framework: Stringent emission standards (e.g., EPA regulations in North America) driving innovation and shaping market dynamics.
- Competitive Substitutes: Solar, wind, and battery storage systems pose increasing competition.
- End-User Demographics: Industrial segment dominates, followed by commercial and residential sectors. Growth in developing economies fuels demand.
- M&A Trends: Strategic partnerships and collaborations are prevalent, with xx major M&A deals recorded between 2019 and 2024.
Gas Generator Industry Growth Trends & Insights
The global gas generator market experienced significant growth between 2019 and 2024, driven by increasing industrialization, rising energy demands in developing economies, and the need for reliable backup power. The market is projected to maintain a healthy Compound Annual Growth Rate (CAGR) of xx% during the forecast period (2025-2033), reaching a market size of xx Million units by 2033. This growth is fueled by factors such as expanding infrastructure projects, growing adoption of natural gas as a cleaner fuel source, and increasing investments in renewable energy integration, where gas generators play a crucial role in grid stabilization. Technological advancements are also driving higher adoption rates, particularly in the commercial and industrial sectors, which are adopting more energy-efficient and environmentally friendly models. The market also witnesses shifting consumer preferences towards longer-lasting, more reliable, and environmentally conscious solutions. Specific CAGR for certain segments will be highlighted within the report.
Dominant Regions, Countries, or Segments in Gas Generator Industry
North America and Europe currently dominate the gas generator market, driven by robust industrial activity and established infrastructure. However, Asia-Pacific is experiencing the fastest growth, fueled by rapid industrialization and infrastructure development in countries like China and India. Within the segment breakdown:
- End-User: The Industrial sector accounts for the largest market share (xx%), followed by the Commercial (xx%) and Residential (xx%) segments.
- Power Rating: The 75-375 kVA segment holds the largest market share (xx%), due to its suitability for diverse applications, while the above 375 kVA segment is experiencing significant growth owing to large-scale industrial projects.
Key Drivers:
- Strong economic growth in developing nations: Increased industrialization and urbanization drive demand.
- Infrastructure development: Investment in power grids and renewable energy infrastructure boosts market growth.
- Government policies and incentives: Support for cleaner energy technologies influences market adoption.
Dominance Factors:
- North America & Europe: Mature markets with established infrastructure and high industrial activity.
- Asia-Pacific: Fastest-growing region due to rapid industrialization and urbanization.
Gas Generator Industry Product Landscape
The gas generator market offers a range of products catering to diverse power needs, from compact residential units to large-scale industrial systems. Recent innovations focus on enhancing efficiency, reducing emissions, and improving reliability through advanced control systems, digital connectivity, and the integration of smart features. Key selling propositions include enhanced fuel efficiency, reduced operational costs, improved reliability, and environmental compliance. Technological advancements like the use of natural gas and the integration of renewable energy sources are shaping the product landscape.
Key Drivers, Barriers & Challenges in Gas Generator Industry
Key Drivers:
- Growing demand for reliable backup power in both developed and developing economies.
- Increasing adoption of natural gas as a cleaner fuel source.
- Expanding infrastructure projects in emerging markets.
- Government initiatives promoting energy efficiency and environmental sustainability.
Key Challenges:
- Fluctuating fuel prices impacting operational costs.
- Stringent emission regulations increasing manufacturing costs.
- Intense competition from alternative power sources.
- Supply chain disruptions impacting product availability and pricing. (Estimated impact of xx% on production costs in 2024).
Emerging Opportunities in Gas Generator Industry
- Expansion into developing markets: Untapped potential in regions with limited access to reliable electricity.
- Integration with renewable energy sources: Hybrid systems offering enhanced efficiency and reduced emissions.
- Development of smart generators: Advanced control systems and remote monitoring for optimized performance and reduced downtime.
- Focus on sustainable and eco-friendly technologies: Meeting increasing demand for cleaner energy solutions.
Growth Accelerators in the Gas Generator Industry
Long-term growth in the gas generator industry will be driven by technological advancements leading to more efficient and environmentally friendly generators, strategic partnerships fostering innovation and market access, and expansion into new and emerging markets. The ongoing integration of gas generators into hybrid renewable energy systems is also a significant growth driver.
Key Players Shaping the Gas Generator Industry Market
- F G Wilson
- Cooper Corporation
- AKSA Power Generation
- Kohler Co
- Caterpillar Inc
- Cummins Inc
- General Electric Company
- Generac Holdings Inc
- MTU America Inc
- Mitsubishi Heavy Industries Ltd
Notable Milestones in Gas Generator Industry Sector
- February 2023: Cummins Inc. announced new 175kW and 200kW natural gas generator sets, showcasing commitment to sustainable technologies.
- July 2022: Sterling Generators partnered with Moteurs Baudouin, expanding its product portfolio and market reach.
- January 2022: Caterpillar Inc. unveiled the Cat G3516 Fast Reaction generator set, enhancing its natural gas power solutions.
In-Depth Gas Generator Industry Market Outlook
The future of the gas generator industry looks promising, driven by a confluence of factors: increasing energy demand, the need for reliable backup power, the push for cleaner energy solutions, and technological advancements. Strategic partnerships, focused investments in R&D, and expansion into emerging markets will be key to capturing the significant market potential and realizing strategic opportunities. The industry is poised for sustained growth, with opportunities for innovation and expansion across various segments.
Gas Generator Industry Segmentation
-
1. Power Rating
- 1.1. Less than 75 kVA
- 1.2. 75-375 kVA
- 1.3. Above 375 kVA
-
2. End-User
- 2.1. Industrial
- 2.2. Commercial
- 2.3. Residential
Gas Generator Industry Segmentation By Geography
-
1. North America
- 1.1. United States
- 1.2. Canada
- 1.3. Rest of North America
-
2. Europe
- 2.1. Germany
- 2.2. France
- 2.3. United Kingdom
- 2.4. Rest of Europe
-
3. Asia Pacific
- 3.1. China
- 3.2. India
- 3.3. Japan
- 3.4. South Korea
- 3.5. Rest of Asia Pacific
-
4. South America
- 4.1. Brazil
- 4.2. Argentina
- 4.3. Rest of South America
-
5. Middle East and Africa
- 5.1. Saudi Arabia
- 5.2. United Arab Emirates
- 5.3. South Africa
- 5.4. Rest of Middle East and Africa
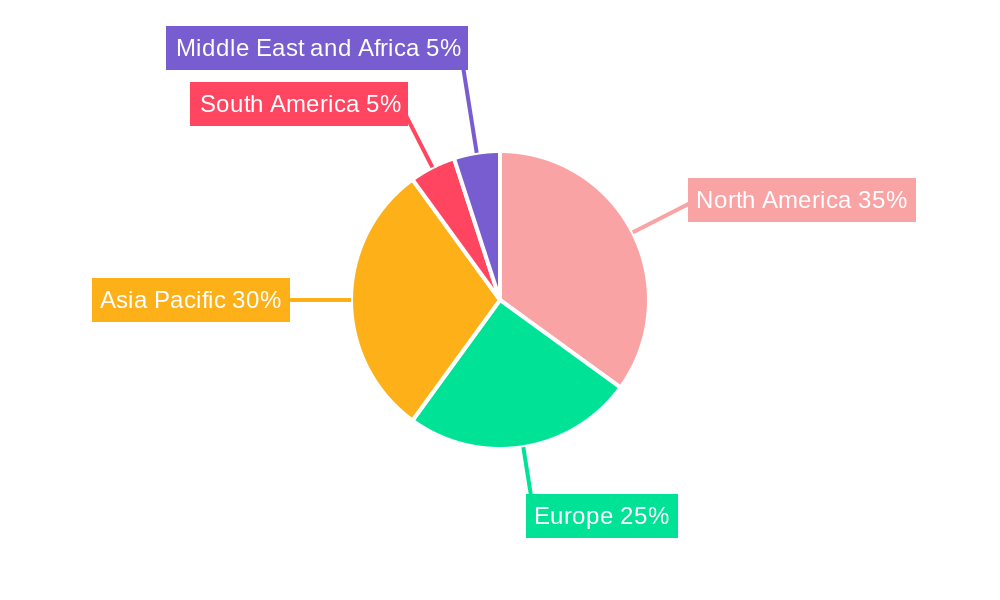
Gas Generator Industry Regional Market Share
Geographic Coverage of Gas Generator Industry
Gas Generator Industry REPORT HIGHLIGHTS
| Aspects | Details |
|---|---|
| Study Period | 2020-2034 |
| Base Year | 2025 |
| Estimated Year | 2026 |
| Forecast Period | 2026-2034 |
| Historical Period | 2020-2025 |
| Growth Rate | CAGR of 4.1% from 2020-2034 |
| Segmentation |
|
Table of Contents
- 1. Introduction
- 1.1. Research Scope
- 1.2. Market Segmentation
- 1.3. Research Objective
- 1.4. Definitions and Assumptions
- 2. Executive Summary
- 2.1. Market Snapshot
- 3. Market Dynamics
- 3.1. Market Drivers
- 3.2. Market Restrains
- 3.3. Market Trends
- 3.4. Market Opportunities
- 4. Market Factor Analysis
- 4.1. Porters Five Forces
- 4.1.1. Bargaining Power of Suppliers
- 4.1.2. Bargaining Power of Buyers
- 4.1.3. Threat of New Entrants
- 4.1.4. Threat of Substitutes
- 4.1.5. Competitive Rivalry
- 4.2. PESTEL analysis
- 4.3. BCG Analysis
- 4.3.1. Stars (High Growth, High Market Share)
- 4.3.2. Cash Cows (Low Growth, High Market Share)
- 4.3.3. Question Mark (High Growth, Low Market Share)
- 4.3.4. Dogs (Low Growth, Low Market Share)
- 4.4. Ansoff Matrix Analysis
- 4.5. Supply Chain Analysis
- 4.6. Regulatory Landscape
- 4.7. Current Market Potential and Opportunity Assessment (TAM–SAM–SOM Framework)
- 4.8. VDR Analyst Note
- 4.1. Porters Five Forces
- 5. Market Analysis, Insights and Forecast 2021-2033
- 5.1. Market Analysis, Insights and Forecast - by Power Rating
- 5.1.1. Less than 75 kVA
- 5.1.2. 75-375 kVA
- 5.1.3. Above 375 kVA
- 5.2. Market Analysis, Insights and Forecast - by End-User
- 5.2.1. Industrial
- 5.2.2. Commercial
- 5.2.3. Residential
- 5.3. Market Analysis, Insights and Forecast - by Region
- 5.3.1. North America
- 5.3.2. Europe
- 5.3.3. Asia Pacific
- 5.3.4. South America
- 5.3.5. Middle East and Africa
- 5.1. Market Analysis, Insights and Forecast - by Power Rating
- 6. Global Gas Generator Industry Analysis, Insights and Forecast, 2021-2033
- 6.1. Market Analysis, Insights and Forecast - by Power Rating
- 6.1.1. Less than 75 kVA
- 6.1.2. 75-375 kVA
- 6.1.3. Above 375 kVA
- 6.2. Market Analysis, Insights and Forecast - by End-User
- 6.2.1. Industrial
- 6.2.2. Commercial
- 6.2.3. Residential
- 6.1. Market Analysis, Insights and Forecast - by Power Rating
- 7. North America Gas Generator Industry Analysis, Insights and Forecast, 2021-2033
- 7.1. Market Analysis, Insights and Forecast - by Power Rating
- 7.1.1. Less than 75 kVA
- 7.1.2. 75-375 kVA
- 7.1.3. Above 375 kVA
- 7.2. Market Analysis, Insights and Forecast - by End-User
- 7.2.1. Industrial
- 7.2.2. Commercial
- 7.2.3. Residential
- 7.1. Market Analysis, Insights and Forecast - by Power Rating
- 8. Europe Gas Generator Industry Analysis, Insights and Forecast, 2021-2033
- 8.1. Market Analysis, Insights and Forecast - by Power Rating
- 8.1.1. Less than 75 kVA
- 8.1.2. 75-375 kVA
- 8.1.3. Above 375 kVA
- 8.2. Market Analysis, Insights and Forecast - by End-User
- 8.2.1. Industrial
- 8.2.2. Commercial
- 8.2.3. Residential
- 8.1. Market Analysis, Insights and Forecast - by Power Rating
- 9. Asia Pacific Gas Generator Industry Analysis, Insights and Forecast, 2021-2033
- 9.1. Market Analysis, Insights and Forecast - by Power Rating
- 9.1.1. Less than 75 kVA
- 9.1.2. 75-375 kVA
- 9.1.3. Above 375 kVA
- 9.2. Market Analysis, Insights and Forecast - by End-User
- 9.2.1. Industrial
- 9.2.2. Commercial
- 9.2.3. Residential
- 9.1. Market Analysis, Insights and Forecast - by Power Rating
- 10. South America Gas Generator Industry Analysis, Insights and Forecast, 2021-2033
- 10.1. Market Analysis, Insights and Forecast - by Power Rating
- 10.1.1. Less than 75 kVA
- 10.1.2. 75-375 kVA
- 10.1.3. Above 375 kVA
- 10.2. Market Analysis, Insights and Forecast - by End-User
- 10.2.1. Industrial
- 10.2.2. Commercial
- 10.2.3. Residential
- 10.1. Market Analysis, Insights and Forecast - by Power Rating
- 11. Middle East and Africa Gas Generator Industry Analysis, Insights and Forecast, 2021-2033
- 11.1. Market Analysis, Insights and Forecast - by Power Rating
- 11.1.1. Less than 75 kVA
- 11.1.2. 75-375 kVA
- 11.1.3. Above 375 kVA
- 11.2. Market Analysis, Insights and Forecast - by End-User
- 11.2.1. Industrial
- 11.2.2. Commercial
- 11.2.3. Residential
- 11.1. Market Analysis, Insights and Forecast - by Power Rating
- 12. Competitive Analysis
- 12.1. Company Profiles
- 12.1.1 F G Wilson
- 12.1.1.1. Company Overview
- 12.1.1.2. Products
- 12.1.1.3. Company Financials
- 12.1.1.4. SWOT Analysis
- 12.1.2 Cooper Corporation
- 12.1.2.1. Company Overview
- 12.1.2.2. Products
- 12.1.2.3. Company Financials
- 12.1.2.4. SWOT Analysis
- 12.1.3 AKSA Power Generation
- 12.1.3.1. Company Overview
- 12.1.3.2. Products
- 12.1.3.3. Company Financials
- 12.1.3.4. SWOT Analysis
- 12.1.4 Kohler Co
- 12.1.4.1. Company Overview
- 12.1.4.2. Products
- 12.1.4.3. Company Financials
- 12.1.4.4. SWOT Analysis
- 12.1.5 Caterpillar Inc
- 12.1.5.1. Company Overview
- 12.1.5.2. Products
- 12.1.5.3. Company Financials
- 12.1.5.4. SWOT Analysis
- 12.1.6 Cummins Inc
- 12.1.6.1. Company Overview
- 12.1.6.2. Products
- 12.1.6.3. Company Financials
- 12.1.6.4. SWOT Analysis
- 12.1.7 General Electric Company
- 12.1.7.1. Company Overview
- 12.1.7.2. Products
- 12.1.7.3. Company Financials
- 12.1.7.4. SWOT Analysis
- 12.1.8 Generac Holdings Inc
- 12.1.8.1. Company Overview
- 12.1.8.2. Products
- 12.1.8.3. Company Financials
- 12.1.8.4. SWOT Analysis
- 12.1.9 MTU America Inc *List Not Exhaustive
- 12.1.9.1. Company Overview
- 12.1.9.2. Products
- 12.1.9.3. Company Financials
- 12.1.9.4. SWOT Analysis
- 12.1.10 Mitsubishi Heavy Industries Ltd
- 12.1.10.1. Company Overview
- 12.1.10.2. Products
- 12.1.10.3. Company Financials
- 12.1.10.4. SWOT Analysis
- 12.1.1 F G Wilson
- 12.2. Market Entropy
- 12.2.1 Company's Key Areas Served
- 12.2.2 Recent Developments
- 12.3. Company Market Share Analysis 2025
- 12.3.1 Top 5 Companies Market Share Analysis
- 12.3.2 Top 3 Companies Market Share Analysis
- 12.4. List of Potential Customers
- 13. Research Methodology
List of Figures
- Figure 1: Global Gas Generator Industry Revenue Breakdown (billion, %) by Region 2025 & 2033
- Figure 2: Global Gas Generator Industry Volume Breakdown (K Unit, %) by Region 2025 & 2033
- Figure 3: North America Gas Generator Industry Revenue (billion), by Power Rating 2025 & 2033
- Figure 4: North America Gas Generator Industry Volume (K Unit), by Power Rating 2025 & 2033
- Figure 5: North America Gas Generator Industry Revenue Share (%), by Power Rating 2025 & 2033
- Figure 6: North America Gas Generator Industry Volume Share (%), by Power Rating 2025 & 2033
- Figure 7: North America Gas Generator Industry Revenue (billion), by End-User 2025 & 2033
- Figure 8: North America Gas Generator Industry Volume (K Unit), by End-User 2025 & 2033
- Figure 9: North America Gas Generator Industry Revenue Share (%), by End-User 2025 & 2033
- Figure 10: North America Gas Generator Industry Volume Share (%), by End-User 2025 & 2033
- Figure 11: North America Gas Generator Industry Revenue (billion), by Country 2025 & 2033
- Figure 12: North America Gas Generator Industry Volume (K Unit), by Country 2025 & 2033
- Figure 13: North America Gas Generator Industry Revenue Share (%), by Country 2025 & 2033
- Figure 14: North America Gas Generator Industry Volume Share (%), by Country 2025 & 2033
- Figure 15: Europe Gas Generator Industry Revenue (billion), by Power Rating 2025 & 2033
- Figure 16: Europe Gas Generator Industry Volume (K Unit), by Power Rating 2025 & 2033
- Figure 17: Europe Gas Generator Industry Revenue Share (%), by Power Rating 2025 & 2033
- Figure 18: Europe Gas Generator Industry Volume Share (%), by Power Rating 2025 & 2033
- Figure 19: Europe Gas Generator Industry Revenue (billion), by End-User 2025 & 2033
- Figure 20: Europe Gas Generator Industry Volume (K Unit), by End-User 2025 & 2033
- Figure 21: Europe Gas Generator Industry Revenue Share (%), by End-User 2025 & 2033
- Figure 22: Europe Gas Generator Industry Volume Share (%), by End-User 2025 & 2033
- Figure 23: Europe Gas Generator Industry Revenue (billion), by Country 2025 & 2033
- Figure 24: Europe Gas Generator Industry Volume (K Unit), by Country 2025 & 2033
- Figure 25: Europe Gas Generator Industry Revenue Share (%), by Country 2025 & 2033
- Figure 26: Europe Gas Generator Industry Volume Share (%), by Country 2025 & 2033
- Figure 27: Asia Pacific Gas Generator Industry Revenue (billion), by Power Rating 2025 & 2033
- Figure 28: Asia Pacific Gas Generator Industry Volume (K Unit), by Power Rating 2025 & 2033
- Figure 29: Asia Pacific Gas Generator Industry Revenue Share (%), by Power Rating 2025 & 2033
- Figure 30: Asia Pacific Gas Generator Industry Volume Share (%), by Power Rating 2025 & 2033
- Figure 31: Asia Pacific Gas Generator Industry Revenue (billion), by End-User 2025 & 2033
- Figure 32: Asia Pacific Gas Generator Industry Volume (K Unit), by End-User 2025 & 2033
- Figure 33: Asia Pacific Gas Generator Industry Revenue Share (%), by End-User 2025 & 2033
- Figure 34: Asia Pacific Gas Generator Industry Volume Share (%), by End-User 2025 & 2033
- Figure 35: Asia Pacific Gas Generator Industry Revenue (billion), by Country 2025 & 2033
- Figure 36: Asia Pacific Gas Generator Industry Volume (K Unit), by Country 2025 & 2033
- Figure 37: Asia Pacific Gas Generator Industry Revenue Share (%), by Country 2025 & 2033
- Figure 38: Asia Pacific Gas Generator Industry Volume Share (%), by Country 2025 & 2033
- Figure 39: South America Gas Generator Industry Revenue (billion), by Power Rating 2025 & 2033
- Figure 40: South America Gas Generator Industry Volume (K Unit), by Power Rating 2025 & 2033
- Figure 41: South America Gas Generator Industry Revenue Share (%), by Power Rating 2025 & 2033
- Figure 42: South America Gas Generator Industry Volume Share (%), by Power Rating 2025 & 2033
- Figure 43: South America Gas Generator Industry Revenue (billion), by End-User 2025 & 2033
- Figure 44: South America Gas Generator Industry Volume (K Unit), by End-User 2025 & 2033
- Figure 45: South America Gas Generator Industry Revenue Share (%), by End-User 2025 & 2033
- Figure 46: South America Gas Generator Industry Volume Share (%), by End-User 2025 & 2033
- Figure 47: South America Gas Generator Industry Revenue (billion), by Country 2025 & 2033
- Figure 48: South America Gas Generator Industry Volume (K Unit), by Country 2025 & 2033
- Figure 49: South America Gas Generator Industry Revenue Share (%), by Country 2025 & 2033
- Figure 50: South America Gas Generator Industry Volume Share (%), by Country 2025 & 2033
- Figure 51: Middle East and Africa Gas Generator Industry Revenue (billion), by Power Rating 2025 & 2033
- Figure 52: Middle East and Africa Gas Generator Industry Volume (K Unit), by Power Rating 2025 & 2033
- Figure 53: Middle East and Africa Gas Generator Industry Revenue Share (%), by Power Rating 2025 & 2033
- Figure 54: Middle East and Africa Gas Generator Industry Volume Share (%), by Power Rating 2025 & 2033
- Figure 55: Middle East and Africa Gas Generator Industry Revenue (billion), by End-User 2025 & 2033
- Figure 56: Middle East and Africa Gas Generator Industry Volume (K Unit), by End-User 2025 & 2033
- Figure 57: Middle East and Africa Gas Generator Industry Revenue Share (%), by End-User 2025 & 2033
- Figure 58: Middle East and Africa Gas Generator Industry Volume Share (%), by End-User 2025 & 2033
- Figure 59: Middle East and Africa Gas Generator Industry Revenue (billion), by Country 2025 & 2033
- Figure 60: Middle East and Africa Gas Generator Industry Volume (K Unit), by Country 2025 & 2033
- Figure 61: Middle East and Africa Gas Generator Industry Revenue Share (%), by Country 2025 & 2033
- Figure 62: Middle East and Africa Gas Generator Industry Volume Share (%), by Country 2025 & 2033
List of Tables
- Table 1: Global Gas Generator Industry Revenue billion Forecast, by Power Rating 2020 & 2033
- Table 2: Global Gas Generator Industry Volume K Unit Forecast, by Power Rating 2020 & 2033
- Table 3: Global Gas Generator Industry Revenue billion Forecast, by End-User 2020 & 2033
- Table 4: Global Gas Generator Industry Volume K Unit Forecast, by End-User 2020 & 2033
- Table 5: Global Gas Generator Industry Revenue billion Forecast, by Region 2020 & 2033
- Table 6: Global Gas Generator Industry Volume K Unit Forecast, by Region 2020 & 2033
- Table 7: Global Gas Generator Industry Revenue billion Forecast, by Power Rating 2020 & 2033
- Table 8: Global Gas Generator Industry Volume K Unit Forecast, by Power Rating 2020 & 2033
- Table 9: Global Gas Generator Industry Revenue billion Forecast, by End-User 2020 & 2033
- Table 10: Global Gas Generator Industry Volume K Unit Forecast, by End-User 2020 & 2033
- Table 11: Global Gas Generator Industry Revenue billion Forecast, by Country 2020 & 2033
- Table 12: Global Gas Generator Industry Volume K Unit Forecast, by Country 2020 & 2033
- Table 13: United States Gas Generator Industry Revenue (billion) Forecast, by Application 2020 & 2033
- Table 14: United States Gas Generator Industry Volume (K Unit) Forecast, by Application 2020 & 2033
- Table 15: Canada Gas Generator Industry Revenue (billion) Forecast, by Application 2020 & 2033
- Table 16: Canada Gas Generator Industry Volume (K Unit) Forecast, by Application 2020 & 2033
- Table 17: Rest of North America Gas Generator Industry Revenue (billion) Forecast, by Application 2020 & 2033
- Table 18: Rest of North America Gas Generator Industry Volume (K Unit) Forecast, by Application 2020 & 2033
- Table 19: Global Gas Generator Industry Revenue billion Forecast, by Power Rating 2020 & 2033
- Table 20: Global Gas Generator Industry Volume K Unit Forecast, by Power Rating 2020 & 2033
- Table 21: Global Gas Generator Industry Revenue billion Forecast, by End-User 2020 & 2033
- Table 22: Global Gas Generator Industry Volume K Unit Forecast, by End-User 2020 & 2033
- Table 23: Global Gas Generator Industry Revenue billion Forecast, by Country 2020 & 2033
- Table 24: Global Gas Generator Industry Volume K Unit Forecast, by Country 2020 & 2033
- Table 25: Germany Gas Generator Industry Revenue (billion) Forecast, by Application 2020 & 2033
- Table 26: Germany Gas Generator Industry Volume (K Unit) Forecast, by Application 2020 & 2033
- Table 27: France Gas Generator Industry Revenue (billion) Forecast, by Application 2020 & 2033
- Table 28: France Gas Generator Industry Volume (K Unit) Forecast, by Application 2020 & 2033
- Table 29: United Kingdom Gas Generator Industry Revenue (billion) Forecast, by Application 2020 & 2033
- Table 30: United Kingdom Gas Generator Industry Volume (K Unit) Forecast, by Application 2020 & 2033
- Table 31: Rest of Europe Gas Generator Industry Revenue (billion) Forecast, by Application 2020 & 2033
- Table 32: Rest of Europe Gas Generator Industry Volume (K Unit) Forecast, by Application 2020 & 2033
- Table 33: Global Gas Generator Industry Revenue billion Forecast, by Power Rating 2020 & 2033
- Table 34: Global Gas Generator Industry Volume K Unit Forecast, by Power Rating 2020 & 2033
- Table 35: Global Gas Generator Industry Revenue billion Forecast, by End-User 2020 & 2033
- Table 36: Global Gas Generator Industry Volume K Unit Forecast, by End-User 2020 & 2033
- Table 37: Global Gas Generator Industry Revenue billion Forecast, by Country 2020 & 2033
- Table 38: Global Gas Generator Industry Volume K Unit Forecast, by Country 2020 & 2033
- Table 39: China Gas Generator Industry Revenue (billion) Forecast, by Application 2020 & 2033
- Table 40: China Gas Generator Industry Volume (K Unit) Forecast, by Application 2020 & 2033
- Table 41: India Gas Generator Industry Revenue (billion) Forecast, by Application 2020 & 2033
- Table 42: India Gas Generator Industry Volume (K Unit) Forecast, by Application 2020 & 2033
- Table 43: Japan Gas Generator Industry Revenue (billion) Forecast, by Application 2020 & 2033
- Table 44: Japan Gas Generator Industry Volume (K Unit) Forecast, by Application 2020 & 2033
- Table 45: South Korea Gas Generator Industry Revenue (billion) Forecast, by Application 2020 & 2033
- Table 46: South Korea Gas Generator Industry Volume (K Unit) Forecast, by Application 2020 & 2033
- Table 47: Rest of Asia Pacific Gas Generator Industry Revenue (billion) Forecast, by Application 2020 & 2033
- Table 48: Rest of Asia Pacific Gas Generator Industry Volume (K Unit) Forecast, by Application 2020 & 2033
- Table 49: Global Gas Generator Industry Revenue billion Forecast, by Power Rating 2020 & 2033
- Table 50: Global Gas Generator Industry Volume K Unit Forecast, by Power Rating 2020 & 2033
- Table 51: Global Gas Generator Industry Revenue billion Forecast, by End-User 2020 & 2033
- Table 52: Global Gas Generator Industry Volume K Unit Forecast, by End-User 2020 & 2033
- Table 53: Global Gas Generator Industry Revenue billion Forecast, by Country 2020 & 2033
- Table 54: Global Gas Generator Industry Volume K Unit Forecast, by Country 2020 & 2033
- Table 55: Brazil Gas Generator Industry Revenue (billion) Forecast, by Application 2020 & 2033
- Table 56: Brazil Gas Generator Industry Volume (K Unit) Forecast, by Application 2020 & 2033
- Table 57: Argentina Gas Generator Industry Revenue (billion) Forecast, by Application 2020 & 2033
- Table 58: Argentina Gas Generator Industry Volume (K Unit) Forecast, by Application 2020 & 2033
- Table 59: Rest of South America Gas Generator Industry Revenue (billion) Forecast, by Application 2020 & 2033
- Table 60: Rest of South America Gas Generator Industry Volume (K Unit) Forecast, by Application 2020 & 2033
- Table 61: Global Gas Generator Industry Revenue billion Forecast, by Power Rating 2020 & 2033
- Table 62: Global Gas Generator Industry Volume K Unit Forecast, by Power Rating 2020 & 2033
- Table 63: Global Gas Generator Industry Revenue billion Forecast, by End-User 2020 & 2033
- Table 64: Global Gas Generator Industry Volume K Unit Forecast, by End-User 2020 & 2033
- Table 65: Global Gas Generator Industry Revenue billion Forecast, by Country 2020 & 2033
- Table 66: Global Gas Generator Industry Volume K Unit Forecast, by Country 2020 & 2033
- Table 67: Saudi Arabia Gas Generator Industry Revenue (billion) Forecast, by Application 2020 & 2033
- Table 68: Saudi Arabia Gas Generator Industry Volume (K Unit) Forecast, by Application 2020 & 2033
- Table 69: United Arab Emirates Gas Generator Industry Revenue (billion) Forecast, by Application 2020 & 2033
- Table 70: United Arab Emirates Gas Generator Industry Volume (K Unit) Forecast, by Application 2020 & 2033
- Table 71: South Africa Gas Generator Industry Revenue (billion) Forecast, by Application 2020 & 2033
- Table 72: South Africa Gas Generator Industry Volume (K Unit) Forecast, by Application 2020 & 2033
- Table 73: Rest of Middle East and Africa Gas Generator Industry Revenue (billion) Forecast, by Application 2020 & 2033
- Table 74: Rest of Middle East and Africa Gas Generator Industry Volume (K Unit) Forecast, by Application 2020 & 2033
Frequently Asked Questions
1. What is the projected Compound Annual Growth Rate (CAGR) of the Gas Generator Industry?
The projected CAGR is approximately 4.1%.
2. Which companies are prominent players in the Gas Generator Industry?
Key companies in the market include F G Wilson, Cooper Corporation, AKSA Power Generation, Kohler Co, Caterpillar Inc, Cummins Inc, General Electric Company, Generac Holdings Inc, MTU America Inc *List Not Exhaustive, Mitsubishi Heavy Industries Ltd.
3. What are the main segments of the Gas Generator Industry?
The market segments include Power Rating, End-User.
4. Can you provide details about the market size?
The market size is estimated to be USD 28.5 billion as of 2022.
5. What are some drivers contributing to market growth?
Increasing Awareness Regarding Natural Gas as a Clean and Reliable Fuel4.; Increasing Concerns Over Diesel Maintenance and Refueling Issues.
6. What are the notable trends driving market growth?
Below 75 kVA Capacity Rating to Dominate the Market.
7. Are there any restraints impacting market growth?
Lack of Gas Grid Connectivity Via Pipeline. Resulting in Hindered Fuel Supply.
8. Can you provide examples of recent developments in the market?
February 2023: Cummins Inc. announced adding 175kW and 200kW natural gas standby generator sets for North American customers. These two new generator sets are a part of Cummins's continual investment in new and sustainable technologies as part of Destination Zero, the company's strategy to reach zero emissions across its products. The new 175kW and 200kW natural gas generator sets offer customers industry-leading power density and are engineered to provide exceptional performance and consistent reliability to meet customers' power requirements.
9. What pricing options are available for accessing the report?
Pricing options include single-user, multi-user, and enterprise licenses priced at USD 4750, USD 5250, and USD 8750 respectively.
10. Is the market size provided in terms of value or volume?
The market size is provided in terms of value, measured in billion and volume, measured in K Unit.
11. Are there any specific market keywords associated with the report?
Yes, the market keyword associated with the report is "Gas Generator Industry," which aids in identifying and referencing the specific market segment covered.
12. How do I determine which pricing option suits my needs best?
The pricing options vary based on user requirements and access needs. Individual users may opt for single-user licenses, while businesses requiring broader access may choose multi-user or enterprise licenses for cost-effective access to the report.
13. Are there any additional resources or data provided in the Gas Generator Industry report?
While the report offers comprehensive insights, it's advisable to review the specific contents or supplementary materials provided to ascertain if additional resources or data are available.
14. How can I stay updated on further developments or reports in the Gas Generator Industry?
To stay informed about further developments, trends, and reports in the Gas Generator Industry, consider subscribing to industry newsletters, following relevant companies and organizations, or regularly checking reputable industry news sources and publications.
Methodology
Step 1 - Identification of Relevant Samples Size from Population Database


Step 2 - Approaches for Defining Global Market Size (Value, Volume* & Price*)

Note*: In applicable scenarios
Step 3 - Data Sources
Primary Research
- Web Analytics
- Survey Reports
- Research Institute
- Latest Research Reports
- Opinion Leaders
Secondary Research
- Annual Reports
- White Paper
- Latest Press Release
- Industry Association
- Paid Database
- Investor Presentations

Step 4 - Data Triangulation
Involves using different sources of information in order to increase the validity of a study
These sources are likely to be stakeholders in a program - participants, other researchers, program staff, other community members, and so on.
Then we put all data in single framework & apply various statistical tools to find out the dynamic on the market.
During the analysis stage, feedback from the stakeholder groups would be compared to determine areas of agreement as well as areas of divergence