
Key Insights
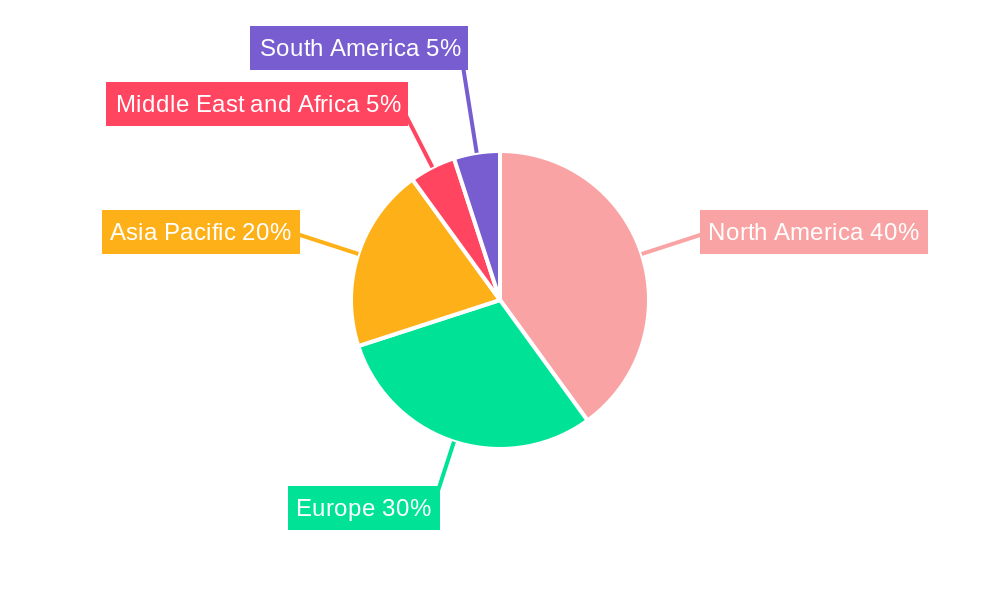
The global vessel sealing device market, valued at $6.35 billion in 2025, is projected to experience steady growth, driven by several key factors. The increasing prevalence of minimally invasive surgical procedures, coupled with the rising demand for advanced surgical technologies offering improved precision and reduced complications, fuels market expansion. Technological advancements leading to smaller, more versatile devices with enhanced functionalities like improved sealing capabilities and reduced tissue trauma are also significant drivers. Furthermore, the growing geriatric population requiring more complex surgeries and the increasing adoption of these devices in ambulatory surgical centers contribute to market growth. While the market faces certain restraints such as high initial investment costs for hospitals and the potential for complications associated with improper device usage, the overall outlook remains positive. The market segmentation reveals a significant contribution from laparoscopic surgery applications, reflecting the increasing preference for minimally invasive techniques. Major players like Johnson & Johnson, Medtronic, and Boston Scientific are strategically investing in research and development, leading to a competitive landscape characterized by innovation and product diversification. This competitive environment fosters continuous improvement and drives down costs, making these devices more accessible to healthcare facilities worldwide. The significant growth is expected to be distributed across all regions, with North America and Europe maintaining substantial market share due to advanced healthcare infrastructure and high adoption rates. However, the Asia-Pacific region is poised for rapid expansion, driven by rising healthcare expenditure and increasing awareness of minimally invasive surgical techniques.
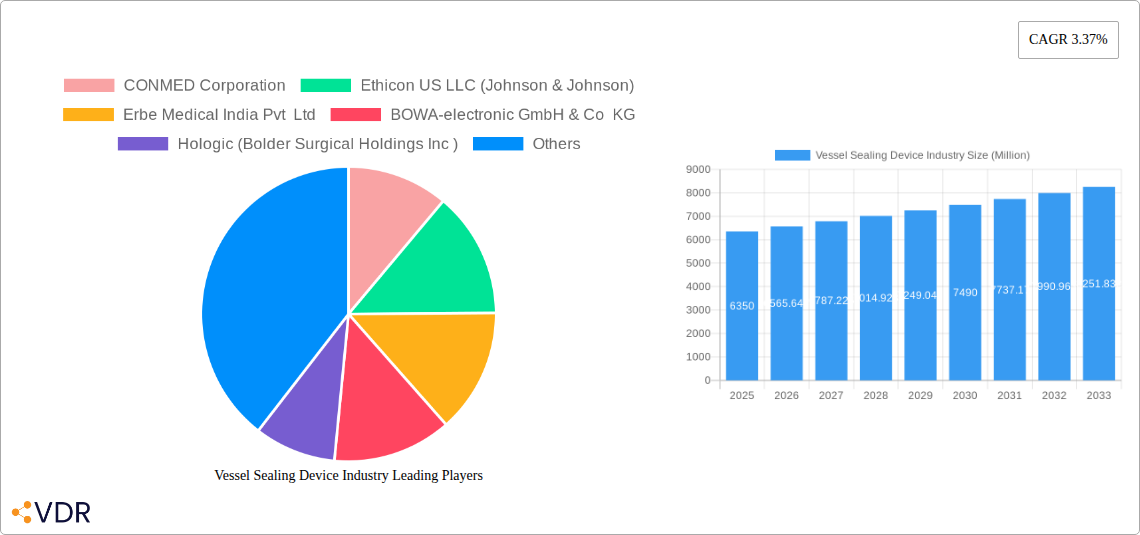
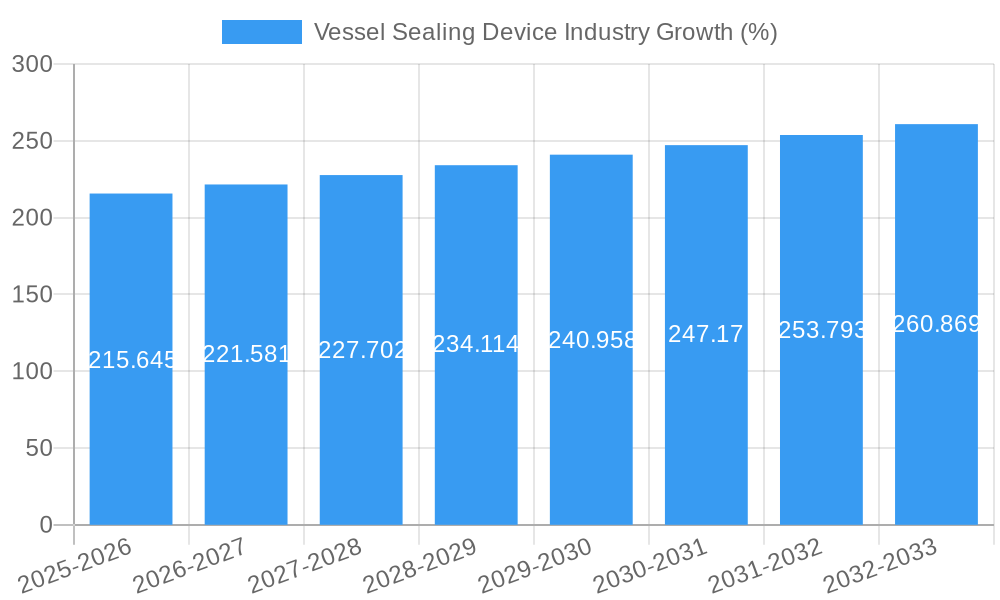
The forecast period (2025-2033) suggests a consistent growth trajectory, projected at a Compound Annual Growth Rate (CAGR) of 3.37%. This growth will be influenced by factors such as continued technological advancements, expanding applications in various surgical specialties, and rising disposable incomes in developing nations increasing access to advanced medical technologies. Competitive dynamics within the industry, including mergers, acquisitions, and strategic partnerships, will also shape the market landscape. Future market expansion hinges on successful navigation of challenges such as stringent regulatory approvals, potential reimbursement issues, and the need to address cost-effectiveness concerns for widespread adoption. Continuous innovation focusing on improved safety, efficacy, and user-friendliness will be critical for maintaining market growth and driving further penetration across diverse healthcare settings.
Vessel Sealing Device Industry Market Report: 2019-2033
This comprehensive report provides an in-depth analysis of the Vessel Sealing Device industry, encompassing market dynamics, growth trends, regional dominance, product landscape, challenges, opportunities, and key players. The study period covers 2019-2033, with a base year of 2025 and a forecast period of 2025-2033. This report is essential for industry professionals, investors, and strategic decision-makers seeking a detailed understanding of this rapidly evolving market. The parent market is the Surgical Devices market and the child market is specifically Vessel Sealing Devices.
Vessel Sealing Device Industry Market Dynamics & Structure
The Vessel Sealing Device market is characterized by moderate concentration, with several key players holding significant market share. Technological innovation, particularly in energy sources and device design, is a major driver, alongside the increasing adoption of minimally invasive surgical techniques. Stringent regulatory frameworks influence product approvals and market access. Competitive substitutes include traditional surgical methods, impacting market penetration. End-user demographics, particularly the aging global population and rising prevalence of chronic diseases, significantly influence market growth. Mergers and acquisitions (M&A) activity, as evidenced by Hologic's acquisition of Bolder Surgical in 2021, shapes the competitive landscape.
- Market Concentration: Moderately concentrated, with top 5 players holding approximately xx% market share in 2024.
- Technological Innovation: Focus on improved precision, reduced collateral damage, and enhanced ease of use.
- Regulatory Frameworks: Stringent regulatory approvals impact market entry and product lifecycle.
- Competitive Substitutes: Traditional surgical techniques pose a competitive challenge.
- End-User Demographics: Aging population and rising chronic disease prevalence drive demand.
- M&A Activity: Significant M&A activity reshapes the competitive dynamics; USD 160 million deal (Hologic-Bolder Surgical) illustrates this.
Vessel Sealing Device Industry Growth Trends & Insights
The Vessel Sealing Device market exhibits robust growth, driven by increasing adoption in minimally invasive surgeries and technological advancements. The market size has expanded considerably from xx million units in 2019 to xx million units in 2024, and is projected to reach xx million units by 2033. This growth reflects a Compound Annual Growth Rate (CAGR) of xx% during the forecast period. The increasing preference for less invasive procedures and improved patient outcomes is fueling adoption rates. Technological disruptions, such as the introduction of advanced energy sources and improved device ergonomics, contribute to market expansion. Consumer behavior is shifting toward more sophisticated devices offering improved precision and safety features. Market penetration is expected to reach xx% by 2033 in key regions.
Dominant Regions, Countries, or Segments in Vessel Sealing Device Industry
North America currently dominates the Vessel Sealing Device market, owing to high healthcare expenditure, technological advancements, and established healthcare infrastructure. Within this region, the United States is a major market driver. However, the Asia-Pacific region is exhibiting the fastest growth rate, fueled by increasing healthcare spending, growing awareness, and rising adoption rates in emerging economies like India and China. In terms of segments, Laparoscopic Surgery currently holds the largest share, driven by its minimally invasive nature and growing preference among surgeons and patients.
- North America: High healthcare expenditure and technological advancement drive market dominance.
- Asia-Pacific: Fastest growing region, fueled by rising healthcare spending and adoption rates.
- Laparoscopic Surgery: Largest application segment due to minimally invasive nature.
- Hospitals and Specialty Clinics: Largest end-user segment due to higher procedure volume.
- Generators: Holds the largest share within the product segment.
Vessel Sealing Device Industry Product Landscape
The Vessel Sealing Device market offers a range of products including generators, instruments, and accessories. Recent innovations focus on improving precision, minimizing collateral damage, and enhancing ease of use. Key advancements include improved energy sources (e.g., ultrasonic, bipolar radiofrequency), ergonomic designs, and integrated visualization systems. These improvements translate to enhanced surgical outcomes, shorter recovery times, and reduced complications, driving product differentiation and market competitiveness. Many devices boast unique selling propositions like advanced coagulation capabilities and reduced tissue trauma.
Key Drivers, Barriers & Challenges in Vessel Sealing Device Industry
Key Drivers:
- Increasing prevalence of chronic diseases requiring surgical intervention.
- Growing adoption of minimally invasive surgical procedures.
- Technological advancements leading to improved device performance and safety.
- Favorable regulatory environment in key markets.
Key Challenges:
- High initial investment costs associated with purchasing advanced devices.
- Stringent regulatory hurdles for product approvals and market entry.
- Intense competition among established and emerging players impacting pricing strategies.
- Potential supply chain disruptions affecting device availability and pricing. This impacted the market by xx% in 2022.
Emerging Opportunities in Vessel Sealing Device Industry
Emerging opportunities lie in expanding into untapped markets, particularly in developing economies with rising healthcare spending and increasing surgical volumes. The development of innovative applications tailored to specific surgical specialties and the integration of advanced technologies, such as AI and robotics, represent significant growth avenues. Furthermore, evolving consumer preferences toward minimally invasive procedures and personalized medicine will drive innovation and create new market segments.
Growth Accelerators in the Vessel Sealing Device Industry
Technological breakthroughs, such as improved energy sources and advanced device features, are driving long-term growth. Strategic partnerships between device manufacturers and healthcare providers enhance market access and adoption. Market expansion strategies focusing on emerging markets and untapped surgical applications will fuel continued expansion. The increasing focus on cost-effectiveness and improved surgical outcomes further strengthens the long-term prospects of the Vessel Sealing Device market.
Key Players Shaping the Vessel Sealing Device Industry Market
- CONMED Corporation
- Ethicon US LLC (Johnson & Johnson)
- Erbe Medical India Pvt Ltd
- BOWA-electronic GmbH & Co KG
- Hologic (Bolder Surgical Holdings Inc)
- Medtronic PLC
- LAMIDEY NOURY FR
- OmniGuide Holdings Inc
- B Braun Melsungen AG
- Boston Scientific Corporation
- XCELLANCE Medical Technologies
- Olympus Corporation
Notable Milestones in Vessel Sealing Device Industry Sector
- October 2021: Hologic Inc. acquires Bolder Surgical for USD 160 million.
- September 2021: Bolder Surgical launches its CoolSeal Vessel Sealing platform, expanding its international availability.
- October 2020: CoolSeal platform first introduced in the United States.
In-Depth Vessel Sealing Device Industry Market Outlook
The Vessel Sealing Device market is poised for continued robust growth, driven by technological advancements, increasing adoption rates, and expansion into new markets. Strategic partnerships, focus on minimally invasive procedures, and the integration of innovative technologies present significant opportunities for market players. The long-term outlook remains positive, with substantial potential for market expansion and increased market penetration across various geographical regions and surgical applications.
Vessel Sealing Device Industry Segmentation
-
1. Product
- 1.1. Generators
- 1.2. Instruments
- 1.3. Accessories
-
2. Application
- 2.1. General Surgery
- 2.2. Laparoscopic Surgery
-
3. End User
- 3.1. Hospitals and Specialty Clinics
- 3.2. Ambulatory Surgical Centers
Vessel Sealing Device Industry Segmentation By Geography
-
1. North America
- 1.1. United States
- 1.2. Canada
- 1.3. Mexico
-
2. Europe
- 2.1. Germany
- 2.2. United Kingdom
- 2.3. France
- 2.4. Italy
- 2.5. Spain
- 2.6. Rest of Europe
-
3. Asia Pacific
- 3.1. China
- 3.2. Japan
- 3.3. India
- 3.4. Australia
- 3.5. South Korea
- 3.6. Rest of Asia Pacific
-
4. Middle East and Africa
- 4.1. GCC
- 4.2. South Africa
- 4.3. Rest of Middle East and Africa
-
5. South America
- 5.1. Brazil
- 5.2. Argentina
- 5.3. Rest of South America
Vessel Sealing Device Industry REPORT HIGHLIGHTS
| Aspects | Details |
|---|---|
| Study Period | 2019-2033 |
| Base Year | 2024 |
| Estimated Year | 2025 |
| Forecast Period | 2025-2033 |
| Historical Period | 2019-2024 |
| Growth Rate | CAGR of 3.37% from 2019-2033 |
| Segmentation |
|
Table of Contents
- 1. Introduction
- 1.1. Research Scope
- 1.2. Market Segmentation
- 1.3. Research Methodology
- 1.4. Definitions and Assumptions
- 2. Executive Summary
- 2.1. Introduction
- 3. Market Dynamics
- 3.1. Introduction
- 3.2. Market Drivers
- 3.2.1. Increasing Number of Surgical Procedures; Technological Advancements in Vessel Sealing Devices
- 3.3. Market Restrains
- 3.3.1. Complications of Vessel Sealing Devices; High Cost of Surgeries
- 3.4. Market Trends
- 3.4.1. The Laparoscopic Segment Accounted for a Major Share of the Market
- 4. Market Factor Analysis
- 4.1. Porters Five Forces
- 4.2. Supply/Value Chain
- 4.3. PESTEL analysis
- 4.4. Market Entropy
- 4.5. Patent/Trademark Analysis
- 5. Global Vessel Sealing Device Industry Analysis, Insights and Forecast, 2019-2031
- 5.1. Market Analysis, Insights and Forecast - by Product
- 5.1.1. Generators
- 5.1.2. Instruments
- 5.1.3. Accessories
- 5.2. Market Analysis, Insights and Forecast - by Application
- 5.2.1. General Surgery
- 5.2.2. Laparoscopic Surgery
- 5.3. Market Analysis, Insights and Forecast - by End User
- 5.3.1. Hospitals and Specialty Clinics
- 5.3.2. Ambulatory Surgical Centers
- 5.4. Market Analysis, Insights and Forecast - by Region
- 5.4.1. North America
- 5.4.2. Europe
- 5.4.3. Asia Pacific
- 5.4.4. Middle East and Africa
- 5.4.5. South America
- 5.1. Market Analysis, Insights and Forecast - by Product
- 6. North America Vessel Sealing Device Industry Analysis, Insights and Forecast, 2019-2031
- 6.1. Market Analysis, Insights and Forecast - by Product
- 6.1.1. Generators
- 6.1.2. Instruments
- 6.1.3. Accessories
- 6.2. Market Analysis, Insights and Forecast - by Application
- 6.2.1. General Surgery
- 6.2.2. Laparoscopic Surgery
- 6.3. Market Analysis, Insights and Forecast - by End User
- 6.3.1. Hospitals and Specialty Clinics
- 6.3.2. Ambulatory Surgical Centers
- 6.1. Market Analysis, Insights and Forecast - by Product
- 7. Europe Vessel Sealing Device Industry Analysis, Insights and Forecast, 2019-2031
- 7.1. Market Analysis, Insights and Forecast - by Product
- 7.1.1. Generators
- 7.1.2. Instruments
- 7.1.3. Accessories
- 7.2. Market Analysis, Insights and Forecast - by Application
- 7.2.1. General Surgery
- 7.2.2. Laparoscopic Surgery
- 7.3. Market Analysis, Insights and Forecast - by End User
- 7.3.1. Hospitals and Specialty Clinics
- 7.3.2. Ambulatory Surgical Centers
- 7.1. Market Analysis, Insights and Forecast - by Product
- 8. Asia Pacific Vessel Sealing Device Industry Analysis, Insights and Forecast, 2019-2031
- 8.1. Market Analysis, Insights and Forecast - by Product
- 8.1.1. Generators
- 8.1.2. Instruments
- 8.1.3. Accessories
- 8.2. Market Analysis, Insights and Forecast - by Application
- 8.2.1. General Surgery
- 8.2.2. Laparoscopic Surgery
- 8.3. Market Analysis, Insights and Forecast - by End User
- 8.3.1. Hospitals and Specialty Clinics
- 8.3.2. Ambulatory Surgical Centers
- 8.1. Market Analysis, Insights and Forecast - by Product
- 9. Middle East and Africa Vessel Sealing Device Industry Analysis, Insights and Forecast, 2019-2031
- 9.1. Market Analysis, Insights and Forecast - by Product
- 9.1.1. Generators
- 9.1.2. Instruments
- 9.1.3. Accessories
- 9.2. Market Analysis, Insights and Forecast - by Application
- 9.2.1. General Surgery
- 9.2.2. Laparoscopic Surgery
- 9.3. Market Analysis, Insights and Forecast - by End User
- 9.3.1. Hospitals and Specialty Clinics
- 9.3.2. Ambulatory Surgical Centers
- 9.1. Market Analysis, Insights and Forecast - by Product
- 10. South America Vessel Sealing Device Industry Analysis, Insights and Forecast, 2019-2031
- 10.1. Market Analysis, Insights and Forecast - by Product
- 10.1.1. Generators
- 10.1.2. Instruments
- 10.1.3. Accessories
- 10.2. Market Analysis, Insights and Forecast - by Application
- 10.2.1. General Surgery
- 10.2.2. Laparoscopic Surgery
- 10.3. Market Analysis, Insights and Forecast - by End User
- 10.3.1. Hospitals and Specialty Clinics
- 10.3.2. Ambulatory Surgical Centers
- 10.1. Market Analysis, Insights and Forecast - by Product
- 11. North America Vessel Sealing Device Industry Analysis, Insights and Forecast, 2019-2031
- 11.1. Market Analysis, Insights and Forecast - By Country/Sub-region
- 11.1.1. undefined
- 12. Europe Vessel Sealing Device Industry Analysis, Insights and Forecast, 2019-2031
- 12.1. Market Analysis, Insights and Forecast - By Country/Sub-region
- 12.1.1. undefined
- 13. Asia Pacific Vessel Sealing Device Industry Analysis, Insights and Forecast, 2019-2031
- 13.1. Market Analysis, Insights and Forecast - By Country/Sub-region
- 13.1.1. undefined
- 14. Middle East and Africa Vessel Sealing Device Industry Analysis, Insights and Forecast, 2019-2031
- 14.1. Market Analysis, Insights and Forecast - By Country/Sub-region
- 14.1.1. undefined
- 15. South America Vessel Sealing Device Industry Analysis, Insights and Forecast, 2019-2031
- 15.1. Market Analysis, Insights and Forecast - By Country/Sub-region
- 15.1.1. undefined
- 16. Competitive Analysis
- 16.1. Global Market Share Analysis 2024
- 16.2. Company Profiles
- 16.2.1 CONMED Corporation
- 16.2.1.1. Overview
- 16.2.1.2. Products
- 16.2.1.3. SWOT Analysis
- 16.2.1.4. Recent Developments
- 16.2.1.5. Financials (Based on Availability)
- 16.2.2 Ethicon US LLC (Johnson & Johnson)
- 16.2.2.1. Overview
- 16.2.2.2. Products
- 16.2.2.3. SWOT Analysis
- 16.2.2.4. Recent Developments
- 16.2.2.5. Financials (Based on Availability)
- 16.2.3 Erbe Medical India Pvt Ltd
- 16.2.3.1. Overview
- 16.2.3.2. Products
- 16.2.3.3. SWOT Analysis
- 16.2.3.4. Recent Developments
- 16.2.3.5. Financials (Based on Availability)
- 16.2.4 BOWA-electronic GmbH & Co KG
- 16.2.4.1. Overview
- 16.2.4.2. Products
- 16.2.4.3. SWOT Analysis
- 16.2.4.4. Recent Developments
- 16.2.4.5. Financials (Based on Availability)
- 16.2.5 Hologic (Bolder Surgical Holdings Inc )
- 16.2.5.1. Overview
- 16.2.5.2. Products
- 16.2.5.3. SWOT Analysis
- 16.2.5.4. Recent Developments
- 16.2.5.5. Financials (Based on Availability)
- 16.2.6 Medtronic PLC
- 16.2.6.1. Overview
- 16.2.6.2. Products
- 16.2.6.3. SWOT Analysis
- 16.2.6.4. Recent Developments
- 16.2.6.5. Financials (Based on Availability)
- 16.2.7 LAMIDEY NOURY FR
- 16.2.7.1. Overview
- 16.2.7.2. Products
- 16.2.7.3. SWOT Analysis
- 16.2.7.4. Recent Developments
- 16.2.7.5. Financials (Based on Availability)
- 16.2.8 OmniGuide Holdings Inc
- 16.2.8.1. Overview
- 16.2.8.2. Products
- 16.2.8.3. SWOT Analysis
- 16.2.8.4. Recent Developments
- 16.2.8.5. Financials (Based on Availability)
- 16.2.9 B Braun Melsungen AG
- 16.2.9.1. Overview
- 16.2.9.2. Products
- 16.2.9.3. SWOT Analysis
- 16.2.9.4. Recent Developments
- 16.2.9.5. Financials (Based on Availability)
- 16.2.10 Boston Scientific Corporation
- 16.2.10.1. Overview
- 16.2.10.2. Products
- 16.2.10.3. SWOT Analysis
- 16.2.10.4. Recent Developments
- 16.2.10.5. Financials (Based on Availability)
- 16.2.11 XCELLANCE Medical Technologies
- 16.2.11.1. Overview
- 16.2.11.2. Products
- 16.2.11.3. SWOT Analysis
- 16.2.11.4. Recent Developments
- 16.2.11.5. Financials (Based on Availability)
- 16.2.12 Olympus Corporation
- 16.2.12.1. Overview
- 16.2.12.2. Products
- 16.2.12.3. SWOT Analysis
- 16.2.12.4. Recent Developments
- 16.2.12.5. Financials (Based on Availability)
- 16.2.1 CONMED Corporation
List of Figures
- Figure 1: Global Vessel Sealing Device Industry Revenue Breakdown (Million, %) by Region 2024 & 2032
- Figure 2: Global Vessel Sealing Device Industry Volume Breakdown (K Unit, %) by Region 2024 & 2032
- Figure 3: North America Vessel Sealing Device Industry Revenue (Million), by Country 2024 & 2032
- Figure 4: North America Vessel Sealing Device Industry Volume (K Unit), by Country 2024 & 2032
- Figure 5: North America Vessel Sealing Device Industry Revenue Share (%), by Country 2024 & 2032
- Figure 6: North America Vessel Sealing Device Industry Volume Share (%), by Country 2024 & 2032
- Figure 7: Europe Vessel Sealing Device Industry Revenue (Million), by Country 2024 & 2032
- Figure 8: Europe Vessel Sealing Device Industry Volume (K Unit), by Country 2024 & 2032
- Figure 9: Europe Vessel Sealing Device Industry Revenue Share (%), by Country 2024 & 2032
- Figure 10: Europe Vessel Sealing Device Industry Volume Share (%), by Country 2024 & 2032
- Figure 11: Asia Pacific Vessel Sealing Device Industry Revenue (Million), by Country 2024 & 2032
- Figure 12: Asia Pacific Vessel Sealing Device Industry Volume (K Unit), by Country 2024 & 2032
- Figure 13: Asia Pacific Vessel Sealing Device Industry Revenue Share (%), by Country 2024 & 2032
- Figure 14: Asia Pacific Vessel Sealing Device Industry Volume Share (%), by Country 2024 & 2032
- Figure 15: Middle East and Africa Vessel Sealing Device Industry Revenue (Million), by Country 2024 & 2032
- Figure 16: Middle East and Africa Vessel Sealing Device Industry Volume (K Unit), by Country 2024 & 2032
- Figure 17: Middle East and Africa Vessel Sealing Device Industry Revenue Share (%), by Country 2024 & 2032
- Figure 18: Middle East and Africa Vessel Sealing Device Industry Volume Share (%), by Country 2024 & 2032
- Figure 19: South America Vessel Sealing Device Industry Revenue (Million), by Country 2024 & 2032
- Figure 20: South America Vessel Sealing Device Industry Volume (K Unit), by Country 2024 & 2032
- Figure 21: South America Vessel Sealing Device Industry Revenue Share (%), by Country 2024 & 2032
- Figure 22: South America Vessel Sealing Device Industry Volume Share (%), by Country 2024 & 2032
- Figure 23: North America Vessel Sealing Device Industry Revenue (Million), by Product 2024 & 2032
- Figure 24: North America Vessel Sealing Device Industry Volume (K Unit), by Product 2024 & 2032
- Figure 25: North America Vessel Sealing Device Industry Revenue Share (%), by Product 2024 & 2032
- Figure 26: North America Vessel Sealing Device Industry Volume Share (%), by Product 2024 & 2032
- Figure 27: North America Vessel Sealing Device Industry Revenue (Million), by Application 2024 & 2032
- Figure 28: North America Vessel Sealing Device Industry Volume (K Unit), by Application 2024 & 2032
- Figure 29: North America Vessel Sealing Device Industry Revenue Share (%), by Application 2024 & 2032
- Figure 30: North America Vessel Sealing Device Industry Volume Share (%), by Application 2024 & 2032
- Figure 31: North America Vessel Sealing Device Industry Revenue (Million), by End User 2024 & 2032
- Figure 32: North America Vessel Sealing Device Industry Volume (K Unit), by End User 2024 & 2032
- Figure 33: North America Vessel Sealing Device Industry Revenue Share (%), by End User 2024 & 2032
- Figure 34: North America Vessel Sealing Device Industry Volume Share (%), by End User 2024 & 2032
- Figure 35: North America Vessel Sealing Device Industry Revenue (Million), by Country 2024 & 2032
- Figure 36: North America Vessel Sealing Device Industry Volume (K Unit), by Country 2024 & 2032
- Figure 37: North America Vessel Sealing Device Industry Revenue Share (%), by Country 2024 & 2032
- Figure 38: North America Vessel Sealing Device Industry Volume Share (%), by Country 2024 & 2032
- Figure 39: Europe Vessel Sealing Device Industry Revenue (Million), by Product 2024 & 2032
- Figure 40: Europe Vessel Sealing Device Industry Volume (K Unit), by Product 2024 & 2032
- Figure 41: Europe Vessel Sealing Device Industry Revenue Share (%), by Product 2024 & 2032
- Figure 42: Europe Vessel Sealing Device Industry Volume Share (%), by Product 2024 & 2032
- Figure 43: Europe Vessel Sealing Device Industry Revenue (Million), by Application 2024 & 2032
- Figure 44: Europe Vessel Sealing Device Industry Volume (K Unit), by Application 2024 & 2032
- Figure 45: Europe Vessel Sealing Device Industry Revenue Share (%), by Application 2024 & 2032
- Figure 46: Europe Vessel Sealing Device Industry Volume Share (%), by Application 2024 & 2032
- Figure 47: Europe Vessel Sealing Device Industry Revenue (Million), by End User 2024 & 2032
- Figure 48: Europe Vessel Sealing Device Industry Volume (K Unit), by End User 2024 & 2032
- Figure 49: Europe Vessel Sealing Device Industry Revenue Share (%), by End User 2024 & 2032
- Figure 50: Europe Vessel Sealing Device Industry Volume Share (%), by End User 2024 & 2032
- Figure 51: Europe Vessel Sealing Device Industry Revenue (Million), by Country 2024 & 2032
- Figure 52: Europe Vessel Sealing Device Industry Volume (K Unit), by Country 2024 & 2032
- Figure 53: Europe Vessel Sealing Device Industry Revenue Share (%), by Country 2024 & 2032
- Figure 54: Europe Vessel Sealing Device Industry Volume Share (%), by Country 2024 & 2032
- Figure 55: Asia Pacific Vessel Sealing Device Industry Revenue (Million), by Product 2024 & 2032
- Figure 56: Asia Pacific Vessel Sealing Device Industry Volume (K Unit), by Product 2024 & 2032
- Figure 57: Asia Pacific Vessel Sealing Device Industry Revenue Share (%), by Product 2024 & 2032
- Figure 58: Asia Pacific Vessel Sealing Device Industry Volume Share (%), by Product 2024 & 2032
- Figure 59: Asia Pacific Vessel Sealing Device Industry Revenue (Million), by Application 2024 & 2032
- Figure 60: Asia Pacific Vessel Sealing Device Industry Volume (K Unit), by Application 2024 & 2032
- Figure 61: Asia Pacific Vessel Sealing Device Industry Revenue Share (%), by Application 2024 & 2032
- Figure 62: Asia Pacific Vessel Sealing Device Industry Volume Share (%), by Application 2024 & 2032
- Figure 63: Asia Pacific Vessel Sealing Device Industry Revenue (Million), by End User 2024 & 2032
- Figure 64: Asia Pacific Vessel Sealing Device Industry Volume (K Unit), by End User 2024 & 2032
- Figure 65: Asia Pacific Vessel Sealing Device Industry Revenue Share (%), by End User 2024 & 2032
- Figure 66: Asia Pacific Vessel Sealing Device Industry Volume Share (%), by End User 2024 & 2032
- Figure 67: Asia Pacific Vessel Sealing Device Industry Revenue (Million), by Country 2024 & 2032
- Figure 68: Asia Pacific Vessel Sealing Device Industry Volume (K Unit), by Country 2024 & 2032
- Figure 69: Asia Pacific Vessel Sealing Device Industry Revenue Share (%), by Country 2024 & 2032
- Figure 70: Asia Pacific Vessel Sealing Device Industry Volume Share (%), by Country 2024 & 2032
- Figure 71: Middle East and Africa Vessel Sealing Device Industry Revenue (Million), by Product 2024 & 2032
- Figure 72: Middle East and Africa Vessel Sealing Device Industry Volume (K Unit), by Product 2024 & 2032
- Figure 73: Middle East and Africa Vessel Sealing Device Industry Revenue Share (%), by Product 2024 & 2032
- Figure 74: Middle East and Africa Vessel Sealing Device Industry Volume Share (%), by Product 2024 & 2032
- Figure 75: Middle East and Africa Vessel Sealing Device Industry Revenue (Million), by Application 2024 & 2032
- Figure 76: Middle East and Africa Vessel Sealing Device Industry Volume (K Unit), by Application 2024 & 2032
- Figure 77: Middle East and Africa Vessel Sealing Device Industry Revenue Share (%), by Application 2024 & 2032
- Figure 78: Middle East and Africa Vessel Sealing Device Industry Volume Share (%), by Application 2024 & 2032
- Figure 79: Middle East and Africa Vessel Sealing Device Industry Revenue (Million), by End User 2024 & 2032
- Figure 80: Middle East and Africa Vessel Sealing Device Industry Volume (K Unit), by End User 2024 & 2032
- Figure 81: Middle East and Africa Vessel Sealing Device Industry Revenue Share (%), by End User 2024 & 2032
- Figure 82: Middle East and Africa Vessel Sealing Device Industry Volume Share (%), by End User 2024 & 2032
- Figure 83: Middle East and Africa Vessel Sealing Device Industry Revenue (Million), by Country 2024 & 2032
- Figure 84: Middle East and Africa Vessel Sealing Device Industry Volume (K Unit), by Country 2024 & 2032
- Figure 85: Middle East and Africa Vessel Sealing Device Industry Revenue Share (%), by Country 2024 & 2032
- Figure 86: Middle East and Africa Vessel Sealing Device Industry Volume Share (%), by Country 2024 & 2032
- Figure 87: South America Vessel Sealing Device Industry Revenue (Million), by Product 2024 & 2032
- Figure 88: South America Vessel Sealing Device Industry Volume (K Unit), by Product 2024 & 2032
- Figure 89: South America Vessel Sealing Device Industry Revenue Share (%), by Product 2024 & 2032
- Figure 90: South America Vessel Sealing Device Industry Volume Share (%), by Product 2024 & 2032
- Figure 91: South America Vessel Sealing Device Industry Revenue (Million), by Application 2024 & 2032
- Figure 92: South America Vessel Sealing Device Industry Volume (K Unit), by Application 2024 & 2032
- Figure 93: South America Vessel Sealing Device Industry Revenue Share (%), by Application 2024 & 2032
- Figure 94: South America Vessel Sealing Device Industry Volume Share (%), by Application 2024 & 2032
- Figure 95: South America Vessel Sealing Device Industry Revenue (Million), by End User 2024 & 2032
- Figure 96: South America Vessel Sealing Device Industry Volume (K Unit), by End User 2024 & 2032
- Figure 97: South America Vessel Sealing Device Industry Revenue Share (%), by End User 2024 & 2032
- Figure 98: South America Vessel Sealing Device Industry Volume Share (%), by End User 2024 & 2032
- Figure 99: South America Vessel Sealing Device Industry Revenue (Million), by Country 2024 & 2032
- Figure 100: South America Vessel Sealing Device Industry Volume (K Unit), by Country 2024 & 2032
- Figure 101: South America Vessel Sealing Device Industry Revenue Share (%), by Country 2024 & 2032
- Figure 102: South America Vessel Sealing Device Industry Volume Share (%), by Country 2024 & 2032
List of Tables
- Table 1: Global Vessel Sealing Device Industry Revenue Million Forecast, by Region 2019 & 2032
- Table 2: Global Vessel Sealing Device Industry Volume K Unit Forecast, by Region 2019 & 2032
- Table 3: Global Vessel Sealing Device Industry Revenue Million Forecast, by Product 2019 & 2032
- Table 4: Global Vessel Sealing Device Industry Volume K Unit Forecast, by Product 2019 & 2032
- Table 5: Global Vessel Sealing Device Industry Revenue Million Forecast, by Application 2019 & 2032
- Table 6: Global Vessel Sealing Device Industry Volume K Unit Forecast, by Application 2019 & 2032
- Table 7: Global Vessel Sealing Device Industry Revenue Million Forecast, by End User 2019 & 2032
- Table 8: Global Vessel Sealing Device Industry Volume K Unit Forecast, by End User 2019 & 2032
- Table 9: Global Vessel Sealing Device Industry Revenue Million Forecast, by Region 2019 & 2032
- Table 10: Global Vessel Sealing Device Industry Volume K Unit Forecast, by Region 2019 & 2032
- Table 11: Global Vessel Sealing Device Industry Revenue Million Forecast, by Country 2019 & 2032
- Table 12: Global Vessel Sealing Device Industry Volume K Unit Forecast, by Country 2019 & 2032
- Table 13: Global Vessel Sealing Device Industry Revenue Million Forecast, by Country 2019 & 2032
- Table 14: Global Vessel Sealing Device Industry Volume K Unit Forecast, by Country 2019 & 2032
- Table 15: Global Vessel Sealing Device Industry Revenue Million Forecast, by Country 2019 & 2032
- Table 16: Global Vessel Sealing Device Industry Volume K Unit Forecast, by Country 2019 & 2032
- Table 17: Global Vessel Sealing Device Industry Revenue Million Forecast, by Country 2019 & 2032
- Table 18: Global Vessel Sealing Device Industry Volume K Unit Forecast, by Country 2019 & 2032
- Table 19: Global Vessel Sealing Device Industry Revenue Million Forecast, by Country 2019 & 2032
- Table 20: Global Vessel Sealing Device Industry Volume K Unit Forecast, by Country 2019 & 2032
- Table 21: Global Vessel Sealing Device Industry Revenue Million Forecast, by Product 2019 & 2032
- Table 22: Global Vessel Sealing Device Industry Volume K Unit Forecast, by Product 2019 & 2032
- Table 23: Global Vessel Sealing Device Industry Revenue Million Forecast, by Application 2019 & 2032
- Table 24: Global Vessel Sealing Device Industry Volume K Unit Forecast, by Application 2019 & 2032
- Table 25: Global Vessel Sealing Device Industry Revenue Million Forecast, by End User 2019 & 2032
- Table 26: Global Vessel Sealing Device Industry Volume K Unit Forecast, by End User 2019 & 2032
- Table 27: Global Vessel Sealing Device Industry Revenue Million Forecast, by Country 2019 & 2032
- Table 28: Global Vessel Sealing Device Industry Volume K Unit Forecast, by Country 2019 & 2032
- Table 29: United States Vessel Sealing Device Industry Revenue (Million) Forecast, by Application 2019 & 2032
- Table 30: United States Vessel Sealing Device Industry Volume (K Unit) Forecast, by Application 2019 & 2032
- Table 31: Canada Vessel Sealing Device Industry Revenue (Million) Forecast, by Application 2019 & 2032
- Table 32: Canada Vessel Sealing Device Industry Volume (K Unit) Forecast, by Application 2019 & 2032
- Table 33: Mexico Vessel Sealing Device Industry Revenue (Million) Forecast, by Application 2019 & 2032
- Table 34: Mexico Vessel Sealing Device Industry Volume (K Unit) Forecast, by Application 2019 & 2032
- Table 35: Global Vessel Sealing Device Industry Revenue Million Forecast, by Product 2019 & 2032
- Table 36: Global Vessel Sealing Device Industry Volume K Unit Forecast, by Product 2019 & 2032
- Table 37: Global Vessel Sealing Device Industry Revenue Million Forecast, by Application 2019 & 2032
- Table 38: Global Vessel Sealing Device Industry Volume K Unit Forecast, by Application 2019 & 2032
- Table 39: Global Vessel Sealing Device Industry Revenue Million Forecast, by End User 2019 & 2032
- Table 40: Global Vessel Sealing Device Industry Volume K Unit Forecast, by End User 2019 & 2032
- Table 41: Global Vessel Sealing Device Industry Revenue Million Forecast, by Country 2019 & 2032
- Table 42: Global Vessel Sealing Device Industry Volume K Unit Forecast, by Country 2019 & 2032
- Table 43: Germany Vessel Sealing Device Industry Revenue (Million) Forecast, by Application 2019 & 2032
- Table 44: Germany Vessel Sealing Device Industry Volume (K Unit) Forecast, by Application 2019 & 2032
- Table 45: United Kingdom Vessel Sealing Device Industry Revenue (Million) Forecast, by Application 2019 & 2032
- Table 46: United Kingdom Vessel Sealing Device Industry Volume (K Unit) Forecast, by Application 2019 & 2032
- Table 47: France Vessel Sealing Device Industry Revenue (Million) Forecast, by Application 2019 & 2032
- Table 48: France Vessel Sealing Device Industry Volume (K Unit) Forecast, by Application 2019 & 2032
- Table 49: Italy Vessel Sealing Device Industry Revenue (Million) Forecast, by Application 2019 & 2032
- Table 50: Italy Vessel Sealing Device Industry Volume (K Unit) Forecast, by Application 2019 & 2032
- Table 51: Spain Vessel Sealing Device Industry Revenue (Million) Forecast, by Application 2019 & 2032
- Table 52: Spain Vessel Sealing Device Industry Volume (K Unit) Forecast, by Application 2019 & 2032
- Table 53: Rest of Europe Vessel Sealing Device Industry Revenue (Million) Forecast, by Application 2019 & 2032
- Table 54: Rest of Europe Vessel Sealing Device Industry Volume (K Unit) Forecast, by Application 2019 & 2032
- Table 55: Global Vessel Sealing Device Industry Revenue Million Forecast, by Product 2019 & 2032
- Table 56: Global Vessel Sealing Device Industry Volume K Unit Forecast, by Product 2019 & 2032
- Table 57: Global Vessel Sealing Device Industry Revenue Million Forecast, by Application 2019 & 2032
- Table 58: Global Vessel Sealing Device Industry Volume K Unit Forecast, by Application 2019 & 2032
- Table 59: Global Vessel Sealing Device Industry Revenue Million Forecast, by End User 2019 & 2032
- Table 60: Global Vessel Sealing Device Industry Volume K Unit Forecast, by End User 2019 & 2032
- Table 61: Global Vessel Sealing Device Industry Revenue Million Forecast, by Country 2019 & 2032
- Table 62: Global Vessel Sealing Device Industry Volume K Unit Forecast, by Country 2019 & 2032
- Table 63: China Vessel Sealing Device Industry Revenue (Million) Forecast, by Application 2019 & 2032
- Table 64: China Vessel Sealing Device Industry Volume (K Unit) Forecast, by Application 2019 & 2032
- Table 65: Japan Vessel Sealing Device Industry Revenue (Million) Forecast, by Application 2019 & 2032
- Table 66: Japan Vessel Sealing Device Industry Volume (K Unit) Forecast, by Application 2019 & 2032
- Table 67: India Vessel Sealing Device Industry Revenue (Million) Forecast, by Application 2019 & 2032
- Table 68: India Vessel Sealing Device Industry Volume (K Unit) Forecast, by Application 2019 & 2032
- Table 69: Australia Vessel Sealing Device Industry Revenue (Million) Forecast, by Application 2019 & 2032
- Table 70: Australia Vessel Sealing Device Industry Volume (K Unit) Forecast, by Application 2019 & 2032
- Table 71: South Korea Vessel Sealing Device Industry Revenue (Million) Forecast, by Application 2019 & 2032
- Table 72: South Korea Vessel Sealing Device Industry Volume (K Unit) Forecast, by Application 2019 & 2032
- Table 73: Rest of Asia Pacific Vessel Sealing Device Industry Revenue (Million) Forecast, by Application 2019 & 2032
- Table 74: Rest of Asia Pacific Vessel Sealing Device Industry Volume (K Unit) Forecast, by Application 2019 & 2032
- Table 75: Global Vessel Sealing Device Industry Revenue Million Forecast, by Product 2019 & 2032
- Table 76: Global Vessel Sealing Device Industry Volume K Unit Forecast, by Product 2019 & 2032
- Table 77: Global Vessel Sealing Device Industry Revenue Million Forecast, by Application 2019 & 2032
- Table 78: Global Vessel Sealing Device Industry Volume K Unit Forecast, by Application 2019 & 2032
- Table 79: Global Vessel Sealing Device Industry Revenue Million Forecast, by End User 2019 & 2032
- Table 80: Global Vessel Sealing Device Industry Volume K Unit Forecast, by End User 2019 & 2032
- Table 81: Global Vessel Sealing Device Industry Revenue Million Forecast, by Country 2019 & 2032
- Table 82: Global Vessel Sealing Device Industry Volume K Unit Forecast, by Country 2019 & 2032
- Table 83: GCC Vessel Sealing Device Industry Revenue (Million) Forecast, by Application 2019 & 2032
- Table 84: GCC Vessel Sealing Device Industry Volume (K Unit) Forecast, by Application 2019 & 2032
- Table 85: South Africa Vessel Sealing Device Industry Revenue (Million) Forecast, by Application 2019 & 2032
- Table 86: South Africa Vessel Sealing Device Industry Volume (K Unit) Forecast, by Application 2019 & 2032
- Table 87: Rest of Middle East and Africa Vessel Sealing Device Industry Revenue (Million) Forecast, by Application 2019 & 2032
- Table 88: Rest of Middle East and Africa Vessel Sealing Device Industry Volume (K Unit) Forecast, by Application 2019 & 2032
- Table 89: Global Vessel Sealing Device Industry Revenue Million Forecast, by Product 2019 & 2032
- Table 90: Global Vessel Sealing Device Industry Volume K Unit Forecast, by Product 2019 & 2032
- Table 91: Global Vessel Sealing Device Industry Revenue Million Forecast, by Application 2019 & 2032
- Table 92: Global Vessel Sealing Device Industry Volume K Unit Forecast, by Application 2019 & 2032
- Table 93: Global Vessel Sealing Device Industry Revenue Million Forecast, by End User 2019 & 2032
- Table 94: Global Vessel Sealing Device Industry Volume K Unit Forecast, by End User 2019 & 2032
- Table 95: Global Vessel Sealing Device Industry Revenue Million Forecast, by Country 2019 & 2032
- Table 96: Global Vessel Sealing Device Industry Volume K Unit Forecast, by Country 2019 & 2032
- Table 97: Brazil Vessel Sealing Device Industry Revenue (Million) Forecast, by Application 2019 & 2032
- Table 98: Brazil Vessel Sealing Device Industry Volume (K Unit) Forecast, by Application 2019 & 2032
- Table 99: Argentina Vessel Sealing Device Industry Revenue (Million) Forecast, by Application 2019 & 2032
- Table 100: Argentina Vessel Sealing Device Industry Volume (K Unit) Forecast, by Application 2019 & 2032
- Table 101: Rest of South America Vessel Sealing Device Industry Revenue (Million) Forecast, by Application 2019 & 2032
- Table 102: Rest of South America Vessel Sealing Device Industry Volume (K Unit) Forecast, by Application 2019 & 2032
Frequently Asked Questions
1. What is the projected Compound Annual Growth Rate (CAGR) of the Vessel Sealing Device Industry?
The projected CAGR is approximately 3.37%.
2. Which companies are prominent players in the Vessel Sealing Device Industry?
Key companies in the market include CONMED Corporation, Ethicon US LLC (Johnson & Johnson), Erbe Medical India Pvt Ltd, BOWA-electronic GmbH & Co KG, Hologic (Bolder Surgical Holdings Inc ), Medtronic PLC, LAMIDEY NOURY FR , OmniGuide Holdings Inc, B Braun Melsungen AG, Boston Scientific Corporation, XCELLANCE Medical Technologies, Olympus Corporation.
3. What are the main segments of the Vessel Sealing Device Industry?
The market segments include Product, Application, End User.
4. Can you provide details about the market size?
The market size is estimated to be USD 6.35 Million as of 2022.
5. What are some drivers contributing to market growth?
Increasing Number of Surgical Procedures; Technological Advancements in Vessel Sealing Devices.
6. What are the notable trends driving market growth?
The Laparoscopic Segment Accounted for a Major Share of the Market.
7. Are there any restraints impacting market growth?
Complications of Vessel Sealing Devices; High Cost of Surgeries.
8. Can you provide examples of recent developments in the market?
In October 2021, Hologic Inc. had a USD 160 million deal to acquire Bolder Surgical, a developer and manufacturer of advanced energy vessel sealing surgical devices.
9. What pricing options are available for accessing the report?
Pricing options include single-user, multi-user, and enterprise licenses priced at USD 4750, USD 5250, and USD 8750 respectively.
10. Is the market size provided in terms of value or volume?
The market size is provided in terms of value, measured in Million and volume, measured in K Unit.
11. Are there any specific market keywords associated with the report?
Yes, the market keyword associated with the report is "Vessel Sealing Device Industry," which aids in identifying and referencing the specific market segment covered.
12. How do I determine which pricing option suits my needs best?
The pricing options vary based on user requirements and access needs. Individual users may opt for single-user licenses, while businesses requiring broader access may choose multi-user or enterprise licenses for cost-effective access to the report.
13. Are there any additional resources or data provided in the Vessel Sealing Device Industry report?
While the report offers comprehensive insights, it's advisable to review the specific contents or supplementary materials provided to ascertain if additional resources or data are available.
14. How can I stay updated on further developments or reports in the Vessel Sealing Device Industry?
To stay informed about further developments, trends, and reports in the Vessel Sealing Device Industry, consider subscribing to industry newsletters, following relevant companies and organizations, or regularly checking reputable industry news sources and publications.
Methodology
Step 1 - Identification of Relevant Samples Size from Population Database


Step 2 - Approaches for Defining Global Market Size (Value, Volume* & Price*)

Note*: In applicable scenarios
Step 3 - Data Sources
Primary Research
- Web Analytics
- Survey Reports
- Research Institute
- Latest Research Reports
- Opinion Leaders
Secondary Research
- Annual Reports
- White Paper
- Latest Press Release
- Industry Association
- Paid Database
- Investor Presentations

Step 4 - Data Triangulation
Involves using different sources of information in order to increase the validity of a study
These sources are likely to be stakeholders in a program - participants, other researchers, program staff, other community members, and so on.
Then we put all data in single framework & apply various statistical tools to find out the dynamic on the market.
During the analysis stage, feedback from the stakeholder groups would be compared to determine areas of agreement as well as areas of divergence


