
Key Insights
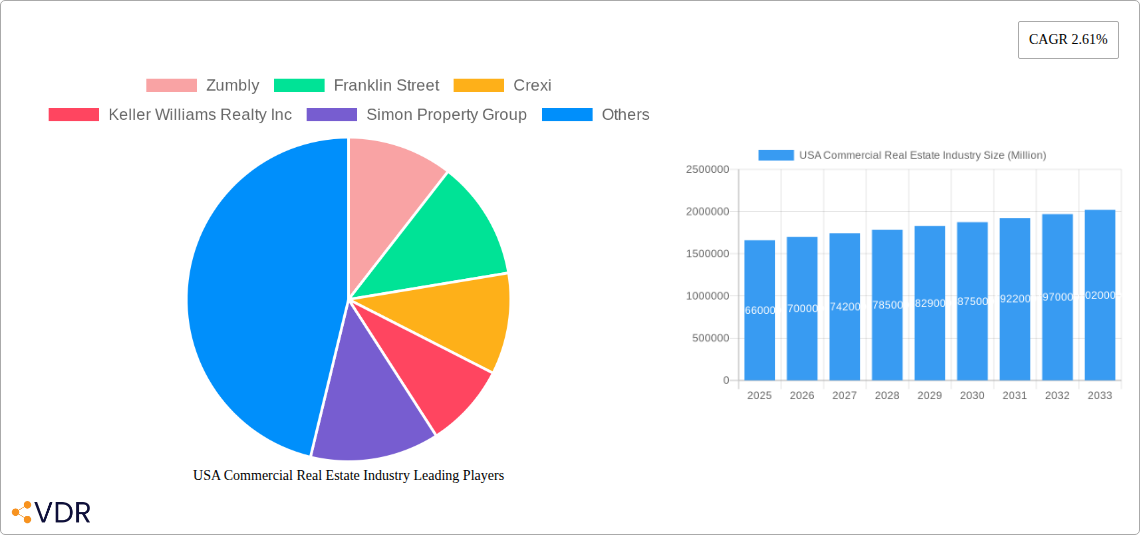
The US commercial real estate (CRE) market, valued at $1.66 trillion in 2025, is projected to experience steady growth, with a compound annual growth rate (CAGR) of 2.61% from 2025 to 2033. This growth is driven by several factors. Increased urbanization and population growth, particularly in major cities like New York, Los Angeles, and Chicago, fuel demand for office, retail, and multi-family spaces. The expansion of e-commerce and the rise of logistics and fulfillment centers contribute significantly to the industrial and logistics sector's robust performance. Furthermore, renovations and redevelopment projects in existing properties, coupled with new construction in strategically located areas, continue to shape the market landscape. However, economic uncertainty and fluctuating interest rates pose potential restraints, potentially slowing down investment and development activity in certain segments. The market is segmented by property type (offices, retail, industrial, logistics, multi-family, hospitality) and key city, reflecting geographical variations in market dynamics. While some cities experience higher growth rates due to robust economic activity and favorable demographics, others may exhibit slower growth due to local economic conditions or oversupply in specific property types. The competitive landscape includes both large national players and regional firms, indicative of a mature market with opportunities for both established and emerging companies.
The forecast period (2025-2033) anticipates a continued expansion of the CRE market, albeit at a moderate pace. Strategic investments in sustainable and technologically advanced buildings will be crucial for attracting tenants and maximizing property value. The increasing adoption of PropTech solutions, such as property management software and virtual tours, will likely improve efficiency and streamline processes. Meanwhile, potential headwinds include inflation, supply chain disruptions, and evolving work patterns impacting the demand for office spaces. Careful market analysis and a nuanced understanding of regional variations are essential for successful investment and development in the US commercial real estate sector. The long-term outlook remains positive, but careful risk management is paramount given the inherent volatility of the market.
USA Commercial Real Estate Industry: 2019-2033 Market Report
This comprehensive report provides an in-depth analysis of the USA Commercial Real Estate industry from 2019 to 2033, covering market dynamics, growth trends, key players, and future outlook. The report leverages extensive data analysis to forecast market performance and identify lucrative investment opportunities within this dynamic sector. The study period spans 2019-2033, with a base year of 2025 and a forecast period of 2025-2033. The historical period covered is 2019-2024. This report serves as an invaluable resource for investors, industry professionals, and anyone seeking a detailed understanding of the US Commercial Real Estate market.
USA Commercial Real Estate Industry Market Dynamics & Structure
The US commercial real estate market is characterized by a moderately concentrated landscape with a few large players and numerous smaller firms. Market share is dynamic, influenced by M&A activity and technological advancements. Regulatory frameworks, such as zoning laws and environmental regulations, significantly impact development and investment decisions. Competitive product substitutes, like co-working spaces impacting office demand, are reshaping the market. End-user demographics, including the shift towards remote work and e-commerce, are driving changes in demand for different property types.
- Market Concentration: The top 10 firms account for approximately xx% of the market revenue in 2025 (Estimated).
- M&A Activity: An estimated xx million USD worth of M&A deals were closed in the commercial real estate sector in 2024.
- Technological Innovation: Proptech advancements, including digital property management platforms and AI-driven valuation tools, are driving efficiency and altering market dynamics. However, adoption faces barriers such as high initial investment costs and integration complexities.
- Regulatory Landscape: Varying zoning regulations across different states and municipalities significantly impact development possibilities and investment decisions.
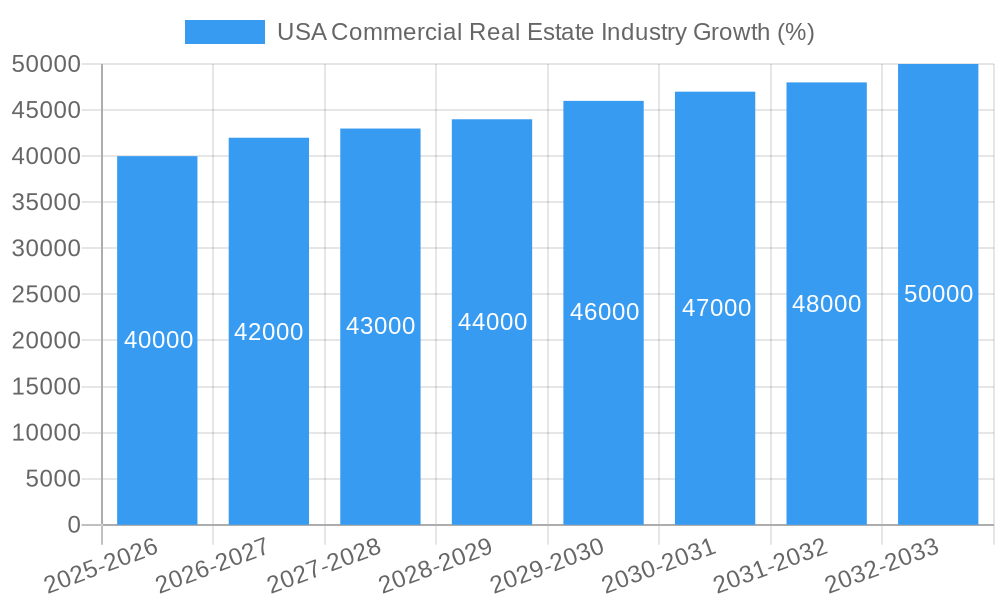
USA Commercial Real Estate Industry Growth Trends & Insights
The US commercial real estate market experienced significant growth in the years leading up to 2024, driven by factors including population growth, economic expansion, and low interest rates. While the pandemic caused a temporary downturn, the sector is exhibiting signs of recovery and continued growth. The forecast projects a Compound Annual Growth Rate (CAGR) of xx% between 2025 and 2033, reaching a market size of xx million USD by 2033. This growth is fueled by evolving consumer preferences, technological disruptions driving efficiency improvements, and increased demand in specific sectors, including industrial and logistics real estate. Adoption rates of PropTech solutions are gradually increasing but remain significantly influenced by the factors that make up the barrier to adoption previously mentioned.
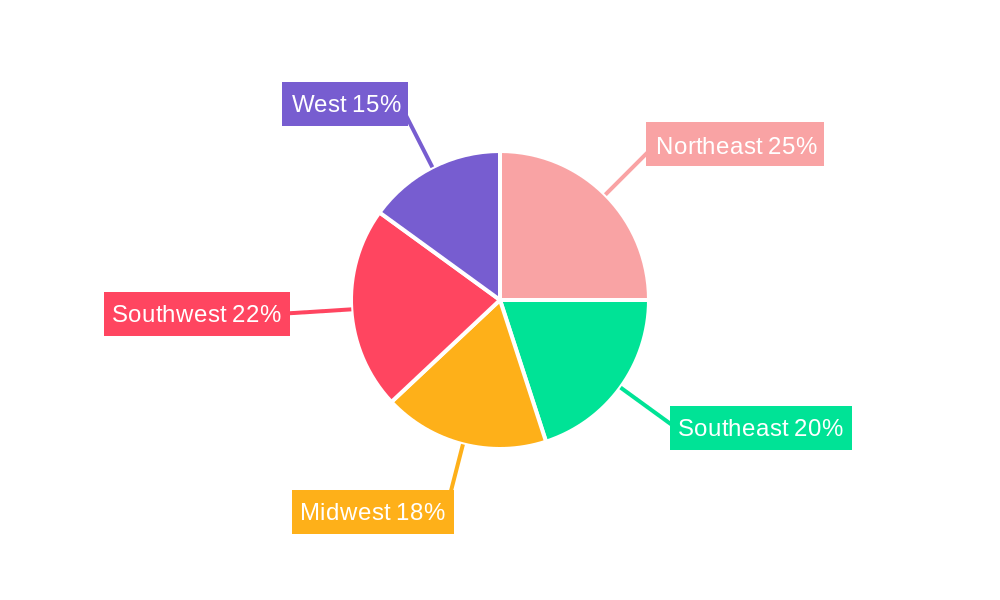
Dominant Regions, Countries, or Segments in USA Commercial Real Estate Industry
The New York, Los Angeles, and Chicago metropolitan areas constitute the most dominant regions within the US Commercial Real Estate market. These cities' strong economies, robust infrastructure, and large populations create high demand for commercial properties. The Industrial/Logistics segment is the fastest-growing segment, fuelled by e-commerce expansion and supply chain optimization.
- Key Drivers of Growth: Strong economic activity, population growth, and favorable government policies all contribute to significant growth across all segments and geographies.
- Market Share & Growth Potential: New York maintains the highest market share, followed by Los Angeles and Chicago. However, secondary markets are also experiencing significant growth, particularly in logistics-focused areas of the Southwest and Southeast. The multi-family segment also displays exceptional growth potential due to continued urbanization and millennial housing demands.
USA Commercial Real Estate Industry Product Landscape
The commercial real estate product landscape is evolving rapidly, driven by technological innovations and changing consumer preferences. Smart buildings equipped with energy-efficient systems and advanced technologies offer enhanced operational efficiency and higher rental values. Flexible office spaces, co-working environments, and build-to-suit projects address the evolving needs of businesses.
Key Drivers, Barriers & Challenges in USA Commercial Real Estate Industry
Key Drivers: Strong economic growth, increasing urbanization, and the expansion of e-commerce are primary drivers. Technological advancements, like AI-powered property management, boost efficiency and value. Government incentives for sustainable development also encourage growth.
Challenges: Supply chain disruptions increase construction costs. Regulatory complexities and permitting processes can delay projects. Intense competition and fluctuating interest rates pose significant challenges to market stability. The estimated impact of these challenges on market growth is a reduction of xx% in the CAGR.
Emerging Opportunities in USA Commercial Real Estate Industry
Emerging opportunities include the rise of sustainable building practices, the growth of the senior living sector, and the expansion of data centers. The increasing focus on wellness and technology in commercial spaces presents new investment possibilities.
Growth Accelerators in the USA Commercial Real Estate Industry
Technological breakthroughs in construction materials and building management systems accelerate growth. Strategic partnerships between developers and technology providers drive innovation. Expansion into underserved markets and adoption of sustainable development practices further stimulate market expansion.
Key Players Shaping the USA Commercial Real Estate Industry Market
- Zumbly
- Franklin Street
- Crexi
- Keller Williams Realty Inc
- Simon Property Group
- Hightower
- Mohr Partners
- Lamudi
- Coldwell Banker
- ERA Real Estate
- RE/MAX
- John Propp Commercial Group
- HqO
- Century
- Progressive Real Estate Partners
- Shannon-Waltchack
Notable Milestones in USA Commercial Real Estate Industry Sector
- 2022 Q3: Increased interest rates lead to a slowdown in transactions.
- 2023 Q1: Significant investment in PropTech solutions observed.
- 2024 Q2: Launch of several large-scale sustainable development projects.
In-Depth USA Commercial Real Estate Industry Market Outlook
The US commercial real estate market is poised for continued growth, driven by strong fundamentals and ongoing technological advancements. Strategic investments in sustainable development, technology integration, and expansion into emerging markets offer significant opportunities for growth and profitability in the coming decade. Continued monitoring of macroeconomic conditions and regulatory changes will be vital for effective market navigation.
USA Commercial Real Estate Industry Segmentation
-
1. Type
- 1.1. Offices
- 1.2. Retail
- 1.3. Industrial
- 1.4. Logistics
- 1.5. Multi-family
- 1.6. Hospitality
-
2. Key City
- 2.1. New York
- 2.2. Chicago
- 2.3. Los Angeles
- 2.4. San Francisco
- 2.5. Boston
- 2.6. Denver
- 2.7. Houston
- 2.8. Phoenix
- 2.9. Atlanta
- 2.10. Salt Lake City
USA Commercial Real Estate Industry Segmentation By Geography
-
1. North America
- 1.1. United States
- 1.2. Canada
- 1.3. Mexico
-
2. South America
- 2.1. Brazil
- 2.2. Argentina
- 2.3. Rest of South America
-
3. Europe
- 3.1. United Kingdom
- 3.2. Germany
- 3.3. France
- 3.4. Italy
- 3.5. Spain
- 3.6. Russia
- 3.7. Benelux
- 3.8. Nordics
- 3.9. Rest of Europe
-
4. Middle East & Africa
- 4.1. Turkey
- 4.2. Israel
- 4.3. GCC
- 4.4. North Africa
- 4.5. South Africa
- 4.6. Rest of Middle East & Africa
-
5. Asia Pacific
- 5.1. China
- 5.2. India
- 5.3. Japan
- 5.4. South Korea
- 5.5. ASEAN
- 5.6. Oceania
- 5.7. Rest of Asia Pacific
USA Commercial Real Estate Industry REPORT HIGHLIGHTS
| Aspects | Details |
|---|---|
| Study Period | 2019-2033 |
| Base Year | 2024 |
| Estimated Year | 2025 |
| Forecast Period | 2025-2033 |
| Historical Period | 2019-2024 |
| Growth Rate | CAGR of 2.61% from 2019-2033 |
| Segmentation |
|
Table of Contents
- 1. Introduction
- 1.1. Research Scope
- 1.2. Market Segmentation
- 1.3. Research Methodology
- 1.4. Definitions and Assumptions
- 2. Executive Summary
- 2.1. Introduction
- 3. Market Dynamics
- 3.1. Introduction
- 3.2. Market Drivers
- 3.2.1. Increasing number of startups
- 3.3. Market Restrains
- 3.3.1. Low Awareness and Privacy Issues
- 3.4. Market Trends
- 3.4.1. Industrial Sector Expected to Record High Demand
- 4. Market Factor Analysis
- 4.1. Porters Five Forces
- 4.2. Supply/Value Chain
- 4.3. PESTEL analysis
- 4.4. Market Entropy
- 4.5. Patent/Trademark Analysis
- 5. Global USA Commercial Real Estate Industry Analysis, Insights and Forecast, 2019-2031
- 5.1. Market Analysis, Insights and Forecast - by Type
- 5.1.1. Offices
- 5.1.2. Retail
- 5.1.3. Industrial
- 5.1.4. Logistics
- 5.1.5. Multi-family
- 5.1.6. Hospitality
- 5.2. Market Analysis, Insights and Forecast - by Key City
- 5.2.1. New York
- 5.2.2. Chicago
- 5.2.3. Los Angeles
- 5.2.4. San Francisco
- 5.2.5. Boston
- 5.2.6. Denver
- 5.2.7. Houston
- 5.2.8. Phoenix
- 5.2.9. Atlanta
- 5.2.10. Salt Lake City
- 5.3. Market Analysis, Insights and Forecast - by Region
- 5.3.1. North America
- 5.3.2. South America
- 5.3.3. Europe
- 5.3.4. Middle East & Africa
- 5.3.5. Asia Pacific
- 5.1. Market Analysis, Insights and Forecast - by Type
- 6. North America USA Commercial Real Estate Industry Analysis, Insights and Forecast, 2019-2031
- 6.1. Market Analysis, Insights and Forecast - by Type
- 6.1.1. Offices
- 6.1.2. Retail
- 6.1.3. Industrial
- 6.1.4. Logistics
- 6.1.5. Multi-family
- 6.1.6. Hospitality
- 6.2. Market Analysis, Insights and Forecast - by Key City
- 6.2.1. New York
- 6.2.2. Chicago
- 6.2.3. Los Angeles
- 6.2.4. San Francisco
- 6.2.5. Boston
- 6.2.6. Denver
- 6.2.7. Houston
- 6.2.8. Phoenix
- 6.2.9. Atlanta
- 6.2.10. Salt Lake City
- 6.1. Market Analysis, Insights and Forecast - by Type
- 7. South America USA Commercial Real Estate Industry Analysis, Insights and Forecast, 2019-2031
- 7.1. Market Analysis, Insights and Forecast - by Type
- 7.1.1. Offices
- 7.1.2. Retail
- 7.1.3. Industrial
- 7.1.4. Logistics
- 7.1.5. Multi-family
- 7.1.6. Hospitality
- 7.2. Market Analysis, Insights and Forecast - by Key City
- 7.2.1. New York
- 7.2.2. Chicago
- 7.2.3. Los Angeles
- 7.2.4. San Francisco
- 7.2.5. Boston
- 7.2.6. Denver
- 7.2.7. Houston
- 7.2.8. Phoenix
- 7.2.9. Atlanta
- 7.2.10. Salt Lake City
- 7.1. Market Analysis, Insights and Forecast - by Type
- 8. Europe USA Commercial Real Estate Industry Analysis, Insights and Forecast, 2019-2031
- 8.1. Market Analysis, Insights and Forecast - by Type
- 8.1.1. Offices
- 8.1.2. Retail
- 8.1.3. Industrial
- 8.1.4. Logistics
- 8.1.5. Multi-family
- 8.1.6. Hospitality
- 8.2. Market Analysis, Insights and Forecast - by Key City
- 8.2.1. New York
- 8.2.2. Chicago
- 8.2.3. Los Angeles
- 8.2.4. San Francisco
- 8.2.5. Boston
- 8.2.6. Denver
- 8.2.7. Houston
- 8.2.8. Phoenix
- 8.2.9. Atlanta
- 8.2.10. Salt Lake City
- 8.1. Market Analysis, Insights and Forecast - by Type
- 9. Middle East & Africa USA Commercial Real Estate Industry Analysis, Insights and Forecast, 2019-2031
- 9.1. Market Analysis, Insights and Forecast - by Type
- 9.1.1. Offices
- 9.1.2. Retail
- 9.1.3. Industrial
- 9.1.4. Logistics
- 9.1.5. Multi-family
- 9.1.6. Hospitality
- 9.2. Market Analysis, Insights and Forecast - by Key City
- 9.2.1. New York
- 9.2.2. Chicago
- 9.2.3. Los Angeles
- 9.2.4. San Francisco
- 9.2.5. Boston
- 9.2.6. Denver
- 9.2.7. Houston
- 9.2.8. Phoenix
- 9.2.9. Atlanta
- 9.2.10. Salt Lake City
- 9.1. Market Analysis, Insights and Forecast - by Type
- 10. Asia Pacific USA Commercial Real Estate Industry Analysis, Insights and Forecast, 2019-2031
- 10.1. Market Analysis, Insights and Forecast - by Type
- 10.1.1. Offices
- 10.1.2. Retail
- 10.1.3. Industrial
- 10.1.4. Logistics
- 10.1.5. Multi-family
- 10.1.6. Hospitality
- 10.2. Market Analysis, Insights and Forecast - by Key City
- 10.2.1. New York
- 10.2.2. Chicago
- 10.2.3. Los Angeles
- 10.2.4. San Francisco
- 10.2.5. Boston
- 10.2.6. Denver
- 10.2.7. Houston
- 10.2.8. Phoenix
- 10.2.9. Atlanta
- 10.2.10. Salt Lake City
- 10.1. Market Analysis, Insights and Forecast - by Type
- 11. Northeast USA Commercial Real Estate Industry Analysis, Insights and Forecast, 2019-2031
- 12. Southeast USA Commercial Real Estate Industry Analysis, Insights and Forecast, 2019-2031
- 13. Midwest USA Commercial Real Estate Industry Analysis, Insights and Forecast, 2019-2031
- 14. Southwest USA Commercial Real Estate Industry Analysis, Insights and Forecast, 2019-2031
- 15. West USA Commercial Real Estate Industry Analysis, Insights and Forecast, 2019-2031
- 16. Competitive Analysis
- 16.1. Global Market Share Analysis 2024
- 16.2. Company Profiles
- 16.2.1 Zumbly
- 16.2.1.1. Overview
- 16.2.1.2. Products
- 16.2.1.3. SWOT Analysis
- 16.2.1.4. Recent Developments
- 16.2.1.5. Financials (Based on Availability)
- 16.2.2 Franklin Street
- 16.2.2.1. Overview
- 16.2.2.2. Products
- 16.2.2.3. SWOT Analysis
- 16.2.2.4. Recent Developments
- 16.2.2.5. Financials (Based on Availability)
- 16.2.3 Crexi
- 16.2.3.1. Overview
- 16.2.3.2. Products
- 16.2.3.3. SWOT Analysis
- 16.2.3.4. Recent Developments
- 16.2.3.5. Financials (Based on Availability)
- 16.2.4 Keller Williams Realty Inc
- 16.2.4.1. Overview
- 16.2.4.2. Products
- 16.2.4.3. SWOT Analysis
- 16.2.4.4. Recent Developments
- 16.2.4.5. Financials (Based on Availability)
- 16.2.5 Simon Property Group
- 16.2.5.1. Overview
- 16.2.5.2. Products
- 16.2.5.3. SWOT Analysis
- 16.2.5.4. Recent Developments
- 16.2.5.5. Financials (Based on Availability)
- 16.2.6 Hightower
- 16.2.6.1. Overview
- 16.2.6.2. Products
- 16.2.6.3. SWOT Analysis
- 16.2.6.4. Recent Developments
- 16.2.6.5. Financials (Based on Availability)
- 16.2.7 Mohr Partners
- 16.2.7.1. Overview
- 16.2.7.2. Products
- 16.2.7.3. SWOT Analysis
- 16.2.7.4. Recent Developments
- 16.2.7.5. Financials (Based on Availability)
- 16.2.8 Lamudi
- 16.2.8.1. Overview
- 16.2.8.2. Products
- 16.2.8.3. SWOT Analysis
- 16.2.8.4. Recent Developments
- 16.2.8.5. Financials (Based on Availability)
- 16.2.9 Coldwell Banker
- 16.2.9.1. Overview
- 16.2.9.2. Products
- 16.2.9.3. SWOT Analysis
- 16.2.9.4. Recent Developments
- 16.2.9.5. Financials (Based on Availability)
- 16.2.10 ERA Real Estate
- 16.2.10.1. Overview
- 16.2.10.2. Products
- 16.2.10.3. SWOT Analysis
- 16.2.10.4. Recent Developments
- 16.2.10.5. Financials (Based on Availability)
- 16.2.11 RE/MAX
- 16.2.11.1. Overview
- 16.2.11.2. Products
- 16.2.11.3. SWOT Analysis
- 16.2.11.4. Recent Developments
- 16.2.11.5. Financials (Based on Availability)
- 16.2.12 John Propp Commercial Group
- 16.2.12.1. Overview
- 16.2.12.2. Products
- 16.2.12.3. SWOT Analysis
- 16.2.12.4. Recent Developments
- 16.2.12.5. Financials (Based on Availability)
- 16.2.13 HqO**List Not Exhaustive
- 16.2.13.1. Overview
- 16.2.13.2. Products
- 16.2.13.3. SWOT Analysis
- 16.2.13.4. Recent Developments
- 16.2.13.5. Financials (Based on Availability)
- 16.2.14 Century
- 16.2.14.1. Overview
- 16.2.14.2. Products
- 16.2.14.3. SWOT Analysis
- 16.2.14.4. Recent Developments
- 16.2.14.5. Financials (Based on Availability)
- 16.2.15 Progressive Real Estate Partners
- 16.2.15.1. Overview
- 16.2.15.2. Products
- 16.2.15.3. SWOT Analysis
- 16.2.15.4. Recent Developments
- 16.2.15.5. Financials (Based on Availability)
- 16.2.16 Shannon-Waltchack
- 16.2.16.1. Overview
- 16.2.16.2. Products
- 16.2.16.3. SWOT Analysis
- 16.2.16.4. Recent Developments
- 16.2.16.5. Financials (Based on Availability)
- 16.2.1 Zumbly
List of Figures
- Figure 1: Global USA Commercial Real Estate Industry Revenue Breakdown (Million, %) by Region 2024 & 2032
- Figure 2: United states USA Commercial Real Estate Industry Revenue (Million), by Country 2024 & 2032
- Figure 3: United states USA Commercial Real Estate Industry Revenue Share (%), by Country 2024 & 2032
- Figure 4: North America USA Commercial Real Estate Industry Revenue (Million), by Type 2024 & 2032
- Figure 5: North America USA Commercial Real Estate Industry Revenue Share (%), by Type 2024 & 2032
- Figure 6: North America USA Commercial Real Estate Industry Revenue (Million), by Key City 2024 & 2032
- Figure 7: North America USA Commercial Real Estate Industry Revenue Share (%), by Key City 2024 & 2032
- Figure 8: North America USA Commercial Real Estate Industry Revenue (Million), by Country 2024 & 2032
- Figure 9: North America USA Commercial Real Estate Industry Revenue Share (%), by Country 2024 & 2032
- Figure 10: South America USA Commercial Real Estate Industry Revenue (Million), by Type 2024 & 2032
- Figure 11: South America USA Commercial Real Estate Industry Revenue Share (%), by Type 2024 & 2032
- Figure 12: South America USA Commercial Real Estate Industry Revenue (Million), by Key City 2024 & 2032
- Figure 13: South America USA Commercial Real Estate Industry Revenue Share (%), by Key City 2024 & 2032
- Figure 14: South America USA Commercial Real Estate Industry Revenue (Million), by Country 2024 & 2032
- Figure 15: South America USA Commercial Real Estate Industry Revenue Share (%), by Country 2024 & 2032
- Figure 16: Europe USA Commercial Real Estate Industry Revenue (Million), by Type 2024 & 2032
- Figure 17: Europe USA Commercial Real Estate Industry Revenue Share (%), by Type 2024 & 2032
- Figure 18: Europe USA Commercial Real Estate Industry Revenue (Million), by Key City 2024 & 2032
- Figure 19: Europe USA Commercial Real Estate Industry Revenue Share (%), by Key City 2024 & 2032
- Figure 20: Europe USA Commercial Real Estate Industry Revenue (Million), by Country 2024 & 2032
- Figure 21: Europe USA Commercial Real Estate Industry Revenue Share (%), by Country 2024 & 2032
- Figure 22: Middle East & Africa USA Commercial Real Estate Industry Revenue (Million), by Type 2024 & 2032
- Figure 23: Middle East & Africa USA Commercial Real Estate Industry Revenue Share (%), by Type 2024 & 2032
- Figure 24: Middle East & Africa USA Commercial Real Estate Industry Revenue (Million), by Key City 2024 & 2032
- Figure 25: Middle East & Africa USA Commercial Real Estate Industry Revenue Share (%), by Key City 2024 & 2032
- Figure 26: Middle East & Africa USA Commercial Real Estate Industry Revenue (Million), by Country 2024 & 2032
- Figure 27: Middle East & Africa USA Commercial Real Estate Industry Revenue Share (%), by Country 2024 & 2032
- Figure 28: Asia Pacific USA Commercial Real Estate Industry Revenue (Million), by Type 2024 & 2032
- Figure 29: Asia Pacific USA Commercial Real Estate Industry Revenue Share (%), by Type 2024 & 2032
- Figure 30: Asia Pacific USA Commercial Real Estate Industry Revenue (Million), by Key City 2024 & 2032
- Figure 31: Asia Pacific USA Commercial Real Estate Industry Revenue Share (%), by Key City 2024 & 2032
- Figure 32: Asia Pacific USA Commercial Real Estate Industry Revenue (Million), by Country 2024 & 2032
- Figure 33: Asia Pacific USA Commercial Real Estate Industry Revenue Share (%), by Country 2024 & 2032
List of Tables
- Table 1: Global USA Commercial Real Estate Industry Revenue Million Forecast, by Region 2019 & 2032
- Table 2: Global USA Commercial Real Estate Industry Revenue Million Forecast, by Type 2019 & 2032
- Table 3: Global USA Commercial Real Estate Industry Revenue Million Forecast, by Key City 2019 & 2032
- Table 4: Global USA Commercial Real Estate Industry Revenue Million Forecast, by Region 2019 & 2032
- Table 5: Global USA Commercial Real Estate Industry Revenue Million Forecast, by Country 2019 & 2032
- Table 6: Northeast USA Commercial Real Estate Industry Revenue (Million) Forecast, by Application 2019 & 2032
- Table 7: Southeast USA Commercial Real Estate Industry Revenue (Million) Forecast, by Application 2019 & 2032
- Table 8: Midwest USA Commercial Real Estate Industry Revenue (Million) Forecast, by Application 2019 & 2032
- Table 9: Southwest USA Commercial Real Estate Industry Revenue (Million) Forecast, by Application 2019 & 2032
- Table 10: West USA Commercial Real Estate Industry Revenue (Million) Forecast, by Application 2019 & 2032
- Table 11: Global USA Commercial Real Estate Industry Revenue Million Forecast, by Type 2019 & 2032
- Table 12: Global USA Commercial Real Estate Industry Revenue Million Forecast, by Key City 2019 & 2032
- Table 13: Global USA Commercial Real Estate Industry Revenue Million Forecast, by Country 2019 & 2032
- Table 14: United States USA Commercial Real Estate Industry Revenue (Million) Forecast, by Application 2019 & 2032
- Table 15: Canada USA Commercial Real Estate Industry Revenue (Million) Forecast, by Application 2019 & 2032
- Table 16: Mexico USA Commercial Real Estate Industry Revenue (Million) Forecast, by Application 2019 & 2032
- Table 17: Global USA Commercial Real Estate Industry Revenue Million Forecast, by Type 2019 & 2032
- Table 18: Global USA Commercial Real Estate Industry Revenue Million Forecast, by Key City 2019 & 2032
- Table 19: Global USA Commercial Real Estate Industry Revenue Million Forecast, by Country 2019 & 2032
- Table 20: Brazil USA Commercial Real Estate Industry Revenue (Million) Forecast, by Application 2019 & 2032
- Table 21: Argentina USA Commercial Real Estate Industry Revenue (Million) Forecast, by Application 2019 & 2032
- Table 22: Rest of South America USA Commercial Real Estate Industry Revenue (Million) Forecast, by Application 2019 & 2032
- Table 23: Global USA Commercial Real Estate Industry Revenue Million Forecast, by Type 2019 & 2032
- Table 24: Global USA Commercial Real Estate Industry Revenue Million Forecast, by Key City 2019 & 2032
- Table 25: Global USA Commercial Real Estate Industry Revenue Million Forecast, by Country 2019 & 2032
- Table 26: United Kingdom USA Commercial Real Estate Industry Revenue (Million) Forecast, by Application 2019 & 2032
- Table 27: Germany USA Commercial Real Estate Industry Revenue (Million) Forecast, by Application 2019 & 2032
- Table 28: France USA Commercial Real Estate Industry Revenue (Million) Forecast, by Application 2019 & 2032
- Table 29: Italy USA Commercial Real Estate Industry Revenue (Million) Forecast, by Application 2019 & 2032
- Table 30: Spain USA Commercial Real Estate Industry Revenue (Million) Forecast, by Application 2019 & 2032
- Table 31: Russia USA Commercial Real Estate Industry Revenue (Million) Forecast, by Application 2019 & 2032
- Table 32: Benelux USA Commercial Real Estate Industry Revenue (Million) Forecast, by Application 2019 & 2032
- Table 33: Nordics USA Commercial Real Estate Industry Revenue (Million) Forecast, by Application 2019 & 2032
- Table 34: Rest of Europe USA Commercial Real Estate Industry Revenue (Million) Forecast, by Application 2019 & 2032
- Table 35: Global USA Commercial Real Estate Industry Revenue Million Forecast, by Type 2019 & 2032
- Table 36: Global USA Commercial Real Estate Industry Revenue Million Forecast, by Key City 2019 & 2032
- Table 37: Global USA Commercial Real Estate Industry Revenue Million Forecast, by Country 2019 & 2032
- Table 38: Turkey USA Commercial Real Estate Industry Revenue (Million) Forecast, by Application 2019 & 2032
- Table 39: Israel USA Commercial Real Estate Industry Revenue (Million) Forecast, by Application 2019 & 2032
- Table 40: GCC USA Commercial Real Estate Industry Revenue (Million) Forecast, by Application 2019 & 2032
- Table 41: North Africa USA Commercial Real Estate Industry Revenue (Million) Forecast, by Application 2019 & 2032
- Table 42: South Africa USA Commercial Real Estate Industry Revenue (Million) Forecast, by Application 2019 & 2032
- Table 43: Rest of Middle East & Africa USA Commercial Real Estate Industry Revenue (Million) Forecast, by Application 2019 & 2032
- Table 44: Global USA Commercial Real Estate Industry Revenue Million Forecast, by Type 2019 & 2032
- Table 45: Global USA Commercial Real Estate Industry Revenue Million Forecast, by Key City 2019 & 2032
- Table 46: Global USA Commercial Real Estate Industry Revenue Million Forecast, by Country 2019 & 2032
- Table 47: China USA Commercial Real Estate Industry Revenue (Million) Forecast, by Application 2019 & 2032
- Table 48: India USA Commercial Real Estate Industry Revenue (Million) Forecast, by Application 2019 & 2032
- Table 49: Japan USA Commercial Real Estate Industry Revenue (Million) Forecast, by Application 2019 & 2032
- Table 50: South Korea USA Commercial Real Estate Industry Revenue (Million) Forecast, by Application 2019 & 2032
- Table 51: ASEAN USA Commercial Real Estate Industry Revenue (Million) Forecast, by Application 2019 & 2032
- Table 52: Oceania USA Commercial Real Estate Industry Revenue (Million) Forecast, by Application 2019 & 2032
- Table 53: Rest of Asia Pacific USA Commercial Real Estate Industry Revenue (Million) Forecast, by Application 2019 & 2032
Frequently Asked Questions
1. What is the projected Compound Annual Growth Rate (CAGR) of the USA Commercial Real Estate Industry?
The projected CAGR is approximately 2.61%.
2. Which companies are prominent players in the USA Commercial Real Estate Industry?
Key companies in the market include Zumbly, Franklin Street, Crexi, Keller Williams Realty Inc, Simon Property Group, Hightower, Mohr Partners, Lamudi, Coldwell Banker, ERA Real Estate, RE/MAX, John Propp Commercial Group, HqO**List Not Exhaustive, Century, Progressive Real Estate Partners, Shannon-Waltchack.
3. What are the main segments of the USA Commercial Real Estate Industry?
The market segments include Type, Key City.
4. Can you provide details about the market size?
The market size is estimated to be USD 1.66 Million as of 2022.
5. What are some drivers contributing to market growth?
Increasing number of startups.
6. What are the notable trends driving market growth?
Industrial Sector Expected to Record High Demand.
7. Are there any restraints impacting market growth?
Low Awareness and Privacy Issues.
8. Can you provide examples of recent developments in the market?
N/A
9. What pricing options are available for accessing the report?
Pricing options include single-user, multi-user, and enterprise licenses priced at USD 3800, USD 4500, and USD 5800 respectively.
10. Is the market size provided in terms of value or volume?
The market size is provided in terms of value, measured in Million.
11. Are there any specific market keywords associated with the report?
Yes, the market keyword associated with the report is "USA Commercial Real Estate Industry," which aids in identifying and referencing the specific market segment covered.
12. How do I determine which pricing option suits my needs best?
The pricing options vary based on user requirements and access needs. Individual users may opt for single-user licenses, while businesses requiring broader access may choose multi-user or enterprise licenses for cost-effective access to the report.
13. Are there any additional resources or data provided in the USA Commercial Real Estate Industry report?
While the report offers comprehensive insights, it's advisable to review the specific contents or supplementary materials provided to ascertain if additional resources or data are available.
14. How can I stay updated on further developments or reports in the USA Commercial Real Estate Industry?
To stay informed about further developments, trends, and reports in the USA Commercial Real Estate Industry, consider subscribing to industry newsletters, following relevant companies and organizations, or regularly checking reputable industry news sources and publications.
Methodology
Step 1 - Identification of Relevant Samples Size from Population Database


Step 2 - Approaches for Defining Global Market Size (Value, Volume* & Price*)

Note*: In applicable scenarios
Step 3 - Data Sources
Primary Research
- Web Analytics
- Survey Reports
- Research Institute
- Latest Research Reports
- Opinion Leaders
Secondary Research
- Annual Reports
- White Paper
- Latest Press Release
- Industry Association
- Paid Database
- Investor Presentations

Step 4 - Data Triangulation
Involves using different sources of information in order to increase the validity of a study
These sources are likely to be stakeholders in a program - participants, other researchers, program staff, other community members, and so on.
Then we put all data in single framework & apply various statistical tools to find out the dynamic on the market.
During the analysis stage, feedback from the stakeholder groups would be compared to determine areas of agreement as well as areas of divergence


