

Key Insights
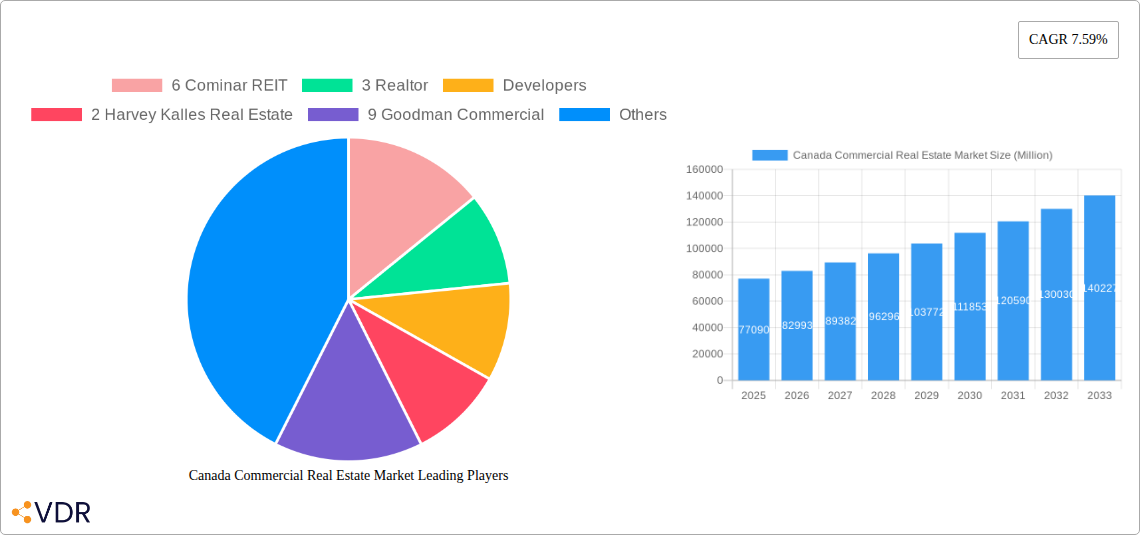
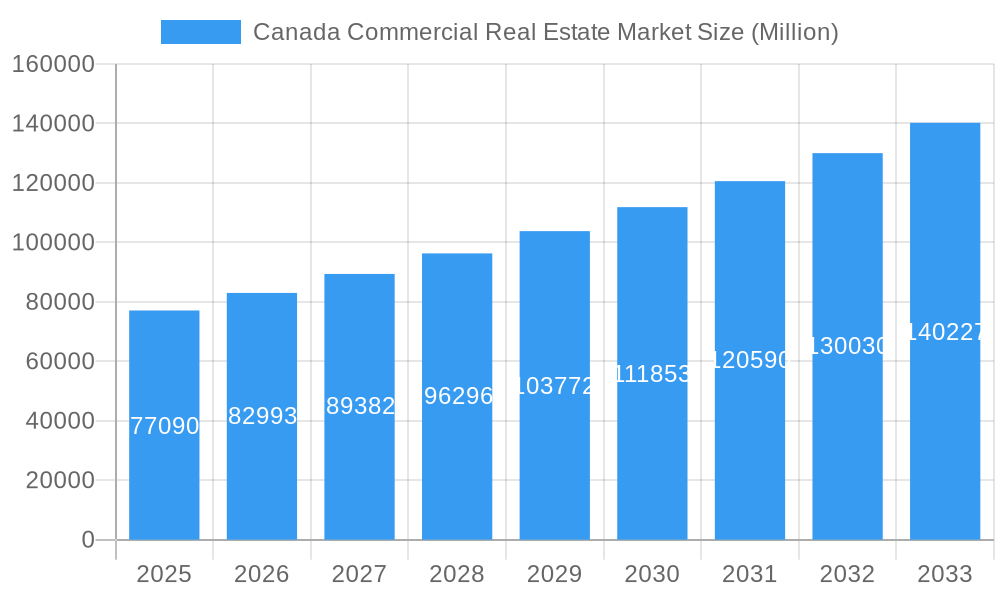
The Canadian commercial real estate market, valued at $77.09 billion in 2025, is projected to experience robust growth, driven by a Compound Annual Growth Rate (CAGR) of 7.59% from 2025 to 2033. This expansion is fueled by several key factors. Increasing urbanization and population growth, particularly in major cities like Toronto, Vancouver, and Calgary, are stimulating demand for office, retail, and multi-family spaces. Furthermore, a burgeoning technology sector and government investments in infrastructure are further bolstering the market. The industrial sector benefits from e-commerce growth and supply chain optimization initiatives, creating a strong demand for warehousing and logistics facilities. However, challenges exist, including rising interest rates potentially impacting investment and construction costs, and ongoing economic uncertainty that could influence tenant demand in certain sectors. The market is segmented by property type (office, retail, industrial, multi-family, hospitality) and key geographic locations (Toronto, Vancouver, Calgary, Ottawa, Montreal, Edmonton, and the rest of Canada), allowing investors and developers to target specific niches. Competition is intense, with a mix of large REITs like Cominar REIT and Dream Office REIT, prominent developers such as Pinnacle International and TAG Developments, and numerous smaller firms and brokerage firms actively participating.
Canada Commercial Real Estate Market Market Size (In Billion)
The forecast period (2025-2033) anticipates continued growth, although the rate may fluctuate depending on macroeconomic conditions. Regional variations are expected, with major metropolitan areas likely outpacing growth in smaller cities. The hospitality sector’s recovery from the pandemic will significantly impact its market segment, while the long-term sustainability of office space demand in the face of hybrid work models remains a key consideration. Strategic investments in sustainable building practices and technology integration will likely shape the competitive landscape, favoring companies that prioritize environmental responsibility and technological advancements in property management. The market’s overall trajectory suggests a positive outlook, but careful monitoring of economic indicators and evolving market dynamics is crucial for success.
Canada Commercial Real Estate Market Company Market Share
Canada Commercial Real Estate Market: 2019-2033 Forecast
This comprehensive report provides an in-depth analysis of the Canadian commercial real estate market, covering the period from 2019 to 2033. We delve into market dynamics, growth trends, dominant segments, and key players, offering valuable insights for investors, developers, and industry professionals. The report utilizes data from the historical period (2019-2024), the base year (2025), and projects the market outlook through the forecast period (2025-2033). Key segments analyzed include Office, Retail, Industrial, Multi-family, and Hospitality across major Canadian cities: Toronto, Vancouver, Calgary, Ottawa, Montreal, Edmonton, and the Rest of Canada.
Canada Commercial Real Estate Market Dynamics & Structure
The Canadian commercial real estate market is characterized by a moderately concentrated landscape, with significant players like Cominar REIT, Goodman Commercial, and Dream Office REIT holding substantial market share. However, a large number of smaller firms, real estate brokerage firms, and developers contribute to a dynamic and competitive environment. Technological innovations, such as proptech solutions for property management and tenant engagement, are gradually transforming the sector, though adoption rates vary across segments.
- Market Concentration: The top 10 players control approximately xx% of the market (2025 estimate).
- Technological Innovation: Proptech adoption is increasing, focusing on data analytics, virtual tours, and streamlined processes. Barriers include legacy systems and cost of implementation.
- Regulatory Framework: Provincial and municipal regulations significantly influence development and investment decisions. Recent policy shifts focusing on affordability and sustainability are impacting the market.
- Competitive Product Substitutes: The rise of co-working spaces and flexible office solutions poses a competitive threat to traditional office leasing.
- End-User Demographics: Demand is influenced by evolving workplace trends, e-commerce growth (affecting retail), and shifts in population distribution.
- M&A Trends: The number of M&A deals in the historical period (2019-2024) averaged xx deals annually, valued at approximately xx Million. This trend is projected to continue with an increase in consolidation among smaller players.
Canada Commercial Real Estate Market Growth Trends & Insights
The Canadian commercial real estate market experienced a CAGR of xx% during the historical period (2019-2024). This growth was driven primarily by strong economic conditions in certain regions and sectors, particularly in major urban centers. However, market fluctuations have been observed, influenced by factors such as interest rate changes, economic uncertainty, and the impact of global events. The forecast period (2025-2033) projects a CAGR of xx%, driven by anticipated increases in population, urbanization, and continued technological advancements. Market penetration for various segments will vary, with the industrial sector expected to show robust growth due to e-commerce expansion. The adoption of sustainable practices and the demand for energy-efficient buildings are increasing, potentially leading to higher construction costs and impacting profitability. Shifting consumer behavior, driven by remote work trends and evolving retail landscapes, present both challenges and opportunities for stakeholders.
Dominant Regions, Countries, or Segments in Canada Commercial Real Estate Market
Toronto and Vancouver remain the dominant regions, commanding a significant market share (approximately xx% combined in 2025) due to strong population growth, robust economies, and established infrastructure. The Industrial segment is expected to exhibit the highest growth rate during the forecast period, fuelled by the expansion of e-commerce and the increasing demand for logistics and warehousing space.
- Toronto: Strong employment base, diverse economy, and high population density drive demand across all commercial segments.
- Vancouver: Similar to Toronto, a thriving economy, immigration, and high population growth fuel demand.
- Industrial Sector: E-commerce growth and supply chain changes are driving a surge in demand for warehouse and distribution centers.
- Multi-family: Rapid urbanization and growing population are driving demand for rental properties.
- Other Cities: Calgary, Montreal, and Edmonton exhibit moderate growth potential, primarily driven by regional economic conditions.
Canada Commercial Real Estate Market Product Landscape
Innovations in the commercial real estate sector involve smart building technologies, sustainable design, and flexible workspace solutions. These advancements focus on enhancing energy efficiency, improving tenant experience, and optimizing operational costs. The unique selling propositions often include superior environmental credentials, advanced technological integration, and tailored space configurations to meet evolving tenant requirements. Performance metrics are increasingly focused on environmental impact (carbon footprint), energy consumption, and tenant satisfaction.
Key Drivers, Barriers & Challenges in Canada Commercial Real Real Estate Market
Key Drivers: Strong population growth in major cities, expansion of e-commerce driving industrial demand, government incentives for sustainable development, and increasing foreign investment are key drivers.
Key Barriers & Challenges: Rising construction costs, interest rate fluctuations impacting financing, regulatory complexities, and labor shortages pose significant challenges. Supply chain disruptions continue to impact construction timelines and costs, potentially leading to project delays and budget overruns.
Emerging Opportunities in Canada Commercial Real Estate Market
Emerging opportunities lie in sustainable building practices, the development of flexible and adaptable workspaces, and the expansion into secondary markets with strong growth potential. The increasing focus on wellness and health in the workplace presents a lucrative niche for developers.
Growth Accelerators in the Canada Commercial Real Estate Market Industry
Technological advancements, strategic partnerships between developers and technology providers, and the expansion into new markets are accelerating growth. Initiatives promoting sustainable development and efficient building practices are also driving market evolution.
Key Players Shaping the Canada Commercial Real Estate Market Market
- 6 Cominar REIT
- 3 Realtor, Developers
- 2 Harvey Kalles Real Estate
- 9 Goodman Commercial
- 3 Amacon
- 4 Pinnacle International
- 1 Brookfield Global Integrated Solutions
- Real Estate Brokerage Firms
- 1 Manulife Real Estate
- 10 Redev Properties*
- 7 Allied REIT**List Not Exhaustive
- 2 WestBank Corp
- 1 Onni Group
- 6 Knights Bridge Development Corp
- 5 Dream Office REIT
- Other Companies (startups associations etc )
- 2 Relogix
- 8 TAG Developments
- 7 Chard Development
- 4 Hausway
- 3 Maxwell Realty*
- 5 Anthem Properties Group Limited
Notable Milestones in Canada Commercial Real Estate Market Sector
- June 2023: Prologis, Inc.'s acquisition of 14 million square feet of industrial properties from Blackstone for USD 3.1 billion signals strong investor confidence in the industrial sector and potentially signifies further consolidation within the sector.
- May 2023: VICI Properties Inc.'s acquisition of Century Casinos' real estate assets in Alberta for USD 164.7 million demonstrates the continued growth in the Canadian gaming sector and attracts further investment into the hospitality segment.
In-Depth Canada Commercial Real Estate Market Market Outlook
The Canadian commercial real estate market is poised for continued growth, driven by strong fundamentals and emerging opportunities. Strategic investments in technology, sustainable development, and expansion into underserved markets will be crucial for long-term success. The market's ability to adapt to evolving trends and address challenges such as affordability and sustainability will determine its trajectory in the coming years.
Canada Commercial Real Estate Market Segmentation
-
1. Type
- 1.1. Office
- 1.2. Retail
- 1.3. Industrial
- 1.4. Multi-family
- 1.5. Hospitality
-
2. Key Cities
- 2.1. Toronto
- 2.2. Vancouver
- 2.3. Calgary
- 2.4. Ottawa
- 2.5. Montreal
- 2.6. Edmonton
- 2.7. Rest of Canada
Canada Commercial Real Estate Market Segmentation By Geography
- 1. Canada
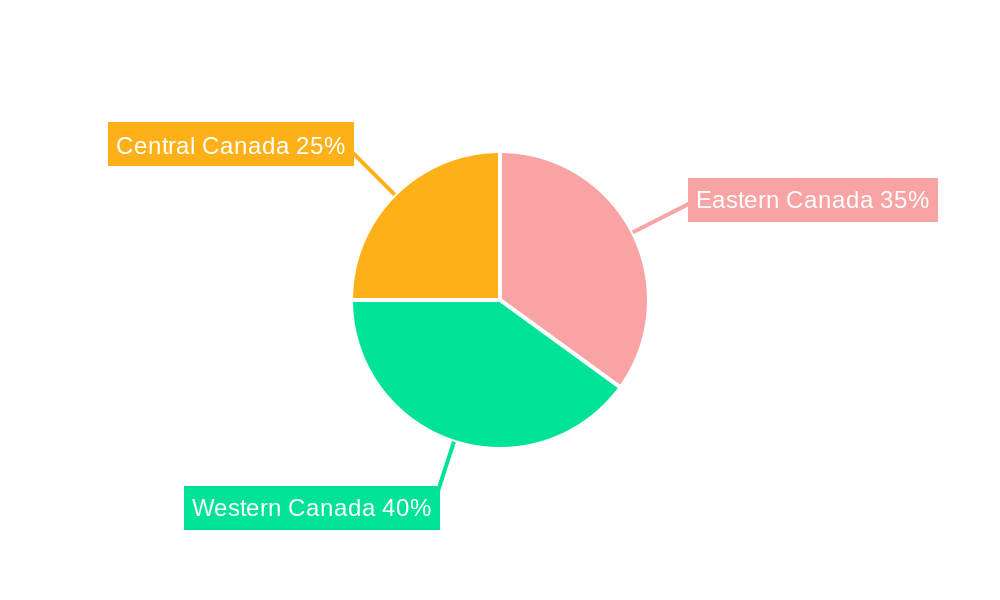
Canada Commercial Real Estate Market Regional Market Share
Geographic Coverage of Canada Commercial Real Estate Market
Canada Commercial Real Estate Market REPORT HIGHLIGHTS
| Aspects | Details |
|---|---|
| Study Period | 2020-2034 |
| Base Year | 2025 |
| Estimated Year | 2026 |
| Forecast Period | 2026-2034 |
| Historical Period | 2020-2025 |
| Growth Rate | CAGR of 7.59% from 2020-2034 |
| Segmentation |
|
Table of Contents
- 1. Introduction
- 1.1. Research Scope
- 1.2. Market Segmentation
- 1.3. Research Objective
- 1.4. Definitions and Assumptions
- 2. Executive Summary
- 2.1. Market Snapshot
- 3. Market Dynamics
- 3.1. Market Drivers
- 3.2. Market Restrains
- 3.3. Market Trends
- 3.4. Market Opportunities
- 4. Market Factor Analysis
- 4.1. Porters Five Forces
- 4.1.1. Bargaining Power of Suppliers
- 4.1.2. Bargaining Power of Buyers
- 4.1.3. Threat of New Entrants
- 4.1.4. Threat of Substitutes
- 4.1.5. Competitive Rivalry
- 4.2. PESTEL analysis
- 4.3. BCG Analysis
- 4.3.1. Stars (High Growth, High Market Share)
- 4.3.2. Cash Cows (Low Growth, High Market Share)
- 4.3.3. Question Mark (High Growth, Low Market Share)
- 4.3.4. Dogs (Low Growth, Low Market Share)
- 4.4. Ansoff Matrix Analysis
- 4.5. Supply Chain Analysis
- 4.6. Regulatory Landscape
- 4.7. Current Market Potential and Opportunity Assessment (TAM–SAM–SOM Framework)
- 4.8. VDR Analyst Note
- 4.1. Porters Five Forces
- 5. Market Analysis, Insights and Forecast 2021-2033
- 5.1. Market Analysis, Insights and Forecast - by Type
- 5.1.1. Office
- 5.1.2. Retail
- 5.1.3. Industrial
- 5.1.4. Multi-family
- 5.1.5. Hospitality
- 5.2. Market Analysis, Insights and Forecast - by Key Cities
- 5.2.1. Toronto
- 5.2.2. Vancouver
- 5.2.3. Calgary
- 5.2.4. Ottawa
- 5.2.5. Montreal
- 5.2.6. Edmonton
- 5.2.7. Rest of Canada
- 5.3. Market Analysis, Insights and Forecast - by Region
- 5.3.1. Canada
- 5.1. Market Analysis, Insights and Forecast - by Type
- 6. Canada Commercial Real Estate Market Analysis, Insights and Forecast, 2021-2033
- 6.1. Market Analysis, Insights and Forecast - by Type
- 6.1.1. Office
- 6.1.2. Retail
- 6.1.3. Industrial
- 6.1.4. Multi-family
- 6.1.5. Hospitality
- 6.2. Market Analysis, Insights and Forecast - by Key Cities
- 6.2.1. Toronto
- 6.2.2. Vancouver
- 6.2.3. Calgary
- 6.2.4. Ottawa
- 6.2.5. Montreal
- 6.2.6. Edmonton
- 6.2.7. Rest of Canada
- 6.1. Market Analysis, Insights and Forecast - by Type
- 7. Competitive Analysis
- 7.1. Company Profiles
- 7.1.1 6 Cominar REIT
- 7.1.1.1. Company Overview
- 7.1.1.2. Products
- 7.1.1.3. Company Financials
- 7.1.1.4. SWOT Analysis
- 7.1.2 3 Realtor
- 7.1.2.1. Company Overview
- 7.1.2.2. Products
- 7.1.2.3. Company Financials
- 7.1.2.4. SWOT Analysis
- 7.1.3 Developers
- 7.1.3.1. Company Overview
- 7.1.3.2. Products
- 7.1.3.3. Company Financials
- 7.1.3.4. SWOT Analysis
- 7.1.4 2 Harvey Kalles Real Estate
- 7.1.4.1. Company Overview
- 7.1.4.2. Products
- 7.1.4.3. Company Financials
- 7.1.4.4. SWOT Analysis
- 7.1.5 9 Goodman Commercial
- 7.1.5.1. Company Overview
- 7.1.5.2. Products
- 7.1.5.3. Company Financials
- 7.1.5.4. SWOT Analysis
- 7.1.6 3 Amacon
- 7.1.6.1. Company Overview
- 7.1.6.2. Products
- 7.1.6.3. Company Financials
- 7.1.6.4. SWOT Analysis
- 7.1.7 4 Pinnacle International
- 7.1.7.1. Company Overview
- 7.1.7.2. Products
- 7.1.7.3. Company Financials
- 7.1.7.4. SWOT Analysis
- 7.1.8 1 Brookfield Global Integrated Solutions
- 7.1.8.1. Company Overview
- 7.1.8.2. Products
- 7.1.8.3. Company Financials
- 7.1.8.4. SWOT Analysis
- 7.1.9 Real Estate Brokerage Firms
- 7.1.9.1. Company Overview
- 7.1.9.2. Products
- 7.1.9.3. Company Financials
- 7.1.9.4. SWOT Analysis
- 7.1.10 1 Manulife Real Estate
- 7.1.10.1. Company Overview
- 7.1.10.2. Products
- 7.1.10.3. Company Financials
- 7.1.10.4. SWOT Analysis
- 7.1.11 10 Redev Properties*
- 7.1.11.1. Company Overview
- 7.1.11.2. Products
- 7.1.11.3. Company Financials
- 7.1.11.4. SWOT Analysis
- 7.1.12 7 Allied REIT**List Not Exhaustive
- 7.1.12.1. Company Overview
- 7.1.12.2. Products
- 7.1.12.3. Company Financials
- 7.1.12.4. SWOT Analysis
- 7.1.13 2 WestBank Corp
- 7.1.13.1. Company Overview
- 7.1.13.2. Products
- 7.1.13.3. Company Financials
- 7.1.13.4. SWOT Analysis
- 7.1.14 1 Onni Group
- 7.1.14.1. Company Overview
- 7.1.14.2. Products
- 7.1.14.3. Company Financials
- 7.1.14.4. SWOT Analysis
- 7.1.15 6 Knights Bridge Development Corp
- 7.1.15.1. Company Overview
- 7.1.15.2. Products
- 7.1.15.3. Company Financials
- 7.1.15.4. SWOT Analysis
- 7.1.16 5 Dream Office REIT
- 7.1.16.1. Company Overview
- 7.1.16.2. Products
- 7.1.16.3. Company Financials
- 7.1.16.4. SWOT Analysis
- 7.1.17 Other Companies (startups associations etc )
- 7.1.17.1. Company Overview
- 7.1.17.2. Products
- 7.1.17.3. Company Financials
- 7.1.17.4. SWOT Analysis
- 7.1.18 2 Relogix
- 7.1.18.1. Company Overview
- 7.1.18.2. Products
- 7.1.18.3. Company Financials
- 7.1.18.4. SWOT Analysis
- 7.1.19 8 TAG Developments
- 7.1.19.1. Company Overview
- 7.1.19.2. Products
- 7.1.19.3. Company Financials
- 7.1.19.4. SWOT Analysis
- 7.1.20 7 Chard Development
- 7.1.20.1. Company Overview
- 7.1.20.2. Products
- 7.1.20.3. Company Financials
- 7.1.20.4. SWOT Analysis
- 7.1.21 4 Hausway
- 7.1.21.1. Company Overview
- 7.1.21.2. Products
- 7.1.21.3. Company Financials
- 7.1.21.4. SWOT Analysis
- 7.1.22 3 Maxwell Realty*
- 7.1.22.1. Company Overview
- 7.1.22.2. Products
- 7.1.22.3. Company Financials
- 7.1.22.4. SWOT Analysis
- 7.1.23 5 Anthem Properties Group Limited
- 7.1.23.1. Company Overview
- 7.1.23.2. Products
- 7.1.23.3. Company Financials
- 7.1.23.4. SWOT Analysis
- 7.1.1 6 Cominar REIT
- 7.2. Market Entropy
- 7.2.1 Company's Key Areas Served
- 7.2.2 Recent Developments
- 7.3. Company Market Share Analysis 2025
- 7.3.1 Top 5 Companies Market Share Analysis
- 7.3.2 Top 3 Companies Market Share Analysis
- 7.4. List of Potential Customers
- 8. Research Methodology
List of Figures
- Figure 1: Canada Commercial Real Estate Market Revenue Breakdown (Million, %) by Product 2025 & 2033
- Figure 2: Canada Commercial Real Estate Market Share (%) by Company 2025
List of Tables
- Table 1: Canada Commercial Real Estate Market Revenue Million Forecast, by Type 2020 & 2033
- Table 2: Canada Commercial Real Estate Market Revenue Million Forecast, by Key Cities 2020 & 2033
- Table 3: Canada Commercial Real Estate Market Revenue Million Forecast, by Region 2020 & 2033
- Table 4: Canada Commercial Real Estate Market Revenue Million Forecast, by Type 2020 & 2033
- Table 5: Canada Commercial Real Estate Market Revenue Million Forecast, by Key Cities 2020 & 2033
- Table 6: Canada Commercial Real Estate Market Revenue Million Forecast, by Country 2020 & 2033
Frequently Asked Questions
1. What is the projected Compound Annual Growth Rate (CAGR) of the Canada Commercial Real Estate Market?
The projected CAGR is approximately 7.59%.
2. Which companies are prominent players in the Canada Commercial Real Estate Market?
Key companies in the market include 6 Cominar REIT, 3 Realtor, Developers, 2 Harvey Kalles Real Estate, 9 Goodman Commercial, 3 Amacon, 4 Pinnacle International, 1 Brookfield Global Integrated Solutions, Real Estate Brokerage Firms, 1 Manulife Real Estate, 10 Redev Properties*, 7 Allied REIT**List Not Exhaustive, 2 WestBank Corp, 1 Onni Group, 6 Knights Bridge Development Corp, 5 Dream Office REIT, Other Companies (startups associations etc ), 2 Relogix, 8 TAG Developments, 7 Chard Development, 4 Hausway, 3 Maxwell Realty*, 5 Anthem Properties Group Limited.
3. What are the main segments of the Canada Commercial Real Estate Market?
The market segments include Type, Key Cities.
4. Can you provide details about the market size?
The market size is estimated to be USD 77.09 Million as of 2022.
5. What are some drivers contributing to market growth?
Evolution of retail sector driving the market; Office spaces in Toronto and Vancouver are increasing.
6. What are the notable trends driving market growth?
Evolution of retail sector driving the market.
7. Are there any restraints impacting market growth?
High interest rates tend to slowdown business growth; Increasing cost of real estate affecting the growth of the market.
8. Can you provide examples of recent developments in the market?
June 2023: Prologis, Inc. and Blackstone announced a definitive agreement for Prologis to acquire nearly 14 million square feet of industrial properties from opportunistic real estate funds affiliated with Blackstone for USD 3.1 billion, funded by cash. The acquisition price represents an approximately 4% cap rate in the first year and a 5.75% cap rate when adjusting to today's market rents.
9. What pricing options are available for accessing the report?
Pricing options include single-user, multi-user, and enterprise licenses priced at USD 3800, USD 4500, and USD 5800 respectively.
10. Is the market size provided in terms of value or volume?
The market size is provided in terms of value, measured in Million.
11. Are there any specific market keywords associated with the report?
Yes, the market keyword associated with the report is "Canada Commercial Real Estate Market," which aids in identifying and referencing the specific market segment covered.
12. How do I determine which pricing option suits my needs best?
The pricing options vary based on user requirements and access needs. Individual users may opt for single-user licenses, while businesses requiring broader access may choose multi-user or enterprise licenses for cost-effective access to the report.
13. Are there any additional resources or data provided in the Canada Commercial Real Estate Market report?
While the report offers comprehensive insights, it's advisable to review the specific contents or supplementary materials provided to ascertain if additional resources or data are available.
14. How can I stay updated on further developments or reports in the Canada Commercial Real Estate Market?
To stay informed about further developments, trends, and reports in the Canada Commercial Real Estate Market, consider subscribing to industry newsletters, following relevant companies and organizations, or regularly checking reputable industry news sources and publications.
Methodology
Step 1 - Identification of Relevant Samples Size from Population Database


Step 2 - Approaches for Defining Global Market Size (Value, Volume* & Price*)

Note*: In applicable scenarios
Step 3 - Data Sources
Primary Research
- Web Analytics
- Survey Reports
- Research Institute
- Latest Research Reports
- Opinion Leaders
Secondary Research
- Annual Reports
- White Paper
- Latest Press Release
- Industry Association
- Paid Database
- Investor Presentations

Step 4 - Data Triangulation
Involves using different sources of information in order to increase the validity of a study
These sources are likely to be stakeholders in a program - participants, other researchers, program staff, other community members, and so on.
Then we put all data in single framework & apply various statistical tools to find out the dynamic on the market.
During the analysis stage, feedback from the stakeholder groups would be compared to determine areas of agreement as well as areas of divergence