
Key Insights
The U.S. coffee pods and capsules market is a dynamic and rapidly growing sector, experiencing a Compound Annual Growth Rate (CAGR) of 3.76% from 2019 to 2024. This growth is driven by several key factors. The increasing popularity of single-serve brewing systems offers convenience and consistency, appealing to busy consumers. Premiumization within the market, with consumers opting for higher-quality coffee blends and unique flavor profiles within pods, fuels further expansion. Additionally, the rise of sustainability initiatives, including recyclable and compostable pods, is shaping consumer preferences and influencing market dynamics. Major players such as Keurig Dr Pepper, Nestlé, and Starbucks are actively engaged in innovation, product diversification, and strategic partnerships to maintain their market share and cater to evolving consumer needs. The market is segmented by type (e.g., K-Cup, Nespresso), roast type (light, medium, dark), and flavor profiles, indicating a high degree of consumer choice and the potential for niche offerings. Competition among established players and emerging brands fosters innovation and keeps prices competitive, contributing to the overall market growth.
Looking ahead to 2033, the market is projected to maintain robust growth, although the CAGR may fluctuate based on economic conditions and evolving consumer habits. Further expansion is expected due to increasing coffee consumption and the ongoing penetration of single-serve brewing systems in households. However, challenges remain, notably addressing concerns about environmental sustainability through increased recycling programs and the development of eco-friendly packaging options. Maintaining consumer interest amidst changing tastes and preferences will be crucial for continued success within the industry. Furthermore, potential economic downturns could influence consumer spending on premium coffee products, necessitating adaptive pricing strategies and innovative product offerings.
USA Coffee Pods and Capsules Industry: Market Report 2019-2033
This comprehensive report provides a detailed analysis of the dynamic USA coffee pods and capsules industry, covering market size, growth trends, competitive landscape, and future outlook. The study period spans from 2019 to 2033, with 2025 as the base and estimated year. This report is invaluable for industry professionals, investors, and anyone seeking to understand this rapidly evolving market.
Keywords: USA Coffee Pods, Coffee Capsules Market, K-Cup Market, Single-Serve Coffee, Coffee Pod Industry, Nespresso, Keurig, Starbucks, Coffee Market Trends, Coffee Consumption, Coffee Pods Market Size, Coffee Capsule Market Growth, Coffee Industry Analysis.
USA Coffee Pods and Capsules Industry Market Dynamics & Structure
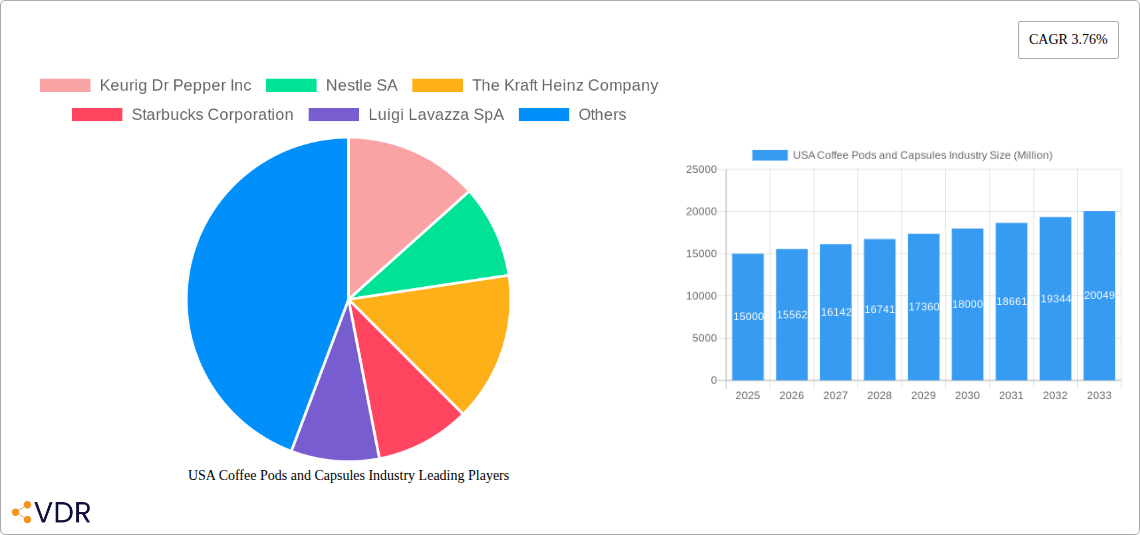
The USA coffee pods and capsules market is a highly competitive landscape dominated by a few major players, exhibiting moderate concentration. Market share data for 2024 indicates Keurig Dr Pepper Inc holds approximately xx%, followed by Nestlé SA at xx%, and Starbucks Corporation at xx%. The remaining market share is distributed among numerous smaller players, including Luigi Lavazza SpA, JAB Holding Company, and others. Technological innovation, particularly in pod and machine design (e.g., improved brewing technology, compostable pods), is a key driver. Regulatory frameworks concerning sustainability and packaging waste exert significant influence. The primary competitive substitutes include traditional brewed coffee, instant coffee, and other single-serve brewing methods. End-user demographics are shifting toward younger consumers and those seeking convenience. M&A activity has been significant, with several notable acquisitions in recent years, totaling approximately xx million units in deal volume during the period 2019-2024. This activity is expected to continue, driven by attempts to expand market share and product offerings.
- Market Concentration: Moderately concentrated, with a few dominant players.
- Technological Innovation: Focus on improved brewing technology and sustainable packaging.
- Regulatory Framework: Growing emphasis on environmental sustainability and waste reduction.
- Competitive Substitutes: Traditional brewed coffee, instant coffee, other single-serve options.
- End-User Demographics: Shifting towards younger, convenience-focused consumers.
- M&A Trends: Significant activity, driven by market share expansion and product diversification.
USA Coffee Pods and Capsules Industry Growth Trends & Insights
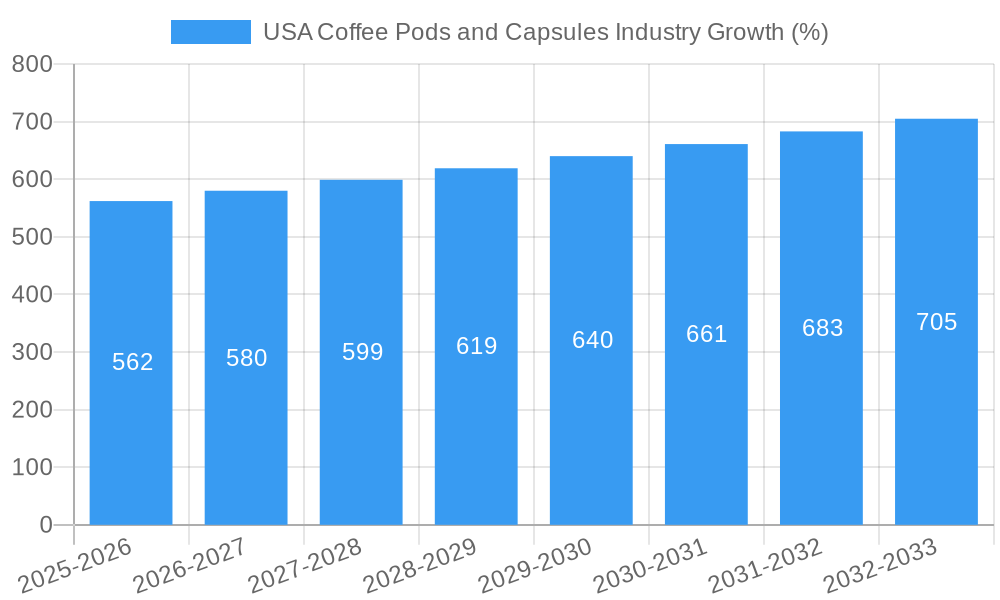
The USA coffee pods and capsules market experienced robust growth during the historical period (2019-2024), driven by increasing coffee consumption, consumer preference for convenience, and the introduction of innovative products. Market size increased from xx million units in 2019 to xx million units in 2024, registering a CAGR of xx%. This growth is anticipated to continue during the forecast period (2025-2033), albeit at a slightly moderated pace, with a projected CAGR of xx%, reaching xx million units by 2033. Market penetration continues to grow, with a significant portion of the coffee-drinking population adopting single-serve brewing systems. Technological disruptions, such as the introduction of reusable pods and improved brewing technology, are shaping consumer behavior. Consumers increasingly seek sustainable and ethically sourced coffee options, influencing the demand for specific brands and pod types.
Dominant Regions, Countries, or Segments in USA Coffee Pods and Capsules Industry
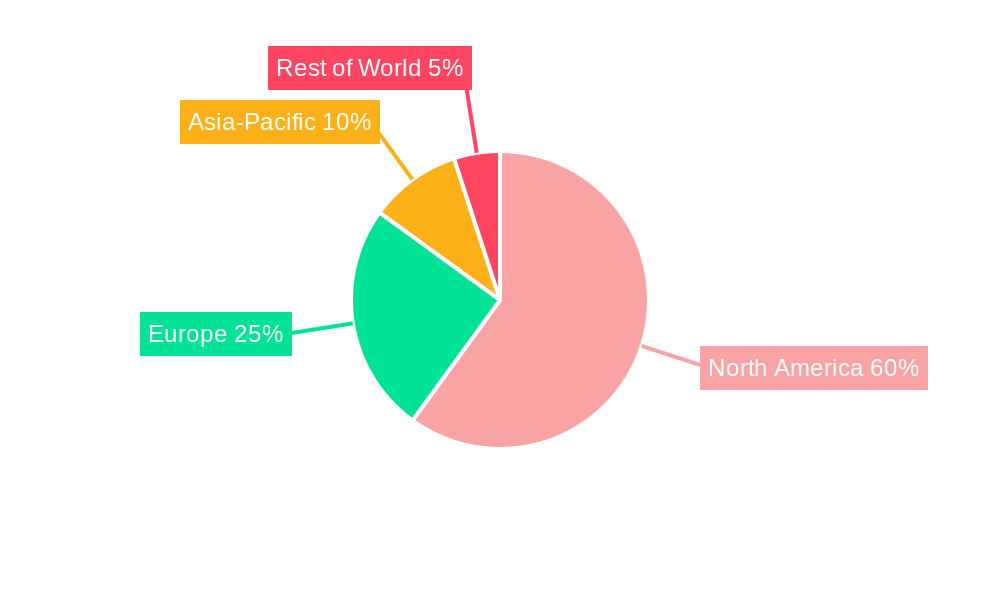
The Northeast and West Coast regions of the USA currently dominate the coffee pods and capsules market, driven by higher disposable incomes, a greater concentration of urban populations, and a strong café culture. California, New York, and other large states in these regions showcase high per capita consumption and a robust distribution network. The key drivers for this dominance include:
- High Disposable Incomes: Affordability of premium coffee products.
- Urban Population Density: Increased convenience of single-serve options.
- Established Distribution Network: Easy access to various brands and pod types.
This dominance is expected to persist, although growth in other regions may accelerate as consumer preferences and purchasing power shift. However, factors like regional economic fluctuations and the growth of online retail could slightly redistribute the market share in the long term. The K-Cup segment presently holds the largest market share due to its wide availability and compatibility with various brewing systems.
USA Coffee Pods and Capsules Industry Product Landscape
The market offers a wide range of coffee pods and capsules, catering to diverse consumer preferences and price points. Products vary in terms of coffee bean origin, roast level, flavor profiles, and packaging materials (including a growing segment of compostable pods). Technological advancements focus on improving brewing consistency, enhancing flavor extraction, and reducing environmental impact. Many companies emphasize unique selling propositions such as fair-trade certifications, organic ingredients, and innovative flavor combinations.
Key Drivers, Barriers & Challenges in USA Coffee Pods and Capsules Industry
Key Drivers:
- Increasing coffee consumption among millennials and Gen Z.
- Growing demand for convenience and speed of preparation.
- Rise of specialty coffee and premium offerings within the pod format.
- Technological advancements in brewing technology and sustainable packaging.
Key Challenges & Restraints:
- Fluctuations in coffee bean prices impacting production costs.
- Environmental concerns related to single-use plastic packaging and waste generation.
- Intense competition from established and emerging players resulting in price wars and margin pressure.
- Supply chain disruptions impacting raw material availability and product distribution. These disruptions impacted the market by approximately xx million units in 2022.
Emerging Opportunities in USA Coffee Pods and Capsules Industry
- Growing demand for organic, fair-trade, and sustainably sourced coffee.
- Increasing popularity of plant-based milk alternatives compatible with pod systems.
- Opportunities for new product innovation including flavored coffees, cold brew options, and functional coffee blends.
- Expansion into untapped regional markets with strong growth potential.
Growth Accelerators in the USA Coffee Pods and Capsules Industry
Strategic partnerships, such as that between Nespresso and Starbucks, and the introduction of innovative products like compostable pods, are key catalysts for sustained growth. Furthermore, increased consumer awareness of sustainability and ethical sourcing fosters further market expansion by focusing on consumer preferences and environmental concerns. Technological advancements continue to enhance brewing quality and convenience, driving increased adoption rates.
Key Players Shaping the USA Coffee Pods and Capsules Industry Market
- Keurig Dr Pepper Inc
- Nestle SA
- The Kraft Heinz Company
- Starbucks Corporation
- Luigi Lavazza SpA
- JAB Holding Company
- Baronet Coffee
- The J M Smucker Company
- DD IP Holder LLC (Dunkin' Brands Group Inc)
- Tim Hortons
- List Not Exhaustive
Notable Milestones in USA Coffee Pods and Capsules Industry Sector
- July 2022: Keurig and Dr. Pepper launch Intelligentsia coffee K-Cups, capitalizing on specialty coffee demand.
- October 2022: Nestlé acquires Seattle's Best Coffee, expanding its K-Cup pod portfolio.
- April 2023: Nespresso and Starbucks launch a limited-edition Reserve Remix Blend capsule, expanding product offerings and brand collaboration.
In-Depth USA Coffee Pods and Capsules Industry Market Outlook
The USA coffee pods and capsules market exhibits strong growth potential driven by ongoing innovation in brewing technology, the rise of sustainable packaging, and the increasing consumer preference for convenience and high-quality coffee. The strategic partnerships and acquisitions mentioned earlier will shape the competitive landscape, and the focus on sustainable practices will drive future innovation. The overall market is poised for sustained growth, with opportunities for both established and emerging players to capitalize on evolving consumer preferences and market trends.
USA Coffee Pods and Capsules Industry Segmentation
-
1. Type
- 1.1. Pods
- 1.2. Capsules
-
2. Distribution Channel
-
2.1. Off-Trade
- 2.1.1. Supermarkets/Hypermarkets
- 2.1.2. Specialty Stores
- 2.1.3. Convenience/Grocery Stores
- 2.1.4. Online Retail Stores
- 2.2. On-Trade
-
2.1. Off-Trade
USA Coffee Pods and Capsules Industry Segmentation By Geography
-
1. North America
- 1.1. United States
- 1.2. Canada
- 1.3. Mexico
-
2. South America
- 2.1. Brazil
- 2.2. Argentina
- 2.3. Rest of South America
-
3. Europe
- 3.1. United Kingdom
- 3.2. Germany
- 3.3. France
- 3.4. Italy
- 3.5. Spain
- 3.6. Russia
- 3.7. Benelux
- 3.8. Nordics
- 3.9. Rest of Europe
-
4. Middle East & Africa
- 4.1. Turkey
- 4.2. Israel
- 4.3. GCC
- 4.4. North Africa
- 4.5. South Africa
- 4.6. Rest of Middle East & Africa
-
5. Asia Pacific
- 5.1. China
- 5.2. India
- 5.3. Japan
- 5.4. South Korea
- 5.5. ASEAN
- 5.6. Oceania
- 5.7. Rest of Asia Pacific
USA Coffee Pods and Capsules Industry REPORT HIGHLIGHTS
| Aspects | Details |
|---|---|
| Study Period | 2019-2033 |
| Base Year | 2024 |
| Estimated Year | 2025 |
| Forecast Period | 2025-2033 |
| Historical Period | 2019-2024 |
| Growth Rate | CAGR of 3.76% from 2019-2033 |
| Segmentation |
|
Table of Contents
- 1. Introduction
- 1.1. Research Scope
- 1.2. Market Segmentation
- 1.3. Research Methodology
- 1.4. Definitions and Assumptions
- 2. Executive Summary
- 2.1. Introduction
- 3. Market Dynamics
- 3.1. Introduction
- 3.2. Market Drivers
- 3.2.1. Increasing Usage of Single-Serve Coffee in Households; Expanding Popularity of Specialty and Organic Coffee Pods and Capsules
- 3.3. Market Restrains
- 3.3.1. Increasing Usage of Single-Serve Coffee in Households; Expanding Popularity of Specialty and Organic Coffee Pods and Capsules
- 3.4. Market Trends
- 3.4.1. Increasing Usage of Single-serve Coffee in Households
- 4. Market Factor Analysis
- 4.1. Porters Five Forces
- 4.2. Supply/Value Chain
- 4.3. PESTEL analysis
- 4.4. Market Entropy
- 4.5. Patent/Trademark Analysis
- 5. Global USA Coffee Pods and Capsules Industry Analysis, Insights and Forecast, 2019-2031
- 5.1. Market Analysis, Insights and Forecast - by Type
- 5.1.1. Pods
- 5.1.2. Capsules
- 5.2. Market Analysis, Insights and Forecast - by Distribution Channel
- 5.2.1. Off-Trade
- 5.2.1.1. Supermarkets/Hypermarkets
- 5.2.1.2. Specialty Stores
- 5.2.1.3. Convenience/Grocery Stores
- 5.2.1.4. Online Retail Stores
- 5.2.2. On-Trade
- 5.2.1. Off-Trade
- 5.3. Market Analysis, Insights and Forecast - by Region
- 5.3.1. North America
- 5.3.2. South America
- 5.3.3. Europe
- 5.3.4. Middle East & Africa
- 5.3.5. Asia Pacific
- 5.1. Market Analysis, Insights and Forecast - by Type
- 6. North America USA Coffee Pods and Capsules Industry Analysis, Insights and Forecast, 2019-2031
- 6.1. Market Analysis, Insights and Forecast - by Type
- 6.1.1. Pods
- 6.1.2. Capsules
- 6.2. Market Analysis, Insights and Forecast - by Distribution Channel
- 6.2.1. Off-Trade
- 6.2.1.1. Supermarkets/Hypermarkets
- 6.2.1.2. Specialty Stores
- 6.2.1.3. Convenience/Grocery Stores
- 6.2.1.4. Online Retail Stores
- 6.2.2. On-Trade
- 6.2.1. Off-Trade
- 6.1. Market Analysis, Insights and Forecast - by Type
- 7. South America USA Coffee Pods and Capsules Industry Analysis, Insights and Forecast, 2019-2031
- 7.1. Market Analysis, Insights and Forecast - by Type
- 7.1.1. Pods
- 7.1.2. Capsules
- 7.2. Market Analysis, Insights and Forecast - by Distribution Channel
- 7.2.1. Off-Trade
- 7.2.1.1. Supermarkets/Hypermarkets
- 7.2.1.2. Specialty Stores
- 7.2.1.3. Convenience/Grocery Stores
- 7.2.1.4. Online Retail Stores
- 7.2.2. On-Trade
- 7.2.1. Off-Trade
- 7.1. Market Analysis, Insights and Forecast - by Type
- 8. Europe USA Coffee Pods and Capsules Industry Analysis, Insights and Forecast, 2019-2031
- 8.1. Market Analysis, Insights and Forecast - by Type
- 8.1.1. Pods
- 8.1.2. Capsules
- 8.2. Market Analysis, Insights and Forecast - by Distribution Channel
- 8.2.1. Off-Trade
- 8.2.1.1. Supermarkets/Hypermarkets
- 8.2.1.2. Specialty Stores
- 8.2.1.3. Convenience/Grocery Stores
- 8.2.1.4. Online Retail Stores
- 8.2.2. On-Trade
- 8.2.1. Off-Trade
- 8.1. Market Analysis, Insights and Forecast - by Type
- 9. Middle East & Africa USA Coffee Pods and Capsules Industry Analysis, Insights and Forecast, 2019-2031
- 9.1. Market Analysis, Insights and Forecast - by Type
- 9.1.1. Pods
- 9.1.2. Capsules
- 9.2. Market Analysis, Insights and Forecast - by Distribution Channel
- 9.2.1. Off-Trade
- 9.2.1.1. Supermarkets/Hypermarkets
- 9.2.1.2. Specialty Stores
- 9.2.1.3. Convenience/Grocery Stores
- 9.2.1.4. Online Retail Stores
- 9.2.2. On-Trade
- 9.2.1. Off-Trade
- 9.1. Market Analysis, Insights and Forecast - by Type
- 10. Asia Pacific USA Coffee Pods and Capsules Industry Analysis, Insights and Forecast, 2019-2031
- 10.1. Market Analysis, Insights and Forecast - by Type
- 10.1.1. Pods
- 10.1.2. Capsules
- 10.2. Market Analysis, Insights and Forecast - by Distribution Channel
- 10.2.1. Off-Trade
- 10.2.1.1. Supermarkets/Hypermarkets
- 10.2.1.2. Specialty Stores
- 10.2.1.3. Convenience/Grocery Stores
- 10.2.1.4. Online Retail Stores
- 10.2.2. On-Trade
- 10.2.1. Off-Trade
- 10.1. Market Analysis, Insights and Forecast - by Type
- 11. Competitive Analysis
- 11.1. Global Market Share Analysis 2024
- 11.2. Company Profiles
- 11.2.1 Keurig Dr Pepper Inc
- 11.2.1.1. Overview
- 11.2.1.2. Products
- 11.2.1.3. SWOT Analysis
- 11.2.1.4. Recent Developments
- 11.2.1.5. Financials (Based on Availability)
- 11.2.2 Nestle SA
- 11.2.2.1. Overview
- 11.2.2.2. Products
- 11.2.2.3. SWOT Analysis
- 11.2.2.4. Recent Developments
- 11.2.2.5. Financials (Based on Availability)
- 11.2.3 The Kraft Heinz Company
- 11.2.3.1. Overview
- 11.2.3.2. Products
- 11.2.3.3. SWOT Analysis
- 11.2.3.4. Recent Developments
- 11.2.3.5. Financials (Based on Availability)
- 11.2.4 Starbucks Corporation
- 11.2.4.1. Overview
- 11.2.4.2. Products
- 11.2.4.3. SWOT Analysis
- 11.2.4.4. Recent Developments
- 11.2.4.5. Financials (Based on Availability)
- 11.2.5 Luigi Lavazza SpA
- 11.2.5.1. Overview
- 11.2.5.2. Products
- 11.2.5.3. SWOT Analysis
- 11.2.5.4. Recent Developments
- 11.2.5.5. Financials (Based on Availability)
- 11.2.6 JAB Holding Company
- 11.2.6.1. Overview
- 11.2.6.2. Products
- 11.2.6.3. SWOT Analysis
- 11.2.6.4. Recent Developments
- 11.2.6.5. Financials (Based on Availability)
- 11.2.7 Baronet Coffee
- 11.2.7.1. Overview
- 11.2.7.2. Products
- 11.2.7.3. SWOT Analysis
- 11.2.7.4. Recent Developments
- 11.2.7.5. Financials (Based on Availability)
- 11.2.8 The J M Smucker Company
- 11.2.8.1. Overview
- 11.2.8.2. Products
- 11.2.8.3. SWOT Analysis
- 11.2.8.4. Recent Developments
- 11.2.8.5. Financials (Based on Availability)
- 11.2.9 DD IP Holder LLC (Dunkin' Brands Group Inc )
- 11.2.9.1. Overview
- 11.2.9.2. Products
- 11.2.9.3. SWOT Analysis
- 11.2.9.4. Recent Developments
- 11.2.9.5. Financials (Based on Availability)
- 11.2.10 Tim Hortons*List Not Exhaustive
- 11.2.10.1. Overview
- 11.2.10.2. Products
- 11.2.10.3. SWOT Analysis
- 11.2.10.4. Recent Developments
- 11.2.10.5. Financials (Based on Availability)
- 11.2.1 Keurig Dr Pepper Inc
List of Figures
- Figure 1: Global USA Coffee Pods and Capsules Industry Revenue Breakdown (Million, %) by Region 2024 & 2032
- Figure 2: North America USA Coffee Pods and Capsules Industry Revenue (Million), by Type 2024 & 2032
- Figure 3: North America USA Coffee Pods and Capsules Industry Revenue Share (%), by Type 2024 & 2032
- Figure 4: North America USA Coffee Pods and Capsules Industry Revenue (Million), by Distribution Channel 2024 & 2032
- Figure 5: North America USA Coffee Pods and Capsules Industry Revenue Share (%), by Distribution Channel 2024 & 2032
- Figure 6: North America USA Coffee Pods and Capsules Industry Revenue (Million), by Country 2024 & 2032
- Figure 7: North America USA Coffee Pods and Capsules Industry Revenue Share (%), by Country 2024 & 2032
- Figure 8: South America USA Coffee Pods and Capsules Industry Revenue (Million), by Type 2024 & 2032
- Figure 9: South America USA Coffee Pods and Capsules Industry Revenue Share (%), by Type 2024 & 2032
- Figure 10: South America USA Coffee Pods and Capsules Industry Revenue (Million), by Distribution Channel 2024 & 2032
- Figure 11: South America USA Coffee Pods and Capsules Industry Revenue Share (%), by Distribution Channel 2024 & 2032
- Figure 12: South America USA Coffee Pods and Capsules Industry Revenue (Million), by Country 2024 & 2032
- Figure 13: South America USA Coffee Pods and Capsules Industry Revenue Share (%), by Country 2024 & 2032
- Figure 14: Europe USA Coffee Pods and Capsules Industry Revenue (Million), by Type 2024 & 2032
- Figure 15: Europe USA Coffee Pods and Capsules Industry Revenue Share (%), by Type 2024 & 2032
- Figure 16: Europe USA Coffee Pods and Capsules Industry Revenue (Million), by Distribution Channel 2024 & 2032
- Figure 17: Europe USA Coffee Pods and Capsules Industry Revenue Share (%), by Distribution Channel 2024 & 2032
- Figure 18: Europe USA Coffee Pods and Capsules Industry Revenue (Million), by Country 2024 & 2032
- Figure 19: Europe USA Coffee Pods and Capsules Industry Revenue Share (%), by Country 2024 & 2032
- Figure 20: Middle East & Africa USA Coffee Pods and Capsules Industry Revenue (Million), by Type 2024 & 2032
- Figure 21: Middle East & Africa USA Coffee Pods and Capsules Industry Revenue Share (%), by Type 2024 & 2032
- Figure 22: Middle East & Africa USA Coffee Pods and Capsules Industry Revenue (Million), by Distribution Channel 2024 & 2032
- Figure 23: Middle East & Africa USA Coffee Pods and Capsules Industry Revenue Share (%), by Distribution Channel 2024 & 2032
- Figure 24: Middle East & Africa USA Coffee Pods and Capsules Industry Revenue (Million), by Country 2024 & 2032
- Figure 25: Middle East & Africa USA Coffee Pods and Capsules Industry Revenue Share (%), by Country 2024 & 2032
- Figure 26: Asia Pacific USA Coffee Pods and Capsules Industry Revenue (Million), by Type 2024 & 2032
- Figure 27: Asia Pacific USA Coffee Pods and Capsules Industry Revenue Share (%), by Type 2024 & 2032
- Figure 28: Asia Pacific USA Coffee Pods and Capsules Industry Revenue (Million), by Distribution Channel 2024 & 2032
- Figure 29: Asia Pacific USA Coffee Pods and Capsules Industry Revenue Share (%), by Distribution Channel 2024 & 2032
- Figure 30: Asia Pacific USA Coffee Pods and Capsules Industry Revenue (Million), by Country 2024 & 2032
- Figure 31: Asia Pacific USA Coffee Pods and Capsules Industry Revenue Share (%), by Country 2024 & 2032
List of Tables
- Table 1: Global USA Coffee Pods and Capsules Industry Revenue Million Forecast, by Region 2019 & 2032
- Table 2: Global USA Coffee Pods and Capsules Industry Revenue Million Forecast, by Type 2019 & 2032
- Table 3: Global USA Coffee Pods and Capsules Industry Revenue Million Forecast, by Distribution Channel 2019 & 2032
- Table 4: Global USA Coffee Pods and Capsules Industry Revenue Million Forecast, by Region 2019 & 2032
- Table 5: Global USA Coffee Pods and Capsules Industry Revenue Million Forecast, by Type 2019 & 2032
- Table 6: Global USA Coffee Pods and Capsules Industry Revenue Million Forecast, by Distribution Channel 2019 & 2032
- Table 7: Global USA Coffee Pods and Capsules Industry Revenue Million Forecast, by Country 2019 & 2032
- Table 8: United States USA Coffee Pods and Capsules Industry Revenue (Million) Forecast, by Application 2019 & 2032
- Table 9: Canada USA Coffee Pods and Capsules Industry Revenue (Million) Forecast, by Application 2019 & 2032
- Table 10: Mexico USA Coffee Pods and Capsules Industry Revenue (Million) Forecast, by Application 2019 & 2032
- Table 11: Global USA Coffee Pods and Capsules Industry Revenue Million Forecast, by Type 2019 & 2032
- Table 12: Global USA Coffee Pods and Capsules Industry Revenue Million Forecast, by Distribution Channel 2019 & 2032
- Table 13: Global USA Coffee Pods and Capsules Industry Revenue Million Forecast, by Country 2019 & 2032
- Table 14: Brazil USA Coffee Pods and Capsules Industry Revenue (Million) Forecast, by Application 2019 & 2032
- Table 15: Argentina USA Coffee Pods and Capsules Industry Revenue (Million) Forecast, by Application 2019 & 2032
- Table 16: Rest of South America USA Coffee Pods and Capsules Industry Revenue (Million) Forecast, by Application 2019 & 2032
- Table 17: Global USA Coffee Pods and Capsules Industry Revenue Million Forecast, by Type 2019 & 2032
- Table 18: Global USA Coffee Pods and Capsules Industry Revenue Million Forecast, by Distribution Channel 2019 & 2032
- Table 19: Global USA Coffee Pods and Capsules Industry Revenue Million Forecast, by Country 2019 & 2032
- Table 20: United Kingdom USA Coffee Pods and Capsules Industry Revenue (Million) Forecast, by Application 2019 & 2032
- Table 21: Germany USA Coffee Pods and Capsules Industry Revenue (Million) Forecast, by Application 2019 & 2032
- Table 22: France USA Coffee Pods and Capsules Industry Revenue (Million) Forecast, by Application 2019 & 2032
- Table 23: Italy USA Coffee Pods and Capsules Industry Revenue (Million) Forecast, by Application 2019 & 2032
- Table 24: Spain USA Coffee Pods and Capsules Industry Revenue (Million) Forecast, by Application 2019 & 2032
- Table 25: Russia USA Coffee Pods and Capsules Industry Revenue (Million) Forecast, by Application 2019 & 2032
- Table 26: Benelux USA Coffee Pods and Capsules Industry Revenue (Million) Forecast, by Application 2019 & 2032
- Table 27: Nordics USA Coffee Pods and Capsules Industry Revenue (Million) Forecast, by Application 2019 & 2032
- Table 28: Rest of Europe USA Coffee Pods and Capsules Industry Revenue (Million) Forecast, by Application 2019 & 2032
- Table 29: Global USA Coffee Pods and Capsules Industry Revenue Million Forecast, by Type 2019 & 2032
- Table 30: Global USA Coffee Pods and Capsules Industry Revenue Million Forecast, by Distribution Channel 2019 & 2032
- Table 31: Global USA Coffee Pods and Capsules Industry Revenue Million Forecast, by Country 2019 & 2032
- Table 32: Turkey USA Coffee Pods and Capsules Industry Revenue (Million) Forecast, by Application 2019 & 2032
- Table 33: Israel USA Coffee Pods and Capsules Industry Revenue (Million) Forecast, by Application 2019 & 2032
- Table 34: GCC USA Coffee Pods and Capsules Industry Revenue (Million) Forecast, by Application 2019 & 2032
- Table 35: North Africa USA Coffee Pods and Capsules Industry Revenue (Million) Forecast, by Application 2019 & 2032
- Table 36: South Africa USA Coffee Pods and Capsules Industry Revenue (Million) Forecast, by Application 2019 & 2032
- Table 37: Rest of Middle East & Africa USA Coffee Pods and Capsules Industry Revenue (Million) Forecast, by Application 2019 & 2032
- Table 38: Global USA Coffee Pods and Capsules Industry Revenue Million Forecast, by Type 2019 & 2032
- Table 39: Global USA Coffee Pods and Capsules Industry Revenue Million Forecast, by Distribution Channel 2019 & 2032
- Table 40: Global USA Coffee Pods and Capsules Industry Revenue Million Forecast, by Country 2019 & 2032
- Table 41: China USA Coffee Pods and Capsules Industry Revenue (Million) Forecast, by Application 2019 & 2032
- Table 42: India USA Coffee Pods and Capsules Industry Revenue (Million) Forecast, by Application 2019 & 2032
- Table 43: Japan USA Coffee Pods and Capsules Industry Revenue (Million) Forecast, by Application 2019 & 2032
- Table 44: South Korea USA Coffee Pods and Capsules Industry Revenue (Million) Forecast, by Application 2019 & 2032
- Table 45: ASEAN USA Coffee Pods and Capsules Industry Revenue (Million) Forecast, by Application 2019 & 2032
- Table 46: Oceania USA Coffee Pods and Capsules Industry Revenue (Million) Forecast, by Application 2019 & 2032
- Table 47: Rest of Asia Pacific USA Coffee Pods and Capsules Industry Revenue (Million) Forecast, by Application 2019 & 2032
Frequently Asked Questions
1. What is the projected Compound Annual Growth Rate (CAGR) of the USA Coffee Pods and Capsules Industry?
The projected CAGR is approximately 3.76%.
2. Which companies are prominent players in the USA Coffee Pods and Capsules Industry?
Key companies in the market include Keurig Dr Pepper Inc, Nestle SA, The Kraft Heinz Company, Starbucks Corporation, Luigi Lavazza SpA, JAB Holding Company, Baronet Coffee, The J M Smucker Company, DD IP Holder LLC (Dunkin' Brands Group Inc ), Tim Hortons*List Not Exhaustive.
3. What are the main segments of the USA Coffee Pods and Capsules Industry?
The market segments include Type, Distribution Channel.
4. Can you provide details about the market size?
The market size is estimated to be USD XX Million as of 2022.
5. What are some drivers contributing to market growth?
Increasing Usage of Single-Serve Coffee in Households; Expanding Popularity of Specialty and Organic Coffee Pods and Capsules.
6. What are the notable trends driving market growth?
Increasing Usage of Single-serve Coffee in Households.
7. Are there any restraints impacting market growth?
Increasing Usage of Single-Serve Coffee in Households; Expanding Popularity of Specialty and Organic Coffee Pods and Capsules.
8. Can you provide examples of recent developments in the market?
April 2023: Nestle's coffee brand Nespresso and Starbucks partnered to launch the 'Nespresso Starbucks Reserve Remix Blend,' a new limited-edition double espresso coffee capsule. The product initially retailed online, as well as at a few Nespresso boutiques and Starbucks Reserve Roasteries, and in select Reserve locations around the United States and the United Kingdom.
9. What pricing options are available for accessing the report?
Pricing options include single-user, multi-user, and enterprise licenses priced at USD 3800, USD 4500, and USD 5800 respectively.
10. Is the market size provided in terms of value or volume?
The market size is provided in terms of value, measured in Million.
11. Are there any specific market keywords associated with the report?
Yes, the market keyword associated with the report is "USA Coffee Pods and Capsules Industry," which aids in identifying and referencing the specific market segment covered.
12. How do I determine which pricing option suits my needs best?
The pricing options vary based on user requirements and access needs. Individual users may opt for single-user licenses, while businesses requiring broader access may choose multi-user or enterprise licenses for cost-effective access to the report.
13. Are there any additional resources or data provided in the USA Coffee Pods and Capsules Industry report?
While the report offers comprehensive insights, it's advisable to review the specific contents or supplementary materials provided to ascertain if additional resources or data are available.
14. How can I stay updated on further developments or reports in the USA Coffee Pods and Capsules Industry?
To stay informed about further developments, trends, and reports in the USA Coffee Pods and Capsules Industry, consider subscribing to industry newsletters, following relevant companies and organizations, or regularly checking reputable industry news sources and publications.
Methodology
Step 1 - Identification of Relevant Samples Size from Population Database


Step 2 - Approaches for Defining Global Market Size (Value, Volume* & Price*)

Note*: In applicable scenarios
Step 3 - Data Sources
Primary Research
- Web Analytics
- Survey Reports
- Research Institute
- Latest Research Reports
- Opinion Leaders
Secondary Research
- Annual Reports
- White Paper
- Latest Press Release
- Industry Association
- Paid Database
- Investor Presentations

Step 4 - Data Triangulation
Involves using different sources of information in order to increase the validity of a study
These sources are likely to be stakeholders in a program - participants, other researchers, program staff, other community members, and so on.
Then we put all data in single framework & apply various statistical tools to find out the dynamic on the market.
During the analysis stage, feedback from the stakeholder groups would be compared to determine areas of agreement as well as areas of divergence


