
Key Insights
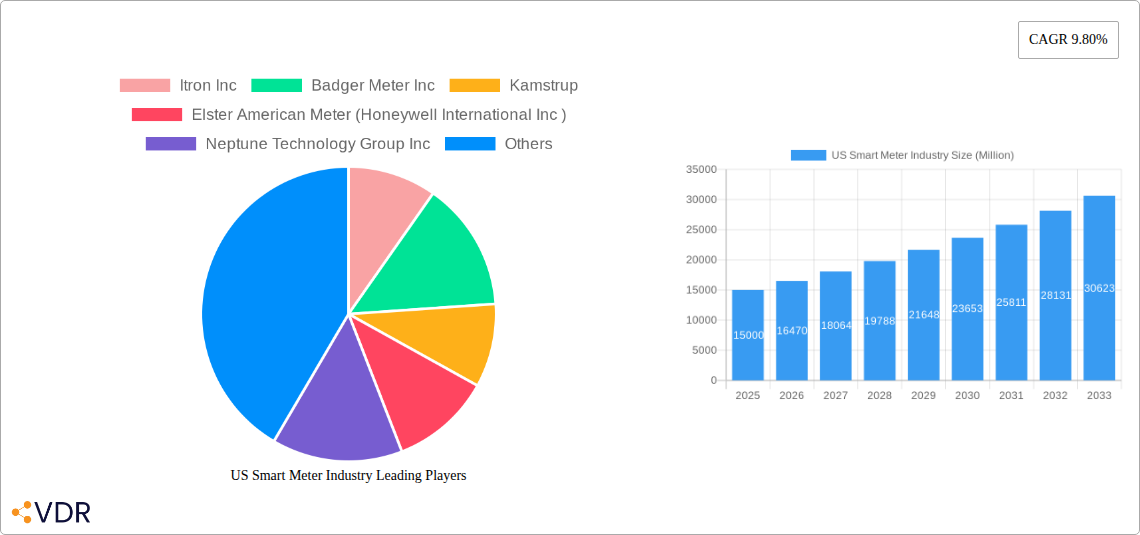
The US smart meter market, encompassing smart gas, water, and electricity meters for residential, commercial, and industrial sectors, is experiencing robust growth. Driven by increasing energy efficiency mandates, the desire for improved grid management, and the rising adoption of smart city initiatives, the market is projected to maintain a significant Compound Annual Growth Rate (CAGR) exceeding 9.8% through 2033. This expansion is further fueled by technological advancements leading to more sophisticated metering capabilities, including real-time data monitoring, remote control functionalities, and improved accuracy. The residential segment currently holds the largest market share, driven by individual consumer demand for better energy consumption tracking and cost savings. However, the commercial and industrial sectors are also showing substantial growth, particularly as businesses prioritize energy optimization and operational efficiency. Key players like Itron, Badger Meter, and Kamstrup are at the forefront of innovation, constantly developing and deploying advanced smart metering technologies to cater to the diverse needs of this expanding market. Competition is fierce, with established companies facing challenges from new entrants offering competitive pricing and innovative solutions.
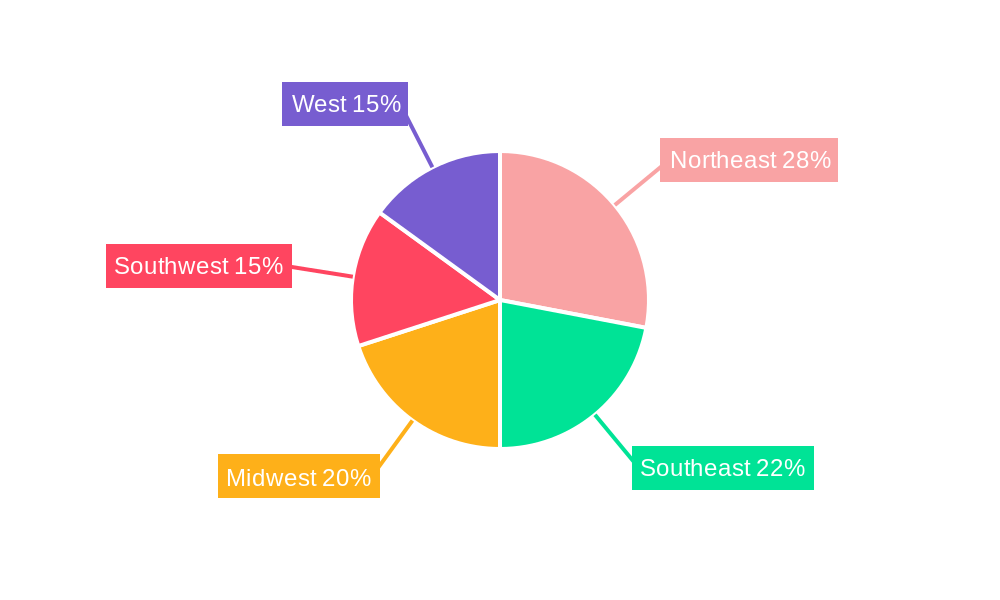
Regional variations exist within the US market. The Northeast and West regions, with their higher population density and advanced infrastructure, are currently leading the adoption of smart meters. However, growth is expected across all regions, as government incentives and investments in grid modernization expand the accessibility and affordability of smart metering technologies throughout the country. The Midwest and South regions, while currently having lower penetration rates, are showing strong growth potential given government initiatives promoting energy sustainability. The continued expansion of smart grid initiatives, coupled with the increasing affordability of smart meters and the development of advanced data analytics platforms that leverage the data they generate, points to a sustained upward trajectory for the US smart meter market in the years to come. This translates to significant opportunities for both established market players and new entrants focusing on innovation and service excellence.
US Smart Meter Industry: Market Analysis & Forecast (2019-2033)
This comprehensive report provides an in-depth analysis of the US smart meter industry, covering market dynamics, growth trends, key players, and future outlook. With a focus on the parent market of utility metering and the child markets of smart gas, water, and electricity meters, this report is an essential resource for industry professionals, investors, and strategic planners. The study period spans from 2019 to 2033, with 2025 as the base and estimated year.
Study Period: 2019–2033 Base Year: 2025 Estimated Year: 2025 Forecast Period: 2025–2033 Historical Period: 2019–2024
US Smart Meter Industry Market Dynamics & Structure
The US smart meter market is experiencing significant growth driven by increasing government mandates for smart grid modernization, rising energy efficiency concerns, and the need for improved water resource management. Market concentration is moderate, with several key players holding substantial shares. Technological innovation is accelerating, particularly in advanced metering infrastructure (AMI) and data analytics capabilities. Regulatory frameworks, including those related to data privacy and security, play a crucial role in shaping market adoption. Competitive substitutes include traditional mechanical meters; however, smart meters are increasingly favored due to their superior capabilities. End-user demographics are shifting, with greater emphasis on residential adoption and increasing demand from the commercial and industrial sectors. M&A activity is robust, with several significant acquisitions enhancing market consolidation and driving technological advancements. For instance, the market saw xx Million USD worth of M&A activity in the past 5 years.
- Market Concentration: Moderately consolidated, with top 5 players holding approximately xx% market share.
- Technological Innovation: Focus on AMI, data analytics, and improved communication protocols (e.g., NB-IoT, LoRaWAN).
- Regulatory Landscape: Stringent data security and privacy regulations impact market adoption and technology choices.
- Competitive Substitutes: Traditional mechanical meters face declining market share due to the advantages of smart meters.
- End-User Demographics: Residential sector is a major driver, followed by commercial and industrial segments.
- M&A Trends: Consolidation through acquisitions is a significant trend, driven by the desire for technological advancement and market share expansion.
US Smart Meter Industry Growth Trends & Insights
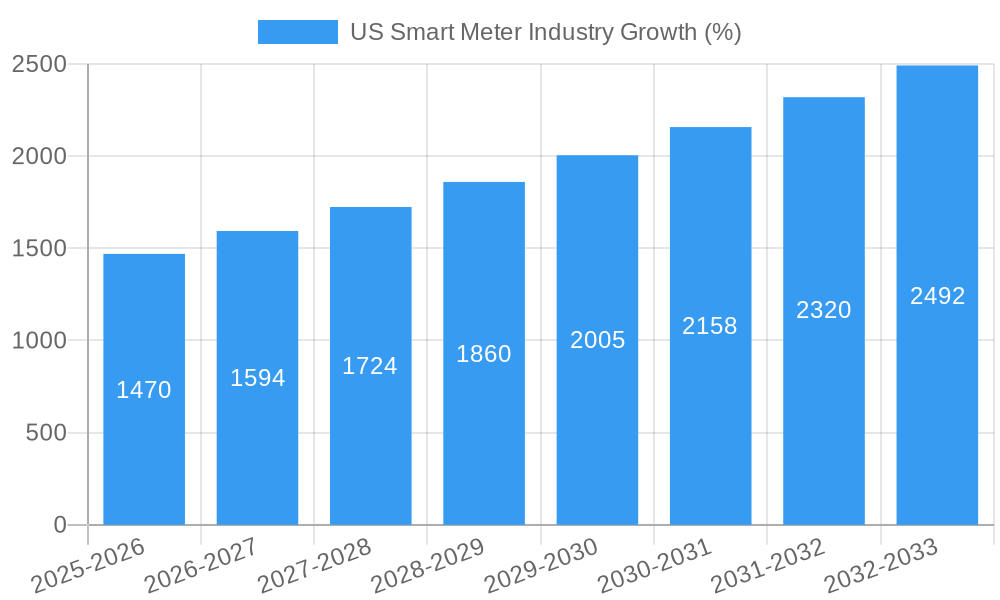
The US smart meter market is exhibiting strong growth, driven by factors such as government regulations promoting smart grid infrastructure, increasing demand for real-time energy consumption data, and the growing adoption of smart home technology. The market size has expanded significantly from xx Million units in 2019 to an estimated xx Million units in 2025, exhibiting a CAGR of xx% during the historical period. This growth is expected to continue with a projected CAGR of xx% from 2025 to 2033, reaching xx Million units by 2033. Market penetration is increasing gradually, particularly in residential settings, as consumers become more aware of the benefits of smart meters and energy management systems. Technological disruptions, such as the adoption of advanced communication technologies and AI-driven analytics, are further accelerating market expansion.
Dominant Regions, Countries, or Segments in US Smart Meter Industry
The US smart meter market demonstrates robust growth across various segments and regions. The residential segment is the largest contributor to overall market value, currently accounting for approximately xx% of the total market in 2025 and is projected to reach xx Million units by 2033. Smart water meters are experiencing significant growth due to the increasing focus on water conservation and efficient water resource management. The western and south-western regions of the US are experiencing faster growth rates due to factors like water scarcity and favorable government initiatives.
- Leading Segment: Residential (Smart Water Meters showing fastest growth).
- Fastest-Growing Region: Western and Southwestern US.
- Key Growth Drivers: Government initiatives promoting water conservation and smart grid modernization, increasing consumer awareness of energy efficiency and cost savings.
US Smart Meter Industry Product Landscape
The smart meter landscape is characterized by a wide range of products with varying functionalities, communication protocols, and data analytics capabilities. Key product innovations include advanced AMI systems with enhanced data security, integration with smart home ecosystems, and the incorporation of AI-driven predictive analytics. These advancements allow for more precise energy consumption monitoring, improved grid management, and reduced operational costs. Manufacturers are focusing on improving meter durability, extending battery life, and developing user-friendly interfaces to enhance consumer adoption.
Key Drivers, Barriers & Challenges in US Smart Meter Industry
Key Drivers:
- Government regulations promoting smart grid initiatives and renewable energy integration.
- Increasing consumer demand for energy efficiency and cost-saving solutions.
- Technological advancements, such as the integration of IoT and AI.
Challenges:
- High initial investment costs for infrastructure upgrades.
- Concerns regarding data security and privacy.
- Potential for supply chain disruptions due to component shortages.
- Resistance to change from some consumers and utility companies.
Emerging Opportunities in US Smart Meter Industry
- Expansion into underserved rural areas.
- Development of advanced data analytics and predictive maintenance capabilities.
- Integration of smart meters with renewable energy systems and smart home platforms.
- Growing demand for advanced metering infrastructure (AMI) upgrades.
Growth Accelerators in the US Smart Meter Industry Industry
Continued government support for smart grid modernization, rising energy prices stimulating demand for energy management solutions, and increased adoption of smart home technologies are key growth catalysts. Technological innovation, particularly in areas such as advanced communication protocols and AI-driven analytics, will significantly accelerate market growth. Strategic partnerships between meter manufacturers, utility companies, and technology providers will play a crucial role in market expansion and improved service offerings.
Key Players Shaping the US Smart Meter Industry Market
- Itron Inc
- Badger Meter Inc
- Kamstrup
- Elster American Meter (Honeywell International Inc)
- Neptune Technology Group Inc
- Sensus USA Inc (Xylem Inc)
- General Electric Co
- Diehl Metering US
- Mueller Systems LLC
Notable Milestones in US Smart Meter Industry Sector
- January 2021: Badger Meter, Inc. acquired Analytical Technology, Inc. (ATi) for USD 44 million, expanding its water quality monitoring capabilities.
- March 2022: Mueller Systems deployed a pilot program for a new water meter system with mobile phone control features in Santa Rosa County, Florida.
In-Depth US Smart Meter Industry Market Outlook
The US smart meter market is poised for sustained growth driven by continued infrastructure upgrades, increasing adoption of smart home technologies, and ongoing government support. Strategic opportunities exist for companies focusing on advanced data analytics, improved security features, and seamless integration with renewable energy sources. The expanding scope of smart meter applications across various sectors presents significant market potential for both established players and emerging innovators. The increasing focus on water conservation and resource management will further accelerate the demand for smart water meters, presenting a significant opportunity for market participants.
US Smart Meter Industry Segmentation
-
1. Type
- 1.1. Smart Gas Meters
- 1.2. Smart Water Meters
- 1.3. Smart Electricity Meters
-
2. End-User
- 2.1. Commercial
- 2.2. Industrial
- 2.3. Residential
US Smart Meter Industry Segmentation By Geography
-
1. North America
- 1.1. United States
- 1.2. Canada
- 1.3. Mexico
-
2. South America
- 2.1. Brazil
- 2.2. Argentina
- 2.3. Rest of South America
-
3. Europe
- 3.1. United Kingdom
- 3.2. Germany
- 3.3. France
- 3.4. Italy
- 3.5. Spain
- 3.6. Russia
- 3.7. Benelux
- 3.8. Nordics
- 3.9. Rest of Europe
-
4. Middle East & Africa
- 4.1. Turkey
- 4.2. Israel
- 4.3. GCC
- 4.4. North Africa
- 4.5. South Africa
- 4.6. Rest of Middle East & Africa
-
5. Asia Pacific
- 5.1. China
- 5.2. India
- 5.3. Japan
- 5.4. South Korea
- 5.5. ASEAN
- 5.6. Oceania
- 5.7. Rest of Asia Pacific
US Smart Meter Industry REPORT HIGHLIGHTS
| Aspects | Details |
|---|---|
| Study Period | 2019-2033 |
| Base Year | 2024 |
| Estimated Year | 2025 |
| Forecast Period | 2025-2033 |
| Historical Period | 2019-2024 |
| Growth Rate | CAGR of 9.80% from 2019-2033 |
| Segmentation |
|
Table of Contents
- 1. Introduction
- 1.1. Research Scope
- 1.2. Market Segmentation
- 1.3. Research Methodology
- 1.4. Definitions and Assumptions
- 2. Executive Summary
- 2.1. Introduction
- 3. Market Dynamics
- 3.1. Introduction
- 3.2. Market Drivers
- 3.2.1. Higher Consumer Awareness and Government Regulations Mandating the Installation of Smart Meters; Increased Investments in Smart Grid Projects; Investments in Smart City Developments
- 3.3. Market Restrains
- 3.3.1. High Installation Cost and Longer ROI Period; Longer Replacement Cycle of Water Meters
- 3.4. Market Trends
- 3.4.1. Smart Gas Meter Segment to Grow Significantly
- 4. Market Factor Analysis
- 4.1. Porters Five Forces
- 4.2. Supply/Value Chain
- 4.3. PESTEL analysis
- 4.4. Market Entropy
- 4.5. Patent/Trademark Analysis
- 5. Global US Smart Meter Industry Analysis, Insights and Forecast, 2019-2031
- 5.1. Market Analysis, Insights and Forecast - by Type
- 5.1.1. Smart Gas Meters
- 5.1.2. Smart Water Meters
- 5.1.3. Smart Electricity Meters
- 5.2. Market Analysis, Insights and Forecast - by End-User
- 5.2.1. Commercial
- 5.2.2. Industrial
- 5.2.3. Residential
- 5.3. Market Analysis, Insights and Forecast - by Region
- 5.3.1. North America
- 5.3.2. South America
- 5.3.3. Europe
- 5.3.4. Middle East & Africa
- 5.3.5. Asia Pacific
- 5.1. Market Analysis, Insights and Forecast - by Type
- 6. North America US Smart Meter Industry Analysis, Insights and Forecast, 2019-2031
- 6.1. Market Analysis, Insights and Forecast - by Type
- 6.1.1. Smart Gas Meters
- 6.1.2. Smart Water Meters
- 6.1.3. Smart Electricity Meters
- 6.2. Market Analysis, Insights and Forecast - by End-User
- 6.2.1. Commercial
- 6.2.2. Industrial
- 6.2.3. Residential
- 6.1. Market Analysis, Insights and Forecast - by Type
- 7. South America US Smart Meter Industry Analysis, Insights and Forecast, 2019-2031
- 7.1. Market Analysis, Insights and Forecast - by Type
- 7.1.1. Smart Gas Meters
- 7.1.2. Smart Water Meters
- 7.1.3. Smart Electricity Meters
- 7.2. Market Analysis, Insights and Forecast - by End-User
- 7.2.1. Commercial
- 7.2.2. Industrial
- 7.2.3. Residential
- 7.1. Market Analysis, Insights and Forecast - by Type
- 8. Europe US Smart Meter Industry Analysis, Insights and Forecast, 2019-2031
- 8.1. Market Analysis, Insights and Forecast - by Type
- 8.1.1. Smart Gas Meters
- 8.1.2. Smart Water Meters
- 8.1.3. Smart Electricity Meters
- 8.2. Market Analysis, Insights and Forecast - by End-User
- 8.2.1. Commercial
- 8.2.2. Industrial
- 8.2.3. Residential
- 8.1. Market Analysis, Insights and Forecast - by Type
- 9. Middle East & Africa US Smart Meter Industry Analysis, Insights and Forecast, 2019-2031
- 9.1. Market Analysis, Insights and Forecast - by Type
- 9.1.1. Smart Gas Meters
- 9.1.2. Smart Water Meters
- 9.1.3. Smart Electricity Meters
- 9.2. Market Analysis, Insights and Forecast - by End-User
- 9.2.1. Commercial
- 9.2.2. Industrial
- 9.2.3. Residential
- 9.1. Market Analysis, Insights and Forecast - by Type
- 10. Asia Pacific US Smart Meter Industry Analysis, Insights and Forecast, 2019-2031
- 10.1. Market Analysis, Insights and Forecast - by Type
- 10.1.1. Smart Gas Meters
- 10.1.2. Smart Water Meters
- 10.1.3. Smart Electricity Meters
- 10.2. Market Analysis, Insights and Forecast - by End-User
- 10.2.1. Commercial
- 10.2.2. Industrial
- 10.2.3. Residential
- 10.1. Market Analysis, Insights and Forecast - by Type
- 11. Northeast US Smart Meter Industry Analysis, Insights and Forecast, 2019-2031
- 12. Southeast US Smart Meter Industry Analysis, Insights and Forecast, 2019-2031
- 13. Midwest US Smart Meter Industry Analysis, Insights and Forecast, 2019-2031
- 14. Southwest US Smart Meter Industry Analysis, Insights and Forecast, 2019-2031
- 15. West US Smart Meter Industry Analysis, Insights and Forecast, 2019-2031
- 16. Competitive Analysis
- 16.1. Global Market Share Analysis 2024
- 16.2. Company Profiles
- 16.2.1 Itron Inc
- 16.2.1.1. Overview
- 16.2.1.2. Products
- 16.2.1.3. SWOT Analysis
- 16.2.1.4. Recent Developments
- 16.2.1.5. Financials (Based on Availability)
- 16.2.2 Badger Meter Inc
- 16.2.2.1. Overview
- 16.2.2.2. Products
- 16.2.2.3. SWOT Analysis
- 16.2.2.4. Recent Developments
- 16.2.2.5. Financials (Based on Availability)
- 16.2.3 Kamstrup
- 16.2.3.1. Overview
- 16.2.3.2. Products
- 16.2.3.3. SWOT Analysis
- 16.2.3.4. Recent Developments
- 16.2.3.5. Financials (Based on Availability)
- 16.2.4 Elster American Meter (Honeywell International Inc )
- 16.2.4.1. Overview
- 16.2.4.2. Products
- 16.2.4.3. SWOT Analysis
- 16.2.4.4. Recent Developments
- 16.2.4.5. Financials (Based on Availability)
- 16.2.5 Neptune Technology Group Inc
- 16.2.5.1. Overview
- 16.2.5.2. Products
- 16.2.5.3. SWOT Analysis
- 16.2.5.4. Recent Developments
- 16.2.5.5. Financials (Based on Availability)
- 16.2.6 Sensus USA Inc (Xylem Inc )
- 16.2.6.1. Overview
- 16.2.6.2. Products
- 16.2.6.3. SWOT Analysis
- 16.2.6.4. Recent Developments
- 16.2.6.5. Financials (Based on Availability)
- 16.2.7 General Electric Co
- 16.2.7.1. Overview
- 16.2.7.2. Products
- 16.2.7.3. SWOT Analysis
- 16.2.7.4. Recent Developments
- 16.2.7.5. Financials (Based on Availability)
- 16.2.8 Diehl Metering US
- 16.2.8.1. Overview
- 16.2.8.2. Products
- 16.2.8.3. SWOT Analysis
- 16.2.8.4. Recent Developments
- 16.2.8.5. Financials (Based on Availability)
- 16.2.9 Mueller Systems LLC
- 16.2.9.1. Overview
- 16.2.9.2. Products
- 16.2.9.3. SWOT Analysis
- 16.2.9.4. Recent Developments
- 16.2.9.5. Financials (Based on Availability)
- 16.2.1 Itron Inc
List of Figures
- Figure 1: Global US Smart Meter Industry Revenue Breakdown (Million, %) by Region 2024 & 2032
- Figure 2: Global US Smart Meter Industry Volume Breakdown (K Unit, %) by Region 2024 & 2032
- Figure 3: United states US Smart Meter Industry Revenue (Million), by Country 2024 & 2032
- Figure 4: United states US Smart Meter Industry Volume (K Unit), by Country 2024 & 2032
- Figure 5: United states US Smart Meter Industry Revenue Share (%), by Country 2024 & 2032
- Figure 6: United states US Smart Meter Industry Volume Share (%), by Country 2024 & 2032
- Figure 7: North America US Smart Meter Industry Revenue (Million), by Type 2024 & 2032
- Figure 8: North America US Smart Meter Industry Volume (K Unit), by Type 2024 & 2032
- Figure 9: North America US Smart Meter Industry Revenue Share (%), by Type 2024 & 2032
- Figure 10: North America US Smart Meter Industry Volume Share (%), by Type 2024 & 2032
- Figure 11: North America US Smart Meter Industry Revenue (Million), by End-User 2024 & 2032
- Figure 12: North America US Smart Meter Industry Volume (K Unit), by End-User 2024 & 2032
- Figure 13: North America US Smart Meter Industry Revenue Share (%), by End-User 2024 & 2032
- Figure 14: North America US Smart Meter Industry Volume Share (%), by End-User 2024 & 2032
- Figure 15: North America US Smart Meter Industry Revenue (Million), by Country 2024 & 2032
- Figure 16: North America US Smart Meter Industry Volume (K Unit), by Country 2024 & 2032
- Figure 17: North America US Smart Meter Industry Revenue Share (%), by Country 2024 & 2032
- Figure 18: North America US Smart Meter Industry Volume Share (%), by Country 2024 & 2032
- Figure 19: South America US Smart Meter Industry Revenue (Million), by Type 2024 & 2032
- Figure 20: South America US Smart Meter Industry Volume (K Unit), by Type 2024 & 2032
- Figure 21: South America US Smart Meter Industry Revenue Share (%), by Type 2024 & 2032
- Figure 22: South America US Smart Meter Industry Volume Share (%), by Type 2024 & 2032
- Figure 23: South America US Smart Meter Industry Revenue (Million), by End-User 2024 & 2032
- Figure 24: South America US Smart Meter Industry Volume (K Unit), by End-User 2024 & 2032
- Figure 25: South America US Smart Meter Industry Revenue Share (%), by End-User 2024 & 2032
- Figure 26: South America US Smart Meter Industry Volume Share (%), by End-User 2024 & 2032
- Figure 27: South America US Smart Meter Industry Revenue (Million), by Country 2024 & 2032
- Figure 28: South America US Smart Meter Industry Volume (K Unit), by Country 2024 & 2032
- Figure 29: South America US Smart Meter Industry Revenue Share (%), by Country 2024 & 2032
- Figure 30: South America US Smart Meter Industry Volume Share (%), by Country 2024 & 2032
- Figure 31: Europe US Smart Meter Industry Revenue (Million), by Type 2024 & 2032
- Figure 32: Europe US Smart Meter Industry Volume (K Unit), by Type 2024 & 2032
- Figure 33: Europe US Smart Meter Industry Revenue Share (%), by Type 2024 & 2032
- Figure 34: Europe US Smart Meter Industry Volume Share (%), by Type 2024 & 2032
- Figure 35: Europe US Smart Meter Industry Revenue (Million), by End-User 2024 & 2032
- Figure 36: Europe US Smart Meter Industry Volume (K Unit), by End-User 2024 & 2032
- Figure 37: Europe US Smart Meter Industry Revenue Share (%), by End-User 2024 & 2032
- Figure 38: Europe US Smart Meter Industry Volume Share (%), by End-User 2024 & 2032
- Figure 39: Europe US Smart Meter Industry Revenue (Million), by Country 2024 & 2032
- Figure 40: Europe US Smart Meter Industry Volume (K Unit), by Country 2024 & 2032
- Figure 41: Europe US Smart Meter Industry Revenue Share (%), by Country 2024 & 2032
- Figure 42: Europe US Smart Meter Industry Volume Share (%), by Country 2024 & 2032
- Figure 43: Middle East & Africa US Smart Meter Industry Revenue (Million), by Type 2024 & 2032
- Figure 44: Middle East & Africa US Smart Meter Industry Volume (K Unit), by Type 2024 & 2032
- Figure 45: Middle East & Africa US Smart Meter Industry Revenue Share (%), by Type 2024 & 2032
- Figure 46: Middle East & Africa US Smart Meter Industry Volume Share (%), by Type 2024 & 2032
- Figure 47: Middle East & Africa US Smart Meter Industry Revenue (Million), by End-User 2024 & 2032
- Figure 48: Middle East & Africa US Smart Meter Industry Volume (K Unit), by End-User 2024 & 2032
- Figure 49: Middle East & Africa US Smart Meter Industry Revenue Share (%), by End-User 2024 & 2032
- Figure 50: Middle East & Africa US Smart Meter Industry Volume Share (%), by End-User 2024 & 2032
- Figure 51: Middle East & Africa US Smart Meter Industry Revenue (Million), by Country 2024 & 2032
- Figure 52: Middle East & Africa US Smart Meter Industry Volume (K Unit), by Country 2024 & 2032
- Figure 53: Middle East & Africa US Smart Meter Industry Revenue Share (%), by Country 2024 & 2032
- Figure 54: Middle East & Africa US Smart Meter Industry Volume Share (%), by Country 2024 & 2032
- Figure 55: Asia Pacific US Smart Meter Industry Revenue (Million), by Type 2024 & 2032
- Figure 56: Asia Pacific US Smart Meter Industry Volume (K Unit), by Type 2024 & 2032
- Figure 57: Asia Pacific US Smart Meter Industry Revenue Share (%), by Type 2024 & 2032
- Figure 58: Asia Pacific US Smart Meter Industry Volume Share (%), by Type 2024 & 2032
- Figure 59: Asia Pacific US Smart Meter Industry Revenue (Million), by End-User 2024 & 2032
- Figure 60: Asia Pacific US Smart Meter Industry Volume (K Unit), by End-User 2024 & 2032
- Figure 61: Asia Pacific US Smart Meter Industry Revenue Share (%), by End-User 2024 & 2032
- Figure 62: Asia Pacific US Smart Meter Industry Volume Share (%), by End-User 2024 & 2032
- Figure 63: Asia Pacific US Smart Meter Industry Revenue (Million), by Country 2024 & 2032
- Figure 64: Asia Pacific US Smart Meter Industry Volume (K Unit), by Country 2024 & 2032
- Figure 65: Asia Pacific US Smart Meter Industry Revenue Share (%), by Country 2024 & 2032
- Figure 66: Asia Pacific US Smart Meter Industry Volume Share (%), by Country 2024 & 2032
List of Tables
- Table 1: Global US Smart Meter Industry Revenue Million Forecast, by Region 2019 & 2032
- Table 2: Global US Smart Meter Industry Volume K Unit Forecast, by Region 2019 & 2032
- Table 3: Global US Smart Meter Industry Revenue Million Forecast, by Type 2019 & 2032
- Table 4: Global US Smart Meter Industry Volume K Unit Forecast, by Type 2019 & 2032
- Table 5: Global US Smart Meter Industry Revenue Million Forecast, by End-User 2019 & 2032
- Table 6: Global US Smart Meter Industry Volume K Unit Forecast, by End-User 2019 & 2032
- Table 7: Global US Smart Meter Industry Revenue Million Forecast, by Region 2019 & 2032
- Table 8: Global US Smart Meter Industry Volume K Unit Forecast, by Region 2019 & 2032
- Table 9: Global US Smart Meter Industry Revenue Million Forecast, by Country 2019 & 2032
- Table 10: Global US Smart Meter Industry Volume K Unit Forecast, by Country 2019 & 2032
- Table 11: Northeast US Smart Meter Industry Revenue (Million) Forecast, by Application 2019 & 2032
- Table 12: Northeast US Smart Meter Industry Volume (K Unit) Forecast, by Application 2019 & 2032
- Table 13: Southeast US Smart Meter Industry Revenue (Million) Forecast, by Application 2019 & 2032
- Table 14: Southeast US Smart Meter Industry Volume (K Unit) Forecast, by Application 2019 & 2032
- Table 15: Midwest US Smart Meter Industry Revenue (Million) Forecast, by Application 2019 & 2032
- Table 16: Midwest US Smart Meter Industry Volume (K Unit) Forecast, by Application 2019 & 2032
- Table 17: Southwest US Smart Meter Industry Revenue (Million) Forecast, by Application 2019 & 2032
- Table 18: Southwest US Smart Meter Industry Volume (K Unit) Forecast, by Application 2019 & 2032
- Table 19: West US Smart Meter Industry Revenue (Million) Forecast, by Application 2019 & 2032
- Table 20: West US Smart Meter Industry Volume (K Unit) Forecast, by Application 2019 & 2032
- Table 21: Global US Smart Meter Industry Revenue Million Forecast, by Type 2019 & 2032
- Table 22: Global US Smart Meter Industry Volume K Unit Forecast, by Type 2019 & 2032
- Table 23: Global US Smart Meter Industry Revenue Million Forecast, by End-User 2019 & 2032
- Table 24: Global US Smart Meter Industry Volume K Unit Forecast, by End-User 2019 & 2032
- Table 25: Global US Smart Meter Industry Revenue Million Forecast, by Country 2019 & 2032
- Table 26: Global US Smart Meter Industry Volume K Unit Forecast, by Country 2019 & 2032
- Table 27: United States US Smart Meter Industry Revenue (Million) Forecast, by Application 2019 & 2032
- Table 28: United States US Smart Meter Industry Volume (K Unit) Forecast, by Application 2019 & 2032
- Table 29: Canada US Smart Meter Industry Revenue (Million) Forecast, by Application 2019 & 2032
- Table 30: Canada US Smart Meter Industry Volume (K Unit) Forecast, by Application 2019 & 2032
- Table 31: Mexico US Smart Meter Industry Revenue (Million) Forecast, by Application 2019 & 2032
- Table 32: Mexico US Smart Meter Industry Volume (K Unit) Forecast, by Application 2019 & 2032
- Table 33: Global US Smart Meter Industry Revenue Million Forecast, by Type 2019 & 2032
- Table 34: Global US Smart Meter Industry Volume K Unit Forecast, by Type 2019 & 2032
- Table 35: Global US Smart Meter Industry Revenue Million Forecast, by End-User 2019 & 2032
- Table 36: Global US Smart Meter Industry Volume K Unit Forecast, by End-User 2019 & 2032
- Table 37: Global US Smart Meter Industry Revenue Million Forecast, by Country 2019 & 2032
- Table 38: Global US Smart Meter Industry Volume K Unit Forecast, by Country 2019 & 2032
- Table 39: Brazil US Smart Meter Industry Revenue (Million) Forecast, by Application 2019 & 2032
- Table 40: Brazil US Smart Meter Industry Volume (K Unit) Forecast, by Application 2019 & 2032
- Table 41: Argentina US Smart Meter Industry Revenue (Million) Forecast, by Application 2019 & 2032
- Table 42: Argentina US Smart Meter Industry Volume (K Unit) Forecast, by Application 2019 & 2032
- Table 43: Rest of South America US Smart Meter Industry Revenue (Million) Forecast, by Application 2019 & 2032
- Table 44: Rest of South America US Smart Meter Industry Volume (K Unit) Forecast, by Application 2019 & 2032
- Table 45: Global US Smart Meter Industry Revenue Million Forecast, by Type 2019 & 2032
- Table 46: Global US Smart Meter Industry Volume K Unit Forecast, by Type 2019 & 2032
- Table 47: Global US Smart Meter Industry Revenue Million Forecast, by End-User 2019 & 2032
- Table 48: Global US Smart Meter Industry Volume K Unit Forecast, by End-User 2019 & 2032
- Table 49: Global US Smart Meter Industry Revenue Million Forecast, by Country 2019 & 2032
- Table 50: Global US Smart Meter Industry Volume K Unit Forecast, by Country 2019 & 2032
- Table 51: United Kingdom US Smart Meter Industry Revenue (Million) Forecast, by Application 2019 & 2032
- Table 52: United Kingdom US Smart Meter Industry Volume (K Unit) Forecast, by Application 2019 & 2032
- Table 53: Germany US Smart Meter Industry Revenue (Million) Forecast, by Application 2019 & 2032
- Table 54: Germany US Smart Meter Industry Volume (K Unit) Forecast, by Application 2019 & 2032
- Table 55: France US Smart Meter Industry Revenue (Million) Forecast, by Application 2019 & 2032
- Table 56: France US Smart Meter Industry Volume (K Unit) Forecast, by Application 2019 & 2032
- Table 57: Italy US Smart Meter Industry Revenue (Million) Forecast, by Application 2019 & 2032
- Table 58: Italy US Smart Meter Industry Volume (K Unit) Forecast, by Application 2019 & 2032
- Table 59: Spain US Smart Meter Industry Revenue (Million) Forecast, by Application 2019 & 2032
- Table 60: Spain US Smart Meter Industry Volume (K Unit) Forecast, by Application 2019 & 2032
- Table 61: Russia US Smart Meter Industry Revenue (Million) Forecast, by Application 2019 & 2032
- Table 62: Russia US Smart Meter Industry Volume (K Unit) Forecast, by Application 2019 & 2032
- Table 63: Benelux US Smart Meter Industry Revenue (Million) Forecast, by Application 2019 & 2032
- Table 64: Benelux US Smart Meter Industry Volume (K Unit) Forecast, by Application 2019 & 2032
- Table 65: Nordics US Smart Meter Industry Revenue (Million) Forecast, by Application 2019 & 2032
- Table 66: Nordics US Smart Meter Industry Volume (K Unit) Forecast, by Application 2019 & 2032
- Table 67: Rest of Europe US Smart Meter Industry Revenue (Million) Forecast, by Application 2019 & 2032
- Table 68: Rest of Europe US Smart Meter Industry Volume (K Unit) Forecast, by Application 2019 & 2032
- Table 69: Global US Smart Meter Industry Revenue Million Forecast, by Type 2019 & 2032
- Table 70: Global US Smart Meter Industry Volume K Unit Forecast, by Type 2019 & 2032
- Table 71: Global US Smart Meter Industry Revenue Million Forecast, by End-User 2019 & 2032
- Table 72: Global US Smart Meter Industry Volume K Unit Forecast, by End-User 2019 & 2032
- Table 73: Global US Smart Meter Industry Revenue Million Forecast, by Country 2019 & 2032
- Table 74: Global US Smart Meter Industry Volume K Unit Forecast, by Country 2019 & 2032
- Table 75: Turkey US Smart Meter Industry Revenue (Million) Forecast, by Application 2019 & 2032
- Table 76: Turkey US Smart Meter Industry Volume (K Unit) Forecast, by Application 2019 & 2032
- Table 77: Israel US Smart Meter Industry Revenue (Million) Forecast, by Application 2019 & 2032
- Table 78: Israel US Smart Meter Industry Volume (K Unit) Forecast, by Application 2019 & 2032
- Table 79: GCC US Smart Meter Industry Revenue (Million) Forecast, by Application 2019 & 2032
- Table 80: GCC US Smart Meter Industry Volume (K Unit) Forecast, by Application 2019 & 2032
- Table 81: North Africa US Smart Meter Industry Revenue (Million) Forecast, by Application 2019 & 2032
- Table 82: North Africa US Smart Meter Industry Volume (K Unit) Forecast, by Application 2019 & 2032
- Table 83: South Africa US Smart Meter Industry Revenue (Million) Forecast, by Application 2019 & 2032
- Table 84: South Africa US Smart Meter Industry Volume (K Unit) Forecast, by Application 2019 & 2032
- Table 85: Rest of Middle East & Africa US Smart Meter Industry Revenue (Million) Forecast, by Application 2019 & 2032
- Table 86: Rest of Middle East & Africa US Smart Meter Industry Volume (K Unit) Forecast, by Application 2019 & 2032
- Table 87: Global US Smart Meter Industry Revenue Million Forecast, by Type 2019 & 2032
- Table 88: Global US Smart Meter Industry Volume K Unit Forecast, by Type 2019 & 2032
- Table 89: Global US Smart Meter Industry Revenue Million Forecast, by End-User 2019 & 2032
- Table 90: Global US Smart Meter Industry Volume K Unit Forecast, by End-User 2019 & 2032
- Table 91: Global US Smart Meter Industry Revenue Million Forecast, by Country 2019 & 2032
- Table 92: Global US Smart Meter Industry Volume K Unit Forecast, by Country 2019 & 2032
- Table 93: China US Smart Meter Industry Revenue (Million) Forecast, by Application 2019 & 2032
- Table 94: China US Smart Meter Industry Volume (K Unit) Forecast, by Application 2019 & 2032
- Table 95: India US Smart Meter Industry Revenue (Million) Forecast, by Application 2019 & 2032
- Table 96: India US Smart Meter Industry Volume (K Unit) Forecast, by Application 2019 & 2032
- Table 97: Japan US Smart Meter Industry Revenue (Million) Forecast, by Application 2019 & 2032
- Table 98: Japan US Smart Meter Industry Volume (K Unit) Forecast, by Application 2019 & 2032
- Table 99: South Korea US Smart Meter Industry Revenue (Million) Forecast, by Application 2019 & 2032
- Table 100: South Korea US Smart Meter Industry Volume (K Unit) Forecast, by Application 2019 & 2032
- Table 101: ASEAN US Smart Meter Industry Revenue (Million) Forecast, by Application 2019 & 2032
- Table 102: ASEAN US Smart Meter Industry Volume (K Unit) Forecast, by Application 2019 & 2032
- Table 103: Oceania US Smart Meter Industry Revenue (Million) Forecast, by Application 2019 & 2032
- Table 104: Oceania US Smart Meter Industry Volume (K Unit) Forecast, by Application 2019 & 2032
- Table 105: Rest of Asia Pacific US Smart Meter Industry Revenue (Million) Forecast, by Application 2019 & 2032
- Table 106: Rest of Asia Pacific US Smart Meter Industry Volume (K Unit) Forecast, by Application 2019 & 2032
Frequently Asked Questions
1. What is the projected Compound Annual Growth Rate (CAGR) of the US Smart Meter Industry?
The projected CAGR is approximately 9.80%.
2. Which companies are prominent players in the US Smart Meter Industry?
Key companies in the market include Itron Inc, Badger Meter Inc, Kamstrup, Elster American Meter (Honeywell International Inc ), Neptune Technology Group Inc, Sensus USA Inc (Xylem Inc ), General Electric Co, Diehl Metering US, Mueller Systems LLC.
3. What are the main segments of the US Smart Meter Industry?
The market segments include Type, End-User.
4. Can you provide details about the market size?
The market size is estimated to be USD XX Million as of 2022.
5. What are some drivers contributing to market growth?
Higher Consumer Awareness and Government Regulations Mandating the Installation of Smart Meters; Increased Investments in Smart Grid Projects; Investments in Smart City Developments.
6. What are the notable trends driving market growth?
Smart Gas Meter Segment to Grow Significantly.
7. Are there any restraints impacting market growth?
High Installation Cost and Longer ROI Period; Longer Replacement Cycle of Water Meters.
8. Can you provide examples of recent developments in the market?
January 2021 - Badger Meter, Inc. announced the acquisition of US-based Analytical Technology, Inc. (ATi), a privately held provider of water quality monitoring systems, for USD 44 million. ATi specializes in the design, manufacture and distribution of water quality instruments based on electrochemical and optical sensors.
9. What pricing options are available for accessing the report?
Pricing options include single-user, multi-user, and enterprise licenses priced at USD 3800, USD 4500, and USD 5800 respectively.
10. Is the market size provided in terms of value or volume?
The market size is provided in terms of value, measured in Million and volume, measured in K Unit.
11. Are there any specific market keywords associated with the report?
Yes, the market keyword associated with the report is "US Smart Meter Industry," which aids in identifying and referencing the specific market segment covered.
12. How do I determine which pricing option suits my needs best?
The pricing options vary based on user requirements and access needs. Individual users may opt for single-user licenses, while businesses requiring broader access may choose multi-user or enterprise licenses for cost-effective access to the report.
13. Are there any additional resources or data provided in the US Smart Meter Industry report?
While the report offers comprehensive insights, it's advisable to review the specific contents or supplementary materials provided to ascertain if additional resources or data are available.
14. How can I stay updated on further developments or reports in the US Smart Meter Industry?
To stay informed about further developments, trends, and reports in the US Smart Meter Industry, consider subscribing to industry newsletters, following relevant companies and organizations, or regularly checking reputable industry news sources and publications.
Methodology
Step 1 - Identification of Relevant Samples Size from Population Database


Step 2 - Approaches for Defining Global Market Size (Value, Volume* & Price*)

Note*: In applicable scenarios
Step 3 - Data Sources
Primary Research
- Web Analytics
- Survey Reports
- Research Institute
- Latest Research Reports
- Opinion Leaders
Secondary Research
- Annual Reports
- White Paper
- Latest Press Release
- Industry Association
- Paid Database
- Investor Presentations

Step 4 - Data Triangulation
Involves using different sources of information in order to increase the validity of a study
These sources are likely to be stakeholders in a program - participants, other researchers, program staff, other community members, and so on.
Then we put all data in single framework & apply various statistical tools to find out the dynamic on the market.
During the analysis stage, feedback from the stakeholder groups would be compared to determine areas of agreement as well as areas of divergence


