
Key Insights
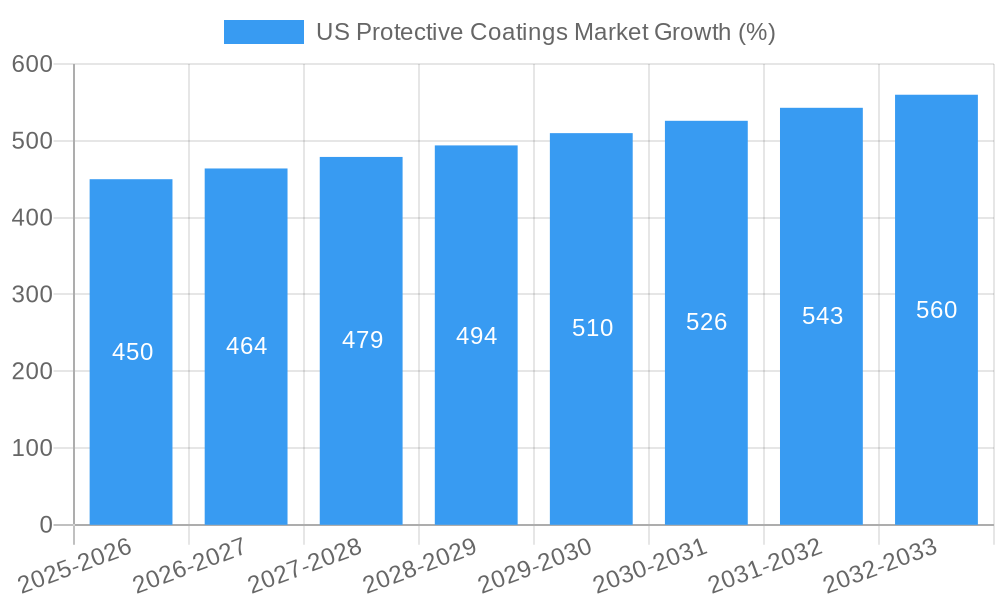
The US protective coatings market, exhibiting a CAGR exceeding 3% since 2019, is poised for continued growth through 2033. Driven by robust infrastructure development, particularly in the energy (oil and gas, power) and construction sectors, demand for durable and protective coatings remains strong. Increased regulatory scrutiny on environmental impact is pushing the adoption of water-borne coatings over solvent-borne alternatives, a trend further fueled by growing environmental awareness amongst consumers and businesses. The market is segmented by resin type (epoxy, acrylic, alkyd, polyurethane, polyester, others), technology (water-borne, solvent-borne, powder, others), and end-user industry (oil & gas, mining, power, infrastructure, others). Major players like AkzoNobel, Jotun, PPG Industries, and Sherwin-Williams are leveraging technological advancements and strategic acquisitions to maintain market share. While raw material price fluctuations pose a challenge, the long-term outlook remains positive, fueled by consistent investment in infrastructure projects and a growing focus on asset protection across various industries.
The geographic distribution of the market within the US shows strong performance across all regions, with potential for growth varying based on regional infrastructure projects and economic activity. The Northeast and West, known for their developed infrastructure and significant industrial activity, currently hold larger market shares. However, the Midwest and South are experiencing rapid growth driven by industrial expansion and investment in renewable energy projects. Competition is intense, with established players focused on innovation in product formulations to cater to specific industry needs and emerging environmental regulations. The market's success hinges on the continued investment in infrastructure, sustained economic growth, and the ongoing adoption of sustainable coating technologies. Further analysis indicates a strong potential for niche applications within specialized industries, potentially leading to a higher-than-projected CAGR in specific segments.

US Protective Coatings Market: A Comprehensive Report (2019-2033)
This in-depth report provides a comprehensive analysis of the US Protective Coatings market, encompassing market dynamics, growth trends, dominant segments, and key players. With a study period spanning 2019-2033, a base year of 2025, and a forecast period of 2025-2033, this report offers invaluable insights for industry professionals, investors, and strategic decision-makers. The market is segmented by resin type (Epoxy, Acrylic, Alkyd, Polyurethane, Polyester, Other Resin Types), technology (Water Borne Coatings, Solvent Borne Coatings, Powder Coatings, Other Technologies), and end-user industry (Oil and Gas, Mining, Power, Infrastructure, Other End-user Industries). The total market value in 2025 is estimated at XX Million.
US Protective Coatings Market Market Dynamics & Structure
The US protective coatings market is characterized by a moderately concentrated landscape with several major players and numerous smaller niche participants. Technological innovation, driven by the need for enhanced durability, corrosion resistance, and environmental sustainability, is a key driver. Stringent environmental regulations, particularly concerning VOC emissions, significantly influence product formulation and manufacturing processes. Competitive pressures stem from substitute materials and technologies, particularly in specific end-use applications. The market's demographics are shaped by the growth of infrastructure projects, the energy sector's demands, and increasing industrial activity. Mergers and acquisitions (M&A) activity has been relatively robust in recent years, reflecting consolidation trends within the industry.
- Market Concentration: Moderately concentrated, with top 5 players holding approximately xx% market share in 2025.
- Technological Innovation: Focus on eco-friendly waterborne coatings, advanced polymer chemistries, and improved application techniques.
- Regulatory Framework: Stringent environmental regulations (e.g., VOC limits) impacting product formulations.
- Competitive Substitutes: Alternative materials like advanced composites posing a threat in specific niches.
- End-User Demographics: Driven by infrastructure development, energy sector growth, and industrial expansion.
- M&A Trends: Significant M&A activity in recent years, leading to market consolidation (e.g., xx deals in the last 5 years).
US Protective Coatings Market Growth Trends & Insights
The US protective coatings market is projected to experience robust growth throughout the forecast period (2025-2033), driven by several interconnected factors. Expanding infrastructure projects, particularly in transportation and energy, are significantly boosting demand for protective coatings. The increasing awareness of corrosion prevention and asset protection is prompting greater adoption rates in various industries. Technological advancements, particularly in waterborne and high-performance coatings, are driving market penetration. Shifting consumer preferences towards sustainable and eco-friendly products are shaping product development and market trends. The market is expected to exhibit a CAGR of xx% during the forecast period, reaching an estimated value of xx Million by 2033. Market penetration in key end-user industries, such as oil and gas and infrastructure, is expected to increase steadily.
Dominant Regions, Countries, or Segments in US Protective Coatings Market
The US protective coatings market exhibits regional variations in growth, influenced by economic conditions, infrastructure investment, and industry-specific demands. The Southeast and Gulf Coast regions demonstrate strong growth potential due to the concentration of industrial activities and infrastructure projects. Within the segments, the epoxy resin type holds the largest market share due to its superior corrosion resistance properties. Waterborne coatings technology is witnessing significant growth due to stringent environmental regulations and improved performance characteristics. The oil and gas sector remains a key end-user industry, driving significant demand for specialized protective coatings.
- Key Drivers: Infrastructure development, energy sector investments, industrial growth, stringent environmental regulations.
- Dominant Segments: Epoxy resins (xx% market share in 2025), Waterborne coatings (xx% market share in 2025), Oil & Gas end-user industry (xx% market share in 2025).
- Growth Potential: High growth potential in the renewable energy sector and infrastructure projects.
US Protective Coatings Market Product Landscape
The US protective coatings market showcases a diverse range of products, with innovations focused on enhancing durability, corrosion resistance, and environmental performance. Advanced polymer chemistries, UV-resistant formulations, and self-healing technologies are key product differentiators. Products are tailored to specific application needs and end-user industries, focusing on long-term performance and cost-effectiveness. The market features high-performance coatings offering superior protection against extreme environmental conditions. Unique selling propositions encompass enhanced longevity, reduced maintenance costs, and improved aesthetic qualities.
Key Drivers, Barriers & Challenges in US Protective Coatings Market
Key Drivers:
- Growing demand from infrastructure projects and energy sectors.
- Increasing awareness of corrosion prevention and asset protection.
- Technological advancements in high-performance coatings.
- Stringent environmental regulations driving demand for eco-friendly products.
Challenges & Restraints:
- Fluctuations in raw material prices impacting manufacturing costs.
- Stringent regulatory compliance requirements and potential delays.
- Intense competition among established and emerging players. The impact of these challenges is estimated to result in a xx% reduction in market growth in 2026.
Emerging Opportunities in US Protective Coatings Market
- Growing demand for protective coatings in the renewable energy sector (solar, wind).
- Expansion into emerging applications, such as marine and aerospace coatings.
- Increasing consumer preference for sustainable and eco-friendly coatings.
- Development of innovative application technologies (e.g., robotic spraying).
Growth Accelerators in the US Protective Coatings Market Industry
The US protective coatings market's long-term growth trajectory is fueled by several crucial factors. Technological advancements in high-performance coatings are driving innovation and expanding application possibilities. Strategic partnerships between coating manufacturers and end-user industries are fostering collaboration and market penetration. Expansion into new geographic markets and emerging applications presents significant growth opportunities. The government's focus on infrastructure development further propels market expansion.
Key Players Shaping the US Protective Coatings Market Market
- AkzoNobel N V
- Dampney
- Jotun
- INDURON
- RPM International Inc
- DECO Coatings
- PPG Industries Inc
- Beckers Group
- APV Coatings
- Axalta Coating Systems
- Heresite
- Hempel A/S
- Tnemec
- The Sherwin Williams Company
- US Coatings
- MIPA SE
Notable Milestones in US Protective Coatings Market Sector
- January 2022: Seal for Life Industries acquires Mascoat Ltd and Verdia Inc., expanding its presence in the industrial coatings market.
- November 2022: The Protech Group acquires Evotech Industrial Coatings' liquid coatings business, signifying industry consolidation.
In-Depth US Protective Coatings Market Market Outlook
The US protective coatings market is poised for continued growth, driven by technological innovation, robust infrastructure spending, and the expanding need for corrosion protection across various industries. The focus on sustainable and high-performance coatings presents lucrative opportunities for market players. Strategic partnerships and expansion into niche applications will further accelerate market growth in the coming years. The market's future potential hinges on addressing challenges related to raw material costs and regulatory compliance, ensuring sustained growth and profitability.
US Protective Coatings Market Segmentation
-
1. Resin Type
- 1.1. Epoxy
- 1.2. Acrylic
- 1.3. Alkyd
- 1.4. Polyurethane
- 1.5. Polyester
- 1.6. Other Resin Types
-
2. Technology
- 2.1. Water Borne Coatings
- 2.2. Solvent Borne Coatings
- 2.3. Powder Coatings
- 2.4. Other Technologies
-
3. End-user Industry
- 3.1. Oil and Gas
- 3.2. Mining
- 3.3. Power
- 3.4. Infrastructure
- 3.5. Other End-user Industries
US Protective Coatings Market Segmentation By Geography
-
1. North America
- 1.1. United States
- 1.2. Canada
- 1.3. Mexico
-
2. South America
- 2.1. Brazil
- 2.2. Argentina
- 2.3. Rest of South America
-
3. Europe
- 3.1. United Kingdom
- 3.2. Germany
- 3.3. France
- 3.4. Italy
- 3.5. Spain
- 3.6. Russia
- 3.7. Benelux
- 3.8. Nordics
- 3.9. Rest of Europe
-
4. Middle East & Africa
- 4.1. Turkey
- 4.2. Israel
- 4.3. GCC
- 4.4. North Africa
- 4.5. South Africa
- 4.6. Rest of Middle East & Africa
-
5. Asia Pacific
- 5.1. China
- 5.2. India
- 5.3. Japan
- 5.4. South Korea
- 5.5. ASEAN
- 5.6. Oceania
- 5.7. Rest of Asia Pacific

US Protective Coatings Market REPORT HIGHLIGHTS
| Aspects | Details |
|---|---|
| Study Period | 2019-2033 |
| Base Year | 2024 |
| Estimated Year | 2025 |
| Forecast Period | 2025-2033 |
| Historical Period | 2019-2024 |
| Growth Rate | CAGR of > 3.00% from 2019-2033 |
| Segmentation |
|
Table of Contents
- 1. Introduction
- 1.1. Research Scope
- 1.2. Market Segmentation
- 1.3. Research Methodology
- 1.4. Definitions and Assumptions
- 2. Executive Summary
- 2.1. Introduction
- 3. Market Dynamics
- 3.1. Introduction
- 3.2. Market Drivers
- 3.2.1. Increasing Activity in the Oil and Gas Sector; Infrastructure sector to Fuel in the Demand for Protective Coatings
- 3.3. Market Restrains
- 3.3.1. Price Hikes of Raw Materials; Other Restraints
- 3.4. Market Trends
- 3.4.1. Increasing Activity in the Oil and Gas Sector
- 4. Market Factor Analysis
- 4.1. Porters Five Forces
- 4.2. Supply/Value Chain
- 4.3. PESTEL analysis
- 4.4. Market Entropy
- 4.5. Patent/Trademark Analysis
- 5. Global US Protective Coatings Market Analysis, Insights and Forecast, 2019-2031
- 5.1. Market Analysis, Insights and Forecast - by Resin Type
- 5.1.1. Epoxy
- 5.1.2. Acrylic
- 5.1.3. Alkyd
- 5.1.4. Polyurethane
- 5.1.5. Polyester
- 5.1.6. Other Resin Types
- 5.2. Market Analysis, Insights and Forecast - by Technology
- 5.2.1. Water Borne Coatings
- 5.2.2. Solvent Borne Coatings
- 5.2.3. Powder Coatings
- 5.2.4. Other Technologies
- 5.3. Market Analysis, Insights and Forecast - by End-user Industry
- 5.3.1. Oil and Gas
- 5.3.2. Mining
- 5.3.3. Power
- 5.3.4. Infrastructure
- 5.3.5. Other End-user Industries
- 5.4. Market Analysis, Insights and Forecast - by Region
- 5.4.1. North America
- 5.4.2. South America
- 5.4.3. Europe
- 5.4.4. Middle East & Africa
- 5.4.5. Asia Pacific
- 5.1. Market Analysis, Insights and Forecast - by Resin Type
- 6. North America US Protective Coatings Market Analysis, Insights and Forecast, 2019-2031
- 6.1. Market Analysis, Insights and Forecast - by Resin Type
- 6.1.1. Epoxy
- 6.1.2. Acrylic
- 6.1.3. Alkyd
- 6.1.4. Polyurethane
- 6.1.5. Polyester
- 6.1.6. Other Resin Types
- 6.2. Market Analysis, Insights and Forecast - by Technology
- 6.2.1. Water Borne Coatings
- 6.2.2. Solvent Borne Coatings
- 6.2.3. Powder Coatings
- 6.2.4. Other Technologies
- 6.3. Market Analysis, Insights and Forecast - by End-user Industry
- 6.3.1. Oil and Gas
- 6.3.2. Mining
- 6.3.3. Power
- 6.3.4. Infrastructure
- 6.3.5. Other End-user Industries
- 6.1. Market Analysis, Insights and Forecast - by Resin Type
- 7. South America US Protective Coatings Market Analysis, Insights and Forecast, 2019-2031
- 7.1. Market Analysis, Insights and Forecast - by Resin Type
- 7.1.1. Epoxy
- 7.1.2. Acrylic
- 7.1.3. Alkyd
- 7.1.4. Polyurethane
- 7.1.5. Polyester
- 7.1.6. Other Resin Types
- 7.2. Market Analysis, Insights and Forecast - by Technology
- 7.2.1. Water Borne Coatings
- 7.2.2. Solvent Borne Coatings
- 7.2.3. Powder Coatings
- 7.2.4. Other Technologies
- 7.3. Market Analysis, Insights and Forecast - by End-user Industry
- 7.3.1. Oil and Gas
- 7.3.2. Mining
- 7.3.3. Power
- 7.3.4. Infrastructure
- 7.3.5. Other End-user Industries
- 7.1. Market Analysis, Insights and Forecast - by Resin Type
- 8. Europe US Protective Coatings Market Analysis, Insights and Forecast, 2019-2031
- 8.1. Market Analysis, Insights and Forecast - by Resin Type
- 8.1.1. Epoxy
- 8.1.2. Acrylic
- 8.1.3. Alkyd
- 8.1.4. Polyurethane
- 8.1.5. Polyester
- 8.1.6. Other Resin Types
- 8.2. Market Analysis, Insights and Forecast - by Technology
- 8.2.1. Water Borne Coatings
- 8.2.2. Solvent Borne Coatings
- 8.2.3. Powder Coatings
- 8.2.4. Other Technologies
- 8.3. Market Analysis, Insights and Forecast - by End-user Industry
- 8.3.1. Oil and Gas
- 8.3.2. Mining
- 8.3.3. Power
- 8.3.4. Infrastructure
- 8.3.5. Other End-user Industries
- 8.1. Market Analysis, Insights and Forecast - by Resin Type
- 9. Middle East & Africa US Protective Coatings Market Analysis, Insights and Forecast, 2019-2031
- 9.1. Market Analysis, Insights and Forecast - by Resin Type
- 9.1.1. Epoxy
- 9.1.2. Acrylic
- 9.1.3. Alkyd
- 9.1.4. Polyurethane
- 9.1.5. Polyester
- 9.1.6. Other Resin Types
- 9.2. Market Analysis, Insights and Forecast - by Technology
- 9.2.1. Water Borne Coatings
- 9.2.2. Solvent Borne Coatings
- 9.2.3. Powder Coatings
- 9.2.4. Other Technologies
- 9.3. Market Analysis, Insights and Forecast - by End-user Industry
- 9.3.1. Oil and Gas
- 9.3.2. Mining
- 9.3.3. Power
- 9.3.4. Infrastructure
- 9.3.5. Other End-user Industries
- 9.1. Market Analysis, Insights and Forecast - by Resin Type
- 10. Asia Pacific US Protective Coatings Market Analysis, Insights and Forecast, 2019-2031
- 10.1. Market Analysis, Insights and Forecast - by Resin Type
- 10.1.1. Epoxy
- 10.1.2. Acrylic
- 10.1.3. Alkyd
- 10.1.4. Polyurethane
- 10.1.5. Polyester
- 10.1.6. Other Resin Types
- 10.2. Market Analysis, Insights and Forecast - by Technology
- 10.2.1. Water Borne Coatings
- 10.2.2. Solvent Borne Coatings
- 10.2.3. Powder Coatings
- 10.2.4. Other Technologies
- 10.3. Market Analysis, Insights and Forecast - by End-user Industry
- 10.3.1. Oil and Gas
- 10.3.2. Mining
- 10.3.3. Power
- 10.3.4. Infrastructure
- 10.3.5. Other End-user Industries
- 10.1. Market Analysis, Insights and Forecast - by Resin Type
- 11. Northeast US Protective Coatings Market Analysis, Insights and Forecast, 2019-2031
- 12. Southeast US Protective Coatings Market Analysis, Insights and Forecast, 2019-2031
- 13. Midwest US Protective Coatings Market Analysis, Insights and Forecast, 2019-2031
- 14. Southwest US Protective Coatings Market Analysis, Insights and Forecast, 2019-2031
- 15. West US Protective Coatings Market Analysis, Insights and Forecast, 2019-2031
- 16. Competitive Analysis
- 16.1. Global Market Share Analysis 2024
- 16.2. Company Profiles
- 16.2.1 AkzoNobel N V
- 16.2.1.1. Overview
- 16.2.1.2. Products
- 16.2.1.3. SWOT Analysis
- 16.2.1.4. Recent Developments
- 16.2.1.5. Financials (Based on Availability)
- 16.2.2 Dampney
- 16.2.2.1. Overview
- 16.2.2.2. Products
- 16.2.2.3. SWOT Analysis
- 16.2.2.4. Recent Developments
- 16.2.2.5. Financials (Based on Availability)
- 16.2.3 Jotun
- 16.2.3.1. Overview
- 16.2.3.2. Products
- 16.2.3.3. SWOT Analysis
- 16.2.3.4. Recent Developments
- 16.2.3.5. Financials (Based on Availability)
- 16.2.4 INDURON
- 16.2.4.1. Overview
- 16.2.4.2. Products
- 16.2.4.3. SWOT Analysis
- 16.2.4.4. Recent Developments
- 16.2.4.5. Financials (Based on Availability)
- 16.2.5 RPM International Inc
- 16.2.5.1. Overview
- 16.2.5.2. Products
- 16.2.5.3. SWOT Analysis
- 16.2.5.4. Recent Developments
- 16.2.5.5. Financials (Based on Availability)
- 16.2.6 DECO Coatings
- 16.2.6.1. Overview
- 16.2.6.2. Products
- 16.2.6.3. SWOT Analysis
- 16.2.6.4. Recent Developments
- 16.2.6.5. Financials (Based on Availability)
- 16.2.7 PPG Industries Inc
- 16.2.7.1. Overview
- 16.2.7.2. Products
- 16.2.7.3. SWOT Analysis
- 16.2.7.4. Recent Developments
- 16.2.7.5. Financials (Based on Availability)
- 16.2.8 Beckers Group
- 16.2.8.1. Overview
- 16.2.8.2. Products
- 16.2.8.3. SWOT Analysis
- 16.2.8.4. Recent Developments
- 16.2.8.5. Financials (Based on Availability)
- 16.2.9 APV Coatings
- 16.2.9.1. Overview
- 16.2.9.2. Products
- 16.2.9.3. SWOT Analysis
- 16.2.9.4. Recent Developments
- 16.2.9.5. Financials (Based on Availability)
- 16.2.10 Axalta Coating Systems
- 16.2.10.1. Overview
- 16.2.10.2. Products
- 16.2.10.3. SWOT Analysis
- 16.2.10.4. Recent Developments
- 16.2.10.5. Financials (Based on Availability)
- 16.2.11 Heresite
- 16.2.11.1. Overview
- 16.2.11.2. Products
- 16.2.11.3. SWOT Analysis
- 16.2.11.4. Recent Developments
- 16.2.11.5. Financials (Based on Availability)
- 16.2.12 Hempel A/S
- 16.2.12.1. Overview
- 16.2.12.2. Products
- 16.2.12.3. SWOT Analysis
- 16.2.12.4. Recent Developments
- 16.2.12.5. Financials (Based on Availability)
- 16.2.13 Tnemec
- 16.2.13.1. Overview
- 16.2.13.2. Products
- 16.2.13.3. SWOT Analysis
- 16.2.13.4. Recent Developments
- 16.2.13.5. Financials (Based on Availability)
- 16.2.14 The Sherwin Williams Company
- 16.2.14.1. Overview
- 16.2.14.2. Products
- 16.2.14.3. SWOT Analysis
- 16.2.14.4. Recent Developments
- 16.2.14.5. Financials (Based on Availability)
- 16.2.15 US Coatings*List Not Exhaustive
- 16.2.15.1. Overview
- 16.2.15.2. Products
- 16.2.15.3. SWOT Analysis
- 16.2.15.4. Recent Developments
- 16.2.15.5. Financials (Based on Availability)
- 16.2.16 MIPA SE
- 16.2.16.1. Overview
- 16.2.16.2. Products
- 16.2.16.3. SWOT Analysis
- 16.2.16.4. Recent Developments
- 16.2.16.5. Financials (Based on Availability)
- 16.2.1 AkzoNobel N V
List of Figures
- Figure 1: Global US Protective Coatings Market Revenue Breakdown (Million, %) by Region 2024 & 2032
- Figure 2: United states US Protective Coatings Market Revenue (Million), by Country 2024 & 2032
- Figure 3: United states US Protective Coatings Market Revenue Share (%), by Country 2024 & 2032
- Figure 4: North America US Protective Coatings Market Revenue (Million), by Resin Type 2024 & 2032
- Figure 5: North America US Protective Coatings Market Revenue Share (%), by Resin Type 2024 & 2032
- Figure 6: North America US Protective Coatings Market Revenue (Million), by Technology 2024 & 2032
- Figure 7: North America US Protective Coatings Market Revenue Share (%), by Technology 2024 & 2032
- Figure 8: North America US Protective Coatings Market Revenue (Million), by End-user Industry 2024 & 2032
- Figure 9: North America US Protective Coatings Market Revenue Share (%), by End-user Industry 2024 & 2032
- Figure 10: North America US Protective Coatings Market Revenue (Million), by Country 2024 & 2032
- Figure 11: North America US Protective Coatings Market Revenue Share (%), by Country 2024 & 2032
- Figure 12: South America US Protective Coatings Market Revenue (Million), by Resin Type 2024 & 2032
- Figure 13: South America US Protective Coatings Market Revenue Share (%), by Resin Type 2024 & 2032
- Figure 14: South America US Protective Coatings Market Revenue (Million), by Technology 2024 & 2032
- Figure 15: South America US Protective Coatings Market Revenue Share (%), by Technology 2024 & 2032
- Figure 16: South America US Protective Coatings Market Revenue (Million), by End-user Industry 2024 & 2032
- Figure 17: South America US Protective Coatings Market Revenue Share (%), by End-user Industry 2024 & 2032
- Figure 18: South America US Protective Coatings Market Revenue (Million), by Country 2024 & 2032
- Figure 19: South America US Protective Coatings Market Revenue Share (%), by Country 2024 & 2032
- Figure 20: Europe US Protective Coatings Market Revenue (Million), by Resin Type 2024 & 2032
- Figure 21: Europe US Protective Coatings Market Revenue Share (%), by Resin Type 2024 & 2032
- Figure 22: Europe US Protective Coatings Market Revenue (Million), by Technology 2024 & 2032
- Figure 23: Europe US Protective Coatings Market Revenue Share (%), by Technology 2024 & 2032
- Figure 24: Europe US Protective Coatings Market Revenue (Million), by End-user Industry 2024 & 2032
- Figure 25: Europe US Protective Coatings Market Revenue Share (%), by End-user Industry 2024 & 2032
- Figure 26: Europe US Protective Coatings Market Revenue (Million), by Country 2024 & 2032
- Figure 27: Europe US Protective Coatings Market Revenue Share (%), by Country 2024 & 2032
- Figure 28: Middle East & Africa US Protective Coatings Market Revenue (Million), by Resin Type 2024 & 2032
- Figure 29: Middle East & Africa US Protective Coatings Market Revenue Share (%), by Resin Type 2024 & 2032
- Figure 30: Middle East & Africa US Protective Coatings Market Revenue (Million), by Technology 2024 & 2032
- Figure 31: Middle East & Africa US Protective Coatings Market Revenue Share (%), by Technology 2024 & 2032
- Figure 32: Middle East & Africa US Protective Coatings Market Revenue (Million), by End-user Industry 2024 & 2032
- Figure 33: Middle East & Africa US Protective Coatings Market Revenue Share (%), by End-user Industry 2024 & 2032
- Figure 34: Middle East & Africa US Protective Coatings Market Revenue (Million), by Country 2024 & 2032
- Figure 35: Middle East & Africa US Protective Coatings Market Revenue Share (%), by Country 2024 & 2032
- Figure 36: Asia Pacific US Protective Coatings Market Revenue (Million), by Resin Type 2024 & 2032
- Figure 37: Asia Pacific US Protective Coatings Market Revenue Share (%), by Resin Type 2024 & 2032
- Figure 38: Asia Pacific US Protective Coatings Market Revenue (Million), by Technology 2024 & 2032
- Figure 39: Asia Pacific US Protective Coatings Market Revenue Share (%), by Technology 2024 & 2032
- Figure 40: Asia Pacific US Protective Coatings Market Revenue (Million), by End-user Industry 2024 & 2032
- Figure 41: Asia Pacific US Protective Coatings Market Revenue Share (%), by End-user Industry 2024 & 2032
- Figure 42: Asia Pacific US Protective Coatings Market Revenue (Million), by Country 2024 & 2032
- Figure 43: Asia Pacific US Protective Coatings Market Revenue Share (%), by Country 2024 & 2032
List of Tables
- Table 1: Global US Protective Coatings Market Revenue Million Forecast, by Region 2019 & 2032
- Table 2: Global US Protective Coatings Market Revenue Million Forecast, by Resin Type 2019 & 2032
- Table 3: Global US Protective Coatings Market Revenue Million Forecast, by Technology 2019 & 2032
- Table 4: Global US Protective Coatings Market Revenue Million Forecast, by End-user Industry 2019 & 2032
- Table 5: Global US Protective Coatings Market Revenue Million Forecast, by Region 2019 & 2032
- Table 6: Global US Protective Coatings Market Revenue Million Forecast, by Country 2019 & 2032
- Table 7: Northeast US Protective Coatings Market Revenue (Million) Forecast, by Application 2019 & 2032
- Table 8: Southeast US Protective Coatings Market Revenue (Million) Forecast, by Application 2019 & 2032
- Table 9: Midwest US Protective Coatings Market Revenue (Million) Forecast, by Application 2019 & 2032
- Table 10: Southwest US Protective Coatings Market Revenue (Million) Forecast, by Application 2019 & 2032
- Table 11: West US Protective Coatings Market Revenue (Million) Forecast, by Application 2019 & 2032
- Table 12: Global US Protective Coatings Market Revenue Million Forecast, by Resin Type 2019 & 2032
- Table 13: Global US Protective Coatings Market Revenue Million Forecast, by Technology 2019 & 2032
- Table 14: Global US Protective Coatings Market Revenue Million Forecast, by End-user Industry 2019 & 2032
- Table 15: Global US Protective Coatings Market Revenue Million Forecast, by Country 2019 & 2032
- Table 16: United States US Protective Coatings Market Revenue (Million) Forecast, by Application 2019 & 2032
- Table 17: Canada US Protective Coatings Market Revenue (Million) Forecast, by Application 2019 & 2032
- Table 18: Mexico US Protective Coatings Market Revenue (Million) Forecast, by Application 2019 & 2032
- Table 19: Global US Protective Coatings Market Revenue Million Forecast, by Resin Type 2019 & 2032
- Table 20: Global US Protective Coatings Market Revenue Million Forecast, by Technology 2019 & 2032
- Table 21: Global US Protective Coatings Market Revenue Million Forecast, by End-user Industry 2019 & 2032
- Table 22: Global US Protective Coatings Market Revenue Million Forecast, by Country 2019 & 2032
- Table 23: Brazil US Protective Coatings Market Revenue (Million) Forecast, by Application 2019 & 2032
- Table 24: Argentina US Protective Coatings Market Revenue (Million) Forecast, by Application 2019 & 2032
- Table 25: Rest of South America US Protective Coatings Market Revenue (Million) Forecast, by Application 2019 & 2032
- Table 26: Global US Protective Coatings Market Revenue Million Forecast, by Resin Type 2019 & 2032
- Table 27: Global US Protective Coatings Market Revenue Million Forecast, by Technology 2019 & 2032
- Table 28: Global US Protective Coatings Market Revenue Million Forecast, by End-user Industry 2019 & 2032
- Table 29: Global US Protective Coatings Market Revenue Million Forecast, by Country 2019 & 2032
- Table 30: United Kingdom US Protective Coatings Market Revenue (Million) Forecast, by Application 2019 & 2032
- Table 31: Germany US Protective Coatings Market Revenue (Million) Forecast, by Application 2019 & 2032
- Table 32: France US Protective Coatings Market Revenue (Million) Forecast, by Application 2019 & 2032
- Table 33: Italy US Protective Coatings Market Revenue (Million) Forecast, by Application 2019 & 2032
- Table 34: Spain US Protective Coatings Market Revenue (Million) Forecast, by Application 2019 & 2032
- Table 35: Russia US Protective Coatings Market Revenue (Million) Forecast, by Application 2019 & 2032
- Table 36: Benelux US Protective Coatings Market Revenue (Million) Forecast, by Application 2019 & 2032
- Table 37: Nordics US Protective Coatings Market Revenue (Million) Forecast, by Application 2019 & 2032
- Table 38: Rest of Europe US Protective Coatings Market Revenue (Million) Forecast, by Application 2019 & 2032
- Table 39: Global US Protective Coatings Market Revenue Million Forecast, by Resin Type 2019 & 2032
- Table 40: Global US Protective Coatings Market Revenue Million Forecast, by Technology 2019 & 2032
- Table 41: Global US Protective Coatings Market Revenue Million Forecast, by End-user Industry 2019 & 2032
- Table 42: Global US Protective Coatings Market Revenue Million Forecast, by Country 2019 & 2032
- Table 43: Turkey US Protective Coatings Market Revenue (Million) Forecast, by Application 2019 & 2032
- Table 44: Israel US Protective Coatings Market Revenue (Million) Forecast, by Application 2019 & 2032
- Table 45: GCC US Protective Coatings Market Revenue (Million) Forecast, by Application 2019 & 2032
- Table 46: North Africa US Protective Coatings Market Revenue (Million) Forecast, by Application 2019 & 2032
- Table 47: South Africa US Protective Coatings Market Revenue (Million) Forecast, by Application 2019 & 2032
- Table 48: Rest of Middle East & Africa US Protective Coatings Market Revenue (Million) Forecast, by Application 2019 & 2032
- Table 49: Global US Protective Coatings Market Revenue Million Forecast, by Resin Type 2019 & 2032
- Table 50: Global US Protective Coatings Market Revenue Million Forecast, by Technology 2019 & 2032
- Table 51: Global US Protective Coatings Market Revenue Million Forecast, by End-user Industry 2019 & 2032
- Table 52: Global US Protective Coatings Market Revenue Million Forecast, by Country 2019 & 2032
- Table 53: China US Protective Coatings Market Revenue (Million) Forecast, by Application 2019 & 2032
- Table 54: India US Protective Coatings Market Revenue (Million) Forecast, by Application 2019 & 2032
- Table 55: Japan US Protective Coatings Market Revenue (Million) Forecast, by Application 2019 & 2032
- Table 56: South Korea US Protective Coatings Market Revenue (Million) Forecast, by Application 2019 & 2032
- Table 57: ASEAN US Protective Coatings Market Revenue (Million) Forecast, by Application 2019 & 2032
- Table 58: Oceania US Protective Coatings Market Revenue (Million) Forecast, by Application 2019 & 2032
- Table 59: Rest of Asia Pacific US Protective Coatings Market Revenue (Million) Forecast, by Application 2019 & 2032
Frequently Asked Questions
1. What is the projected Compound Annual Growth Rate (CAGR) of the US Protective Coatings Market?
The projected CAGR is approximately > 3.00%.
2. Which companies are prominent players in the US Protective Coatings Market?
Key companies in the market include AkzoNobel N V, Dampney, Jotun, INDURON, RPM International Inc, DECO Coatings, PPG Industries Inc, Beckers Group, APV Coatings, Axalta Coating Systems, Heresite, Hempel A/S, Tnemec, The Sherwin Williams Company, US Coatings*List Not Exhaustive, MIPA SE.
3. What are the main segments of the US Protective Coatings Market?
The market segments include Resin Type, Technology, End-user Industry.
4. Can you provide details about the market size?
The market size is estimated to be USD XX Million as of 2022.
5. What are some drivers contributing to market growth?
Increasing Activity in the Oil and Gas Sector; Infrastructure sector to Fuel in the Demand for Protective Coatings.
6. What are the notable trends driving market growth?
Increasing Activity in the Oil and Gas Sector.
7. Are there any restraints impacting market growth?
Price Hikes of Raw Materials; Other Restraints.
8. Can you provide examples of recent developments in the market?
January 2022: Seal for Life Industries, a paints and coatings manufacturer, acquired two privately owned industrial coatings companies based out of the United States, which include Mascoat Ltd and Verdia Inc.
9. What pricing options are available for accessing the report?
Pricing options include single-user, multi-user, and enterprise licenses priced at USD 3800, USD 4500, and USD 5800 respectively.
10. Is the market size provided in terms of value or volume?
The market size is provided in terms of value, measured in Million.
11. Are there any specific market keywords associated with the report?
Yes, the market keyword associated with the report is "US Protective Coatings Market," which aids in identifying and referencing the specific market segment covered.
12. How do I determine which pricing option suits my needs best?
The pricing options vary based on user requirements and access needs. Individual users may opt for single-user licenses, while businesses requiring broader access may choose multi-user or enterprise licenses for cost-effective access to the report.
13. Are there any additional resources or data provided in the US Protective Coatings Market report?
While the report offers comprehensive insights, it's advisable to review the specific contents or supplementary materials provided to ascertain if additional resources or data are available.
14. How can I stay updated on further developments or reports in the US Protective Coatings Market?
To stay informed about further developments, trends, and reports in the US Protective Coatings Market, consider subscribing to industry newsletters, following relevant companies and organizations, or regularly checking reputable industry news sources and publications.
Methodology
Step 1 - Identification of Relevant Samples Size from Population Database


Step 2 - Approaches for Defining Global Market Size (Value, Volume* & Price*)

Note*: In applicable scenarios
Step 3 - Data Sources
Primary Research
- Web Analytics
- Survey Reports
- Research Institute
- Latest Research Reports
- Opinion Leaders
Secondary Research
- Annual Reports
- White Paper
- Latest Press Release
- Industry Association
- Paid Database
- Investor Presentations

Step 4 - Data Triangulation
Involves using different sources of information in order to increase the validity of a study
These sources are likely to be stakeholders in a program - participants, other researchers, program staff, other community members, and so on.
Then we put all data in single framework & apply various statistical tools to find out the dynamic on the market.
During the analysis stage, feedback from the stakeholder groups would be compared to determine areas of agreement as well as areas of divergence


