
Key Insights
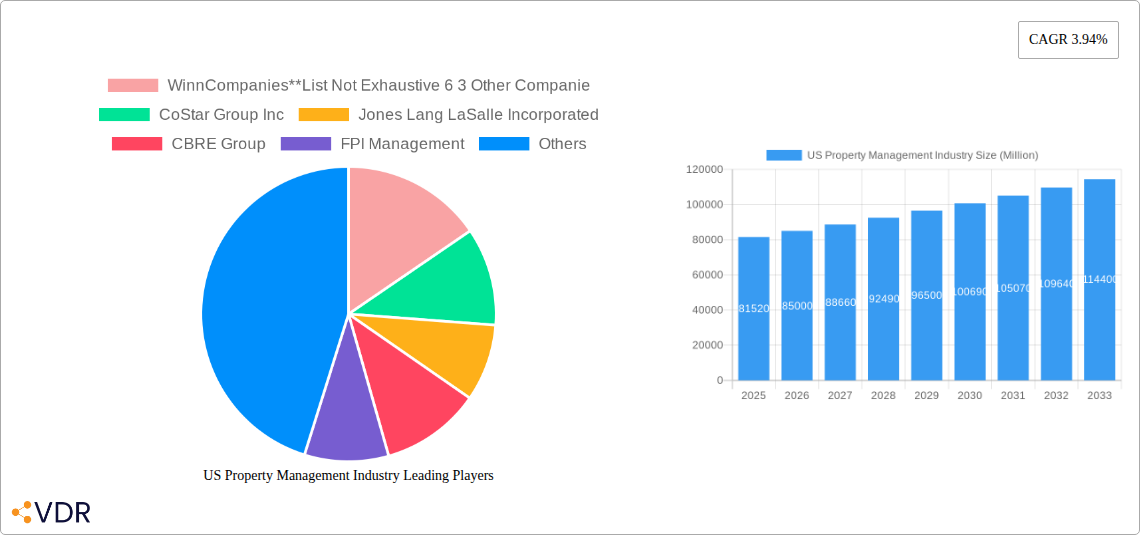
The US property management industry, currently valued at $81.52 billion in 2025, is projected to experience steady growth, exhibiting a Compound Annual Growth Rate (CAGR) of 3.94% from 2025 to 2033. This expansion is fueled by several key drivers. The burgeoning rental market, particularly in densely populated urban areas and expanding suburbs, consistently drives demand for professional property management services. Technological advancements, such as property management software and online tenant portals, are streamlining operations, improving efficiency, and attracting both property owners and tenants. Furthermore, the increasing complexity of property regulations and legal requirements necessitates expert management, further bolstering industry growth. While potential economic downturns could act as a restraint, the long-term trend points towards continued expansion, especially with the ongoing growth of the multifamily housing sector. Segmentation within the industry reveals strong performance across both residential and commercial property management, with marketing and tenant services proving particularly lucrative within the service segment. Key players like WinnCompanies, CoStar Group Inc., Jones Lang LaSalle Incorporated, and CBRE Group are well-positioned to capitalize on these market dynamics, leveraging their scale and expertise to capture market share. Regional variations exist, with potentially higher growth rates anticipated in regions experiencing rapid population growth and economic expansion.
The segmentation of the US property management market reveals diverse opportunities. The residential segment, driven by population growth and urbanization, shows strong potential. Within this segment, high-end apartment complexes and luxury rental properties command premium management fees. Commercial property management is another robust segment, encompassing office buildings, retail spaces, and industrial properties, with variations in demand based on location and economic conditions. Growth in the service segment stems from an increasing demand for specialized services such as marketing, property evaluation, tenant screening, and maintenance. The expansion of technology within the industry continues to create opportunities for companies specializing in property management software and related services. Competition in the industry is substantial, with both large national firms and smaller regional players vying for market share. However, the long-term growth outlook remains positive, with continued investment in technology and the ongoing need for professional property management services expected to fuel expansion through 2033.
US Property Management Industry Report: 2019-2033
This comprehensive report provides an in-depth analysis of the US Property Management industry, encompassing market dynamics, growth trends, key players, and future outlook. The study period covers 2019-2033, with 2025 as the base and estimated year. This report is crucial for investors, property managers, technology providers, and anyone seeking to understand this dynamic market. The report segments the market by end-user (Commercial, Residential) and service (Marketing, Property Evaluation, Tenant Services, Maintenance, Other Services), offering granular insights into each area. The total market size is predicted to reach xx Million units by 2033.
US Property Management Industry Market Dynamics & Structure
The US property management market is characterized by a moderately concentrated landscape, with large players like Greystar and CBRE holding significant market share. Technological innovation, particularly in property management software and data analytics, is a key driver. Regulatory frameworks at the state and local level influence operations, while competitive pressures from smaller, specialized firms are increasing. The market exhibits strong M&A activity, as seen in recent deals such as RealPage's acquisition of On-site Managers. Substitutes are limited, primarily encompassing direct property management by owners. End-user demographics are shifting towards a preference for rental properties, especially in urban areas, fueling market growth.
- Market Concentration: Top 5 players hold approximately xx% market share in 2025.
- Technological Innovation: Adoption of proptech solutions like smart home technology and AI-powered analytics is accelerating.
- M&A Activity: An average of xx M&A deals per year were recorded during 2019-2024.
- Regulatory Landscape: Varied local regulations concerning tenant rights and landlord responsibilities impact operational costs.
US Property Management Industry Growth Trends & Insights
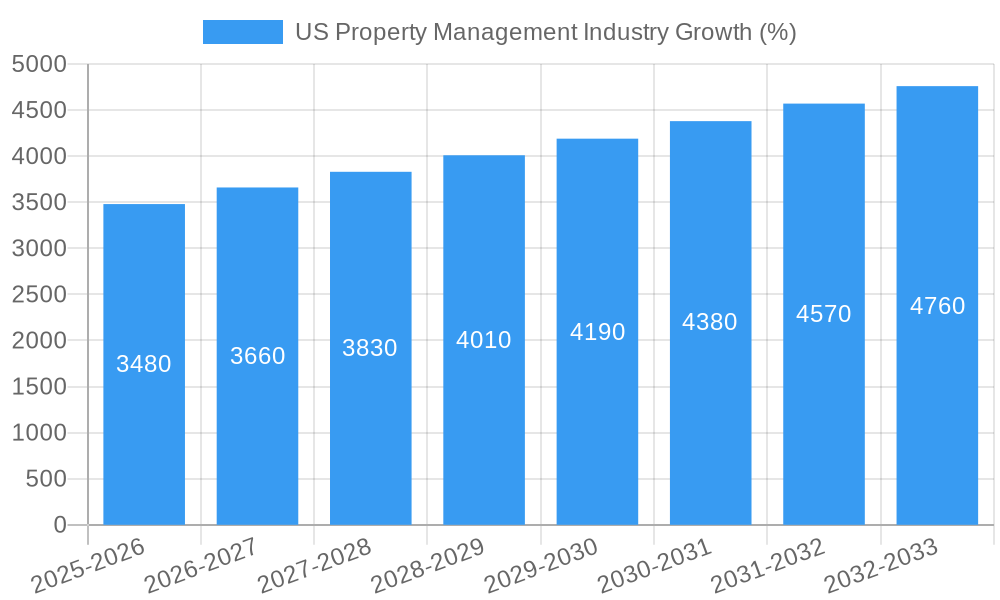
The US property management industry is experiencing robust growth, driven by increasing urbanization, shifting demographics, and the expanding rental market. The market size increased from xx million units in 2019 to xx million units in 2024, exhibiting a CAGR of xx%. Technological disruptions, such as the adoption of property management software and online leasing platforms, are streamlining operations and improving efficiency. Consumer behavior shifts towards convenience and transparency are driving demand for advanced technological solutions. The market penetration of proptech solutions is expected to reach xx% by 2033. Continued growth is anticipated, driven by factors like rising apartment rentals and increasing demand for commercial spaces.
Dominant Regions, Countries, or Segments in US Property Management Industry
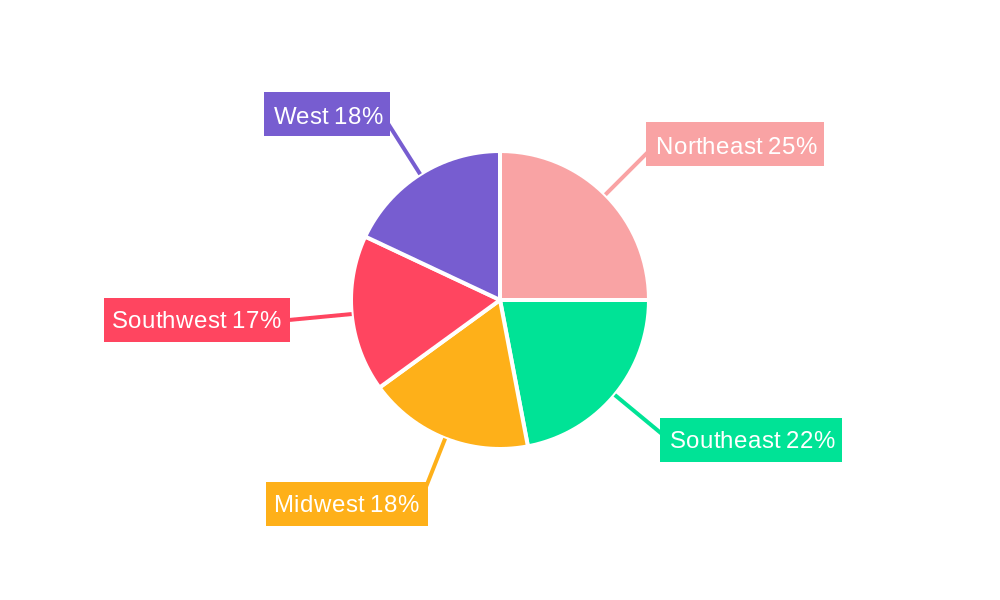
The residential segment dominates the US property management market, driven by factors such as population growth, increased housing costs, and a shift in consumer preferences. Key drivers include rising urbanization, favorable economic conditions in certain regions, and robust job growth leading to increased household formation. California, Texas, and Florida are leading states due to strong population growth and high demand for rental properties. The commercial segment also exhibits significant growth, propelled by the expansion of e-commerce and the increasing demand for flexible workspaces.
- Residential Segment Drivers: Strong rental demand in major metropolitan areas; increasing affordability concerns.
- Commercial Segment Drivers: Growth in e-commerce driving demand for warehousing and logistics; increased demand for flexible workspaces.
- Geographic Dominance: High concentration of properties and strong population growth in states like California, Texas, and Florida.
US Property Management Industry Product Landscape
The product landscape encompasses a range of software solutions, from basic property management systems to sophisticated platforms integrating data analytics, tenant communication tools, and maintenance management features. These platforms offer unique selling propositions by improving efficiency, reducing operational costs, and enhancing tenant experiences. Technological advancements in areas such as AI and machine learning are enabling predictive maintenance and personalized tenant services.
Key Drivers, Barriers & Challenges in US Property Management Industry
Key Drivers: Rising urbanization, increasing rental demand, technological advancements (PropTech), and favorable economic conditions in certain regions are major propelling forces.
Challenges: High operational costs, regulatory compliance requirements, competition from smaller, specialized firms, and labor shortages in certain areas pose significant hurdles. Supply chain disruptions in construction materials can impact new development projects and renovation efforts. The average cost of property maintenance has risen by xx% since 2019 due to inflation and supply chain disruptions.
Emerging Opportunities in US Property Management Industry
Emerging opportunities include the expansion of services into underserved markets, the development of specialized services for niche property types (e.g., senior housing, student housing), and the integration of sustainable practices into property management. Growing demand for flexible workspaces and the increasing adoption of smart home technology present significant growth avenues.
Growth Accelerators in the US Property Management Industry
Technological advancements in property management software, strategic partnerships between property management companies and technology providers, and expansion into new geographic markets are key catalysts for long-term growth. The increasing adoption of data analytics for improved decision-making and the development of innovative service offerings will further fuel market expansion.
Key Players Shaping the US Property Management Industry Market
- WinnCompanies
- List Not Exhaustive 6
- 3 Other Companies
- CoStar Group Inc
- Jones Lang LaSalle Incorporated
- CBRE Group
- FPI Management
- Equity Residential
- Greystar Real Estate Partners
- Pinnacle Property Management
- AvalonBay Communities
- Lincoln Property Company
Notable Milestones in US Property Management Industry Sector
- February 2024: Wood Partners sold its property management business (38,000+ units) to Greystar, consolidating market share.
- November 2023: RealPage Inc. acquired On-site Managers Inc. for USD 250 million, strengthening its position in the on-demand leasing platform market.
In-Depth US Property Management Industry Market Outlook
The US property management market is poised for continued growth, driven by technological innovation, expanding rental markets, and a favorable economic outlook. Strategic partnerships, the adoption of sustainable practices, and expansion into niche markets will shape the future landscape. The market is expected to witness substantial growth over the forecast period (2025-2033), with significant opportunities for established players and new entrants alike.
US Property Management Industry Segmentation
-
1. End User
- 1.1. Commercial
- 1.2. Residential
-
2. Service
- 2.1. Marketing
- 2.2. Property Evaluation
- 2.3. Tenant Services
- 2.4. Maintenance
- 2.5. Other Services
US Property Management Industry Segmentation By Geography
-
1. North America
- 1.1. United States
- 1.2. Canada
- 1.3. Mexico
-
2. South America
- 2.1. Brazil
- 2.2. Argentina
- 2.3. Rest of South America
-
3. Europe
- 3.1. United Kingdom
- 3.2. Germany
- 3.3. France
- 3.4. Italy
- 3.5. Spain
- 3.6. Russia
- 3.7. Benelux
- 3.8. Nordics
- 3.9. Rest of Europe
-
4. Middle East & Africa
- 4.1. Turkey
- 4.2. Israel
- 4.3. GCC
- 4.4. North Africa
- 4.5. South Africa
- 4.6. Rest of Middle East & Africa
-
5. Asia Pacific
- 5.1. China
- 5.2. India
- 5.3. Japan
- 5.4. South Korea
- 5.5. ASEAN
- 5.6. Oceania
- 5.7. Rest of Asia Pacific
US Property Management Industry REPORT HIGHLIGHTS
| Aspects | Details |
|---|---|
| Study Period | 2019-2033 |
| Base Year | 2024 |
| Estimated Year | 2025 |
| Forecast Period | 2025-2033 |
| Historical Period | 2019-2024 |
| Growth Rate | CAGR of 3.94% from 2019-2033 |
| Segmentation |
|
Table of Contents
- 1. Introduction
- 1.1. Research Scope
- 1.2. Market Segmentation
- 1.3. Research Methodology
- 1.4. Definitions and Assumptions
- 2. Executive Summary
- 2.1. Introduction
- 3. Market Dynamics
- 3.1. Introduction
- 3.2. Market Drivers
- 3.2.1. Increasing Demand from the Commercial Segment is Driving the Market; Increasing Disposable Income of Consumers is Driving the market
- 3.3. Market Restrains
- 3.3.1. Economic Uncertainties are Restraining the Market
- 3.4. Market Trends
- 3.4.1. Demand from the Residential Sector is Supporting the Market
- 4. Market Factor Analysis
- 4.1. Porters Five Forces
- 4.2. Supply/Value Chain
- 4.3. PESTEL analysis
- 4.4. Market Entropy
- 4.5. Patent/Trademark Analysis
- 5. Global US Property Management Industry Analysis, Insights and Forecast, 2019-2031
- 5.1. Market Analysis, Insights and Forecast - by End User
- 5.1.1. Commercial
- 5.1.2. Residential
- 5.2. Market Analysis, Insights and Forecast - by Service
- 5.2.1. Marketing
- 5.2.2. Property Evaluation
- 5.2.3. Tenant Services
- 5.2.4. Maintenance
- 5.2.5. Other Services
- 5.3. Market Analysis, Insights and Forecast - by Region
- 5.3.1. North America
- 5.3.2. South America
- 5.3.3. Europe
- 5.3.4. Middle East & Africa
- 5.3.5. Asia Pacific
- 5.1. Market Analysis, Insights and Forecast - by End User
- 6. North America US Property Management Industry Analysis, Insights and Forecast, 2019-2031
- 6.1. Market Analysis, Insights and Forecast - by End User
- 6.1.1. Commercial
- 6.1.2. Residential
- 6.2. Market Analysis, Insights and Forecast - by Service
- 6.2.1. Marketing
- 6.2.2. Property Evaluation
- 6.2.3. Tenant Services
- 6.2.4. Maintenance
- 6.2.5. Other Services
- 6.1. Market Analysis, Insights and Forecast - by End User
- 7. South America US Property Management Industry Analysis, Insights and Forecast, 2019-2031
- 7.1. Market Analysis, Insights and Forecast - by End User
- 7.1.1. Commercial
- 7.1.2. Residential
- 7.2. Market Analysis, Insights and Forecast - by Service
- 7.2.1. Marketing
- 7.2.2. Property Evaluation
- 7.2.3. Tenant Services
- 7.2.4. Maintenance
- 7.2.5. Other Services
- 7.1. Market Analysis, Insights and Forecast - by End User
- 8. Europe US Property Management Industry Analysis, Insights and Forecast, 2019-2031
- 8.1. Market Analysis, Insights and Forecast - by End User
- 8.1.1. Commercial
- 8.1.2. Residential
- 8.2. Market Analysis, Insights and Forecast - by Service
- 8.2.1. Marketing
- 8.2.2. Property Evaluation
- 8.2.3. Tenant Services
- 8.2.4. Maintenance
- 8.2.5. Other Services
- 8.1. Market Analysis, Insights and Forecast - by End User
- 9. Middle East & Africa US Property Management Industry Analysis, Insights and Forecast, 2019-2031
- 9.1. Market Analysis, Insights and Forecast - by End User
- 9.1.1. Commercial
- 9.1.2. Residential
- 9.2. Market Analysis, Insights and Forecast - by Service
- 9.2.1. Marketing
- 9.2.2. Property Evaluation
- 9.2.3. Tenant Services
- 9.2.4. Maintenance
- 9.2.5. Other Services
- 9.1. Market Analysis, Insights and Forecast - by End User
- 10. Asia Pacific US Property Management Industry Analysis, Insights and Forecast, 2019-2031
- 10.1. Market Analysis, Insights and Forecast - by End User
- 10.1.1. Commercial
- 10.1.2. Residential
- 10.2. Market Analysis, Insights and Forecast - by Service
- 10.2.1. Marketing
- 10.2.2. Property Evaluation
- 10.2.3. Tenant Services
- 10.2.4. Maintenance
- 10.2.5. Other Services
- 10.1. Market Analysis, Insights and Forecast - by End User
- 11. Northeast US Property Management Industry Analysis, Insights and Forecast, 2019-2031
- 12. Southeast US Property Management Industry Analysis, Insights and Forecast, 2019-2031
- 13. Midwest US Property Management Industry Analysis, Insights and Forecast, 2019-2031
- 14. Southwest US Property Management Industry Analysis, Insights and Forecast, 2019-2031
- 15. West US Property Management Industry Analysis, Insights and Forecast, 2019-2031
- 16. Competitive Analysis
- 16.1. Global Market Share Analysis 2024
- 16.2. Company Profiles
- 16.2.1 WinnCompanies**List Not Exhaustive 6 3 Other Companie
- 16.2.1.1. Overview
- 16.2.1.2. Products
- 16.2.1.3. SWOT Analysis
- 16.2.1.4. Recent Developments
- 16.2.1.5. Financials (Based on Availability)
- 16.2.2 CoStar Group Inc
- 16.2.2.1. Overview
- 16.2.2.2. Products
- 16.2.2.3. SWOT Analysis
- 16.2.2.4. Recent Developments
- 16.2.2.5. Financials (Based on Availability)
- 16.2.3 Jones Lang LaSalle Incorporated
- 16.2.3.1. Overview
- 16.2.3.2. Products
- 16.2.3.3. SWOT Analysis
- 16.2.3.4. Recent Developments
- 16.2.3.5. Financials (Based on Availability)
- 16.2.4 CBRE Group
- 16.2.4.1. Overview
- 16.2.4.2. Products
- 16.2.4.3. SWOT Analysis
- 16.2.4.4. Recent Developments
- 16.2.4.5. Financials (Based on Availability)
- 16.2.5 FPI Management
- 16.2.5.1. Overview
- 16.2.5.2. Products
- 16.2.5.3. SWOT Analysis
- 16.2.5.4. Recent Developments
- 16.2.5.5. Financials (Based on Availability)
- 16.2.6 Equity Residential
- 16.2.6.1. Overview
- 16.2.6.2. Products
- 16.2.6.3. SWOT Analysis
- 16.2.6.4. Recent Developments
- 16.2.6.5. Financials (Based on Availability)
- 16.2.7 Greystar Real Estate Partners
- 16.2.7.1. Overview
- 16.2.7.2. Products
- 16.2.7.3. SWOT Analysis
- 16.2.7.4. Recent Developments
- 16.2.7.5. Financials (Based on Availability)
- 16.2.8 Pinnacle Property Management
- 16.2.8.1. Overview
- 16.2.8.2. Products
- 16.2.8.3. SWOT Analysis
- 16.2.8.4. Recent Developments
- 16.2.8.5. Financials (Based on Availability)
- 16.2.9 AvalonBay Communities
- 16.2.9.1. Overview
- 16.2.9.2. Products
- 16.2.9.3. SWOT Analysis
- 16.2.9.4. Recent Developments
- 16.2.9.5. Financials (Based on Availability)
- 16.2.10 Lincoln Property Company
- 16.2.10.1. Overview
- 16.2.10.2. Products
- 16.2.10.3. SWOT Analysis
- 16.2.10.4. Recent Developments
- 16.2.10.5. Financials (Based on Availability)
- 16.2.1 WinnCompanies**List Not Exhaustive 6 3 Other Companie
List of Figures
- Figure 1: Global US Property Management Industry Revenue Breakdown (Million, %) by Region 2024 & 2032
- Figure 2: United states US Property Management Industry Revenue (Million), by Country 2024 & 2032
- Figure 3: United states US Property Management Industry Revenue Share (%), by Country 2024 & 2032
- Figure 4: North America US Property Management Industry Revenue (Million), by End User 2024 & 2032
- Figure 5: North America US Property Management Industry Revenue Share (%), by End User 2024 & 2032
- Figure 6: North America US Property Management Industry Revenue (Million), by Service 2024 & 2032
- Figure 7: North America US Property Management Industry Revenue Share (%), by Service 2024 & 2032
- Figure 8: North America US Property Management Industry Revenue (Million), by Country 2024 & 2032
- Figure 9: North America US Property Management Industry Revenue Share (%), by Country 2024 & 2032
- Figure 10: South America US Property Management Industry Revenue (Million), by End User 2024 & 2032
- Figure 11: South America US Property Management Industry Revenue Share (%), by End User 2024 & 2032
- Figure 12: South America US Property Management Industry Revenue (Million), by Service 2024 & 2032
- Figure 13: South America US Property Management Industry Revenue Share (%), by Service 2024 & 2032
- Figure 14: South America US Property Management Industry Revenue (Million), by Country 2024 & 2032
- Figure 15: South America US Property Management Industry Revenue Share (%), by Country 2024 & 2032
- Figure 16: Europe US Property Management Industry Revenue (Million), by End User 2024 & 2032
- Figure 17: Europe US Property Management Industry Revenue Share (%), by End User 2024 & 2032
- Figure 18: Europe US Property Management Industry Revenue (Million), by Service 2024 & 2032
- Figure 19: Europe US Property Management Industry Revenue Share (%), by Service 2024 & 2032
- Figure 20: Europe US Property Management Industry Revenue (Million), by Country 2024 & 2032
- Figure 21: Europe US Property Management Industry Revenue Share (%), by Country 2024 & 2032
- Figure 22: Middle East & Africa US Property Management Industry Revenue (Million), by End User 2024 & 2032
- Figure 23: Middle East & Africa US Property Management Industry Revenue Share (%), by End User 2024 & 2032
- Figure 24: Middle East & Africa US Property Management Industry Revenue (Million), by Service 2024 & 2032
- Figure 25: Middle East & Africa US Property Management Industry Revenue Share (%), by Service 2024 & 2032
- Figure 26: Middle East & Africa US Property Management Industry Revenue (Million), by Country 2024 & 2032
- Figure 27: Middle East & Africa US Property Management Industry Revenue Share (%), by Country 2024 & 2032
- Figure 28: Asia Pacific US Property Management Industry Revenue (Million), by End User 2024 & 2032
- Figure 29: Asia Pacific US Property Management Industry Revenue Share (%), by End User 2024 & 2032
- Figure 30: Asia Pacific US Property Management Industry Revenue (Million), by Service 2024 & 2032
- Figure 31: Asia Pacific US Property Management Industry Revenue Share (%), by Service 2024 & 2032
- Figure 32: Asia Pacific US Property Management Industry Revenue (Million), by Country 2024 & 2032
- Figure 33: Asia Pacific US Property Management Industry Revenue Share (%), by Country 2024 & 2032
List of Tables
- Table 1: Global US Property Management Industry Revenue Million Forecast, by Region 2019 & 2032
- Table 2: Global US Property Management Industry Revenue Million Forecast, by End User 2019 & 2032
- Table 3: Global US Property Management Industry Revenue Million Forecast, by Service 2019 & 2032
- Table 4: Global US Property Management Industry Revenue Million Forecast, by Region 2019 & 2032
- Table 5: Global US Property Management Industry Revenue Million Forecast, by Country 2019 & 2032
- Table 6: Northeast US Property Management Industry Revenue (Million) Forecast, by Application 2019 & 2032
- Table 7: Southeast US Property Management Industry Revenue (Million) Forecast, by Application 2019 & 2032
- Table 8: Midwest US Property Management Industry Revenue (Million) Forecast, by Application 2019 & 2032
- Table 9: Southwest US Property Management Industry Revenue (Million) Forecast, by Application 2019 & 2032
- Table 10: West US Property Management Industry Revenue (Million) Forecast, by Application 2019 & 2032
- Table 11: Global US Property Management Industry Revenue Million Forecast, by End User 2019 & 2032
- Table 12: Global US Property Management Industry Revenue Million Forecast, by Service 2019 & 2032
- Table 13: Global US Property Management Industry Revenue Million Forecast, by Country 2019 & 2032
- Table 14: United States US Property Management Industry Revenue (Million) Forecast, by Application 2019 & 2032
- Table 15: Canada US Property Management Industry Revenue (Million) Forecast, by Application 2019 & 2032
- Table 16: Mexico US Property Management Industry Revenue (Million) Forecast, by Application 2019 & 2032
- Table 17: Global US Property Management Industry Revenue Million Forecast, by End User 2019 & 2032
- Table 18: Global US Property Management Industry Revenue Million Forecast, by Service 2019 & 2032
- Table 19: Global US Property Management Industry Revenue Million Forecast, by Country 2019 & 2032
- Table 20: Brazil US Property Management Industry Revenue (Million) Forecast, by Application 2019 & 2032
- Table 21: Argentina US Property Management Industry Revenue (Million) Forecast, by Application 2019 & 2032
- Table 22: Rest of South America US Property Management Industry Revenue (Million) Forecast, by Application 2019 & 2032
- Table 23: Global US Property Management Industry Revenue Million Forecast, by End User 2019 & 2032
- Table 24: Global US Property Management Industry Revenue Million Forecast, by Service 2019 & 2032
- Table 25: Global US Property Management Industry Revenue Million Forecast, by Country 2019 & 2032
- Table 26: United Kingdom US Property Management Industry Revenue (Million) Forecast, by Application 2019 & 2032
- Table 27: Germany US Property Management Industry Revenue (Million) Forecast, by Application 2019 & 2032
- Table 28: France US Property Management Industry Revenue (Million) Forecast, by Application 2019 & 2032
- Table 29: Italy US Property Management Industry Revenue (Million) Forecast, by Application 2019 & 2032
- Table 30: Spain US Property Management Industry Revenue (Million) Forecast, by Application 2019 & 2032
- Table 31: Russia US Property Management Industry Revenue (Million) Forecast, by Application 2019 & 2032
- Table 32: Benelux US Property Management Industry Revenue (Million) Forecast, by Application 2019 & 2032
- Table 33: Nordics US Property Management Industry Revenue (Million) Forecast, by Application 2019 & 2032
- Table 34: Rest of Europe US Property Management Industry Revenue (Million) Forecast, by Application 2019 & 2032
- Table 35: Global US Property Management Industry Revenue Million Forecast, by End User 2019 & 2032
- Table 36: Global US Property Management Industry Revenue Million Forecast, by Service 2019 & 2032
- Table 37: Global US Property Management Industry Revenue Million Forecast, by Country 2019 & 2032
- Table 38: Turkey US Property Management Industry Revenue (Million) Forecast, by Application 2019 & 2032
- Table 39: Israel US Property Management Industry Revenue (Million) Forecast, by Application 2019 & 2032
- Table 40: GCC US Property Management Industry Revenue (Million) Forecast, by Application 2019 & 2032
- Table 41: North Africa US Property Management Industry Revenue (Million) Forecast, by Application 2019 & 2032
- Table 42: South Africa US Property Management Industry Revenue (Million) Forecast, by Application 2019 & 2032
- Table 43: Rest of Middle East & Africa US Property Management Industry Revenue (Million) Forecast, by Application 2019 & 2032
- Table 44: Global US Property Management Industry Revenue Million Forecast, by End User 2019 & 2032
- Table 45: Global US Property Management Industry Revenue Million Forecast, by Service 2019 & 2032
- Table 46: Global US Property Management Industry Revenue Million Forecast, by Country 2019 & 2032
- Table 47: China US Property Management Industry Revenue (Million) Forecast, by Application 2019 & 2032
- Table 48: India US Property Management Industry Revenue (Million) Forecast, by Application 2019 & 2032
- Table 49: Japan US Property Management Industry Revenue (Million) Forecast, by Application 2019 & 2032
- Table 50: South Korea US Property Management Industry Revenue (Million) Forecast, by Application 2019 & 2032
- Table 51: ASEAN US Property Management Industry Revenue (Million) Forecast, by Application 2019 & 2032
- Table 52: Oceania US Property Management Industry Revenue (Million) Forecast, by Application 2019 & 2032
- Table 53: Rest of Asia Pacific US Property Management Industry Revenue (Million) Forecast, by Application 2019 & 2032
Frequently Asked Questions
1. What is the projected Compound Annual Growth Rate (CAGR) of the US Property Management Industry?
The projected CAGR is approximately 3.94%.
2. Which companies are prominent players in the US Property Management Industry?
Key companies in the market include WinnCompanies**List Not Exhaustive 6 3 Other Companie, CoStar Group Inc, Jones Lang LaSalle Incorporated, CBRE Group, FPI Management, Equity Residential, Greystar Real Estate Partners, Pinnacle Property Management, AvalonBay Communities, Lincoln Property Company.
3. What are the main segments of the US Property Management Industry?
The market segments include End User, Service.
4. Can you provide details about the market size?
The market size is estimated to be USD 81.52 Million as of 2022.
5. What are some drivers contributing to market growth?
Increasing Demand from the Commercial Segment is Driving the Market; Increasing Disposable Income of Consumers is Driving the market.
6. What are the notable trends driving market growth?
Demand from the Residential Sector is Supporting the Market.
7. Are there any restraints impacting market growth?
Economic Uncertainties are Restraining the Market.
8. Can you provide examples of recent developments in the market?
February 2024: Wood Partners, the 4th-largest real estate developer in the United States, sold its property management business for its 38,000+ units in 17 states to Greystar (Charleston, South Carolina), the country's largest apartment management company.
9. What pricing options are available for accessing the report?
Pricing options include single-user, multi-user, and enterprise licenses priced at USD 3800, USD 4500, and USD 5800 respectively.
10. Is the market size provided in terms of value or volume?
The market size is provided in terms of value, measured in Million.
11. Are there any specific market keywords associated with the report?
Yes, the market keyword associated with the report is "US Property Management Industry," which aids in identifying and referencing the specific market segment covered.
12. How do I determine which pricing option suits my needs best?
The pricing options vary based on user requirements and access needs. Individual users may opt for single-user licenses, while businesses requiring broader access may choose multi-user or enterprise licenses for cost-effective access to the report.
13. Are there any additional resources or data provided in the US Property Management Industry report?
While the report offers comprehensive insights, it's advisable to review the specific contents or supplementary materials provided to ascertain if additional resources or data are available.
14. How can I stay updated on further developments or reports in the US Property Management Industry?
To stay informed about further developments, trends, and reports in the US Property Management Industry, consider subscribing to industry newsletters, following relevant companies and organizations, or regularly checking reputable industry news sources and publications.
Methodology
Step 1 - Identification of Relevant Samples Size from Population Database


Step 2 - Approaches for Defining Global Market Size (Value, Volume* & Price*)

Note*: In applicable scenarios
Step 3 - Data Sources
Primary Research
- Web Analytics
- Survey Reports
- Research Institute
- Latest Research Reports
- Opinion Leaders
Secondary Research
- Annual Reports
- White Paper
- Latest Press Release
- Industry Association
- Paid Database
- Investor Presentations

Step 4 - Data Triangulation
Involves using different sources of information in order to increase the validity of a study
These sources are likely to be stakeholders in a program - participants, other researchers, program staff, other community members, and so on.
Then we put all data in single framework & apply various statistical tools to find out the dynamic on the market.
During the analysis stage, feedback from the stakeholder groups would be compared to determine areas of agreement as well as areas of divergence


